Biomarkers study in rainbow
trout exposed to industrially
contaminated groundwater
Nadjet Benchalgo,1François Gagné,2 Michel Fournier11INRS-Institut Armand-Frappier, Laval; 2Emerging Methods, Aquatic Contaminant Research Division, Environment Canada, Montréal, Quebec, Canada
Abstract
The spill of liquid industrial waste from chemical and petrochemical industries in Mercier lagoons located 20 km south of Montreal, Quebec, caused a major groundwa-ter contamination by industrial contaminants. The aim of this study was to investigate the toxic effects of Mercier groundwater, following 4 and 14 days of exposure to graded concentra-tions from three wells at increasing distances 1.2, 2.7 and 5.4 km from the source of contam-ination. Rainbow trout were examined for sev-eral biomarkers of defense [ethoxyresorufin
O-deethylase (EROD) and gluthatione
S-trans-ferase (GST) activities] and those of tissue damage [lipid peroxidation (LPO) and DNA strand breaks]. The results showed that EROD activity was significantly enhanced in hepatic tissue at 1.2 and 5.4 km, whereas inhibition in activity was observed in group at 2.7 km. Therefore, GST activity was significantly increased at 3.1% concentration for the 2.7 km well. No change in LPO was observed. However, a significant induction of DNA strand breaks in liver was obtained at each distance. In conclusion, the data suggest that the release of these contaminants in groundwater leads to increased biotransformation for copla-nar aromatic hydrocarbons and DNA damage in groundwater.
Introduction
The dumping of 40,000 to 170,000 m³ of industrial hydrocarbon waste in an abandoned gravel pit (Mercier, Quebec, Canada) caused severe water supply problems in the region.1
The main industrial waste consisted of used oil from chemical and petrochemical indus-tries.2In the gravel pit lagoon, the
contami-nants permeate through soil down to the groundwater. Among the organic compounds found, volatiles organic compounds (VOCs) (Table 1) such as vinyl chloride (chloroethene), trans 1,2-dichloroethylene, 1,1-dichloroethane, 1,2-dichloroethane, cis
1,2-dichloroethene, benzene, chlorobenzene, m+p-xylènes, chloroethane, 1,3-dichloro-propane and phenol.1-3Their physicochemical
properties and hydrogeological conditions of the site are responsible of the complexity of contamination problem.4Even if the lagoons
are the main source of contamination, the industrial waste incinerator may be consid-ered as well.
Organic industrial wastes containing VOCs, polyaromatic hydrocarbons (PAHs), polychlori-nated biphenyls (PCBs) and metals are usual-ly found at hazardous waste sites.5They are
known to produce a variety of adverse effects in organism including, immunotoxicity,6,7
genotoxicity8-10and carcinogenesis.11-13Those
contaminants are able to induce the biotrans-formation enzyme cytochrome P450 and glu-tathione S-transferase in fish12,14-16and induce
lipid peroxidation (LPO) and DNA strand breaks in exposed animals.9,17,18
Although chemical analysis could find some of chemicals in these complex mixtures, it remains difficult to determine the cumulative effects in exposed organisms. The measure-ment of biomarkers represent a mean to deter-mine the toxicological outcome of exposure to complex industrial contaminants mixtures19,20
and give early warning signals about environ-mental threats of contaminants.21 Indeed,
exposure to PAHs leads to the induction of cytochrome P4501A1 responsible for ethoxyre-sorufin-O-deethylase (EROD) activity in fish liver and kidney.22-24 Gwinn et al.9 showed that
certain volatile organic compounds (e.g. vinyl chloride, dichloroethane) are metabolized via oxidation mediated by CYP 450 system to form electrophilic metabolites which may be detoxi-fied by glutathione S-transferase (GSTs).
Glutathione S-transferase is an important phase II enzyme that catalyses the conjugation of electrophilic compounds to GSH,25 GST
reacts with a wide spectrum of environmental pollutants.26,27 It has been reported that the
enzyme GST react differently to a variety of compounds.18 These same authors, reported
that GST was inhibited by benzene, whereas its activity was enhanced in animals exposed to 2,4-dichlorophenol.28 Since this reaction
consumes reduced glutathione, sustained or increased activity could lead to oxidative stress in cells.
The measurement of LPO levels in animal tissues has been recognized as biomarkers of oxidative damage towards unsaturated phos-pholipids.18,20LPO is reported to cause loss of
cell function under oxidative stress.29
Genotoxicity was determined by evaluating DNA strand breaks and has been proposed as effective biomarkers in assessing the impact of contaminants released into the aquatic environment.30Sasaki et al.31showed hepatic
DNA damage in rodents exposed to
1,2-dichloroethane (EDC). Exposure to benzene leads to single strand breaks in erythrocytes in rodents.10However, the toxicity of EDC has yet
to be examined in fish. In this context, the present study was carried out to investigate biomarkers enzyme effects of Mercier ground-water exposure on rainbow trout. A set of bio-markers of defense and tissue damage were measured in the liver of trout exposed to groundwater at various distances from the landfill.
Materials and methods
Fish
Juvenile rainbow trout (O. mykiss) (total N=216), weighing 23.14±9.3 g, were obtained from a local fish farm Les Arpents Verts (Sainte-Edwidge-de-Clifton, Quebec, Canada). They were kept for a minimum of 2 weeks in 300-L tanks at 15°C under a photoperiod of 12 h light: 12 h dark and constant aeration. They were fed daily at a rate of 2% body weight with food pellets.
Correspondence: Nadjet Benchalgo, Institut National de la recherche Scientifique, Institut Armand-Frappier, 531 Boulevard des Prairies, Laval, Québec, Canada H7V 1B7.
Tel. +1.514.725.8394.
E-mail: [email protected]
Key words: groundwater, ethoxyresorufin O-deethylase, gluthatione S-transferase activity, lipid peroxidation, DNA strand breaks, rainbow trout.
Acknowledgments: this study was supported by the Canada Research Chair in Environmental Immunotoxicology (Dr M. Fournier) and Aquatic Contaminant Research Division, Environment Canada (Dr F. Gagné). The authors are thankful to Mr Julien Paquette and Michel Paquin from Ministry of Sustainable Development, Environment and Parks (Quebec) for their pre-cious help in water sampling.
Conflict of interests: the authors declare no con-flicts of interests.
Received for publication: 28 October 2013. Revision received: 13 December 2013. Accepted for publication: 16 January 2014. This work is licensed under a Creative Commons Attribution NonCommercial 3.0 License (CC BY-NC 3.0).
©Copyright N. Benchalgo et al., 2014 Licensee PAGEPress, Italy
Journal of Xenobiotics 2014; 4:1991 doi:10.4081/xeno.2014.1991
Non-commercial
Groundwater exposure experiments
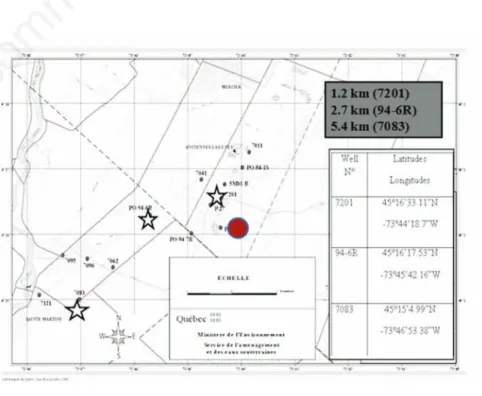
The groundwater samples were collected in the summer of may 2010 from three wells at 1.2, 2.7 and 5.4 km from Mercier lagoons (Figure 1). These samples were then stored at 4°C in the dark until exposure. In six plastic vessels (31 cm diameter ¥ 44 cm height, 20 L capacity) filled with 15 L of water sample using polyethylene plastic bags, six groups of 12 juve-nile rainbow trout were exposed to increasing concentrations of groundwater (3.1% and 50%) for 4 days and 14 days at 15°C. The con-trol group and the dilution water consisted of UV- and charcoal-treated tap water from the City of Montréal (Quebec, Canada). The expo-sure experiments were repeated twice and the water was changed twice a week. The fish were fed 3 times weekly with commercial fish pellets and the extra food was removed after 10 min. The feeding was stopped 24 h before the end of the exposure. Water chemistry (e.g., temperature, pH, oxygen, conductivity, nitrate-nitrite and ammonia) according to standard methods of the Centre d’Expertise en Analyse
Environnementale of the province of Quebec3
was within acceptable limits. The following
organic VOC parameters were determined: vinyl chloride, trans1, 2-dichloroethylene, 1-1 dichloroethane, 1, dichloroethane, cis1, 2-dichloroethene, benzene, and chlorobenzene (Table 2).32-34
Biochemical analyses
Fish were humanely anaesthetized with tri-caine methanesulfonate 0.1% (MS222) (Sigma-Aldrich, ON, Canada) after 4 days and 14 days (n=6), in accordance with the recom-mendations of the animal care committee and length and body weight measured. Condition factor (CF) for each fish was calculated accord-ing to the followaccord-ing equation (White and Fletcher, 1985):
CF = body weight (g) / fork length³ (cm)
¥100 (1)
and the hepatosomatic index (HSI) was deter-mined by the following:
liver weight / body weight * 100 (2)
Fish samples were conserved at −80°C until
biochemical analyses. Frozen livers were thawed and homogenized (20 s duration) using a Teflon pestle tissue grinder in an ice-cold homogenization buffer (10 mM Hepes-NaOH, pH 7.4 containing 140 mM NaCl, 1 mM dithiothreitol and 1 mg/mL aprotinin (a pro-tease inhibitor). Aliquots of each homogenate were taken for LPO, DNA strand break determi-nations and protein concentrations. The remainder of the homogenate was centrifuged at 15,000 g for 20 min at 4°C. The supernatant (S15) was collected to measure 7-ethoxyre-sorufin-O-deethylase activity, GST activity and proteins. These biomarkers were normalized with both homogenate and S15 protein con-centrations as determined by the method of Bradford35 using standards of bovine serum
albumin.
7-Ethoxyresorufin-O-deethylase
7-ethoxyresorufin-O-deethylase activity was measured according to Gagné and Blaise36
method. The reaction mixture contained 50 µL of S15 and 160 µL of 50 µM 7-ethoxyresorufin in 10 mM Tris-HCL, pH 7.4 and Tween 20. The reaction was started by the addition of 10 µL
Table 1. Samples of water collected in campaign 2010 from 15 wells in order to study the quality of Mercier groundwater. Analysis showed that approximately half of wells (7 wells) have concentrations of volatiles organic compounds higher than detection limit [(the concentration values (µg/L)]. Vinyl chloride concentrations within a well ranged up to 0.5 ug/L and a maximum concentration of 85 ug/L was recorded in one well. Analyses were provided by the Centre d'Expertise en Analyse Environnementale of the province of Quebec, and determined according to their standard methods (CAEQ,2010)
Compounds N° of Wells 94-7R 7121 94-1S 94-5S 5M-81-B 94-6R PW-09 DLM Chlorure de vinyl 3.5 - 85 0.7 0.5 4.0 0.5 0.1 Trans-1,2-Dichloroethylene 0.42 - 0.4 - - 2.0 - 0.08 1,1-Dichloroethane 0.17 - 2.2 - - 0.2 - 0.08 Cis-1,2- Dichloroethene 0.25 - 7.0 - - 0.37 - 0.05 Benzene 0.15 - - - 0.08 0.29 - 0.05 1,2-Dichloroethane 0.1 - - - 0.5 0.41 - 0.1 m +p-Xylenes - 0.21 - - - 0.14 Chloroethane - - 1.7 - - - - 0.1 1,1-Dichloroethene - - 5.7 - - - - 0.1 1,3-Dichloropropane - - 0.5 - - - - 0.1 Chlorobenzene - - 0.56 - - - - 0.05
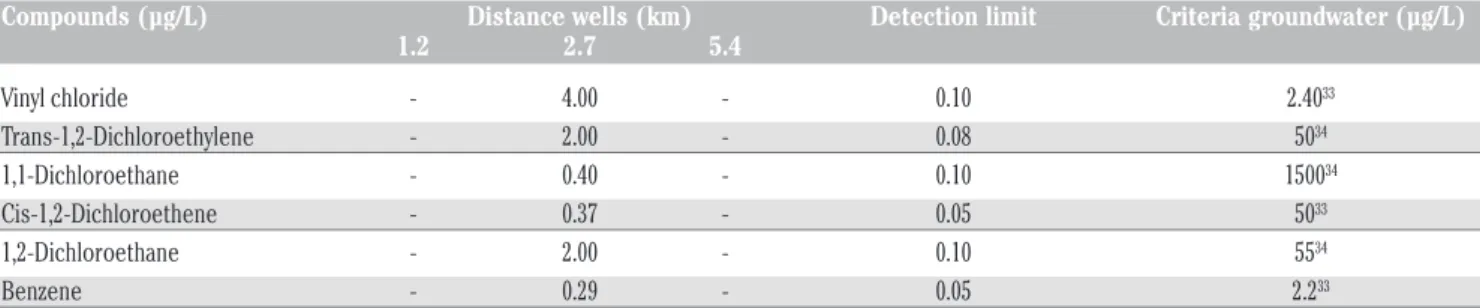
Table 2. Summary of analytical results of groundwater sites at 1.2, 2.7 and 5.4 km sampled for 61 organic contaminants (data present-ed only compounds with concentration above limit detection).
Compounds (µg/L) Distance wells (km) Detection limit Criteria groundwater (µg/L)
1.2 2.7 5.4 Vinyl chloride - 4.00 - 0.10 2.4033 Trans-1,2-Dichloroethylene - 2.00 - 0.08 5034 1,1-Dichloroethane - 0.40 - 0.10 150034 Cis-1,2-Dichloroethene - 0.37 - 0.05 5033 1,2-Dichloroethane - 2.00 - 0.10 5534 Benzene - 0.29 - 0.05 2.233
Values of measurements during sampling in may 2010. (-) No detected.
Non-commercial
NADPH 1 mM. The mixture was incubated at room temperature for 30 and 60 min where flu-orescence of resorufin was measured using 535 nm (excitation) and 635 nm (emission) filters. Calibration was achieved by comparing the rate of fluorescence change in the samples with fluorescence of resorufin standards. Enzyme activity (EROD) was expressed in nmol of resorufin/min/mg of proteins.
Lipid peroxidation
Lipid peroxidation was measured according to the thiobarbituric acid method (Wills, 1987). A volume of 150 µL of the homogenate were mixed with 300 µL of 10% trichloroacetic acid solution containing 1 mM FeSO4 and 150 µL of 0.67% thiobarbituric acid. The mixture was allowed to stand in a water bath (70°C) for 10 min. Standards solutions were prepared with 0.001% of tetramethoxypropane for calibration. The thiobarbituric acid reactants (TBARS) were measured by fluorescence at 540 nm (excitation) and 590 nm (emission). Results were expressed in nmol of malonaldehyde equivalents per mg of proteins.
DNA strand breaks
DNA strand breaks were determined using the alkaline precipitation.37 Briefly, 25 µL of the
homogenate was added to 200 µL of SDS solu-tion 2% containing 40 mM NaOH, 10 mM Trisma base and 10 mM EDTA. An equal of vol-ume of 0.12 M KCl was added to the mixture which was allowed to stand in water bath 60°C for 10 min, and then cooled at 4°C for 30 min; to precipitate SDS associated nucleoproteins and genomic DNA. The mixture was then cen-trifuged at 8000 g for 5 min. DNA present in the supernatant were measured by mixing 50 µL of the supernatant with 150 µL of Hoechst dye at a concentration of 1 µg/mL in 0.4M NaCl, 4 mM sodium cholate and 0.1 M tris-acetate pH 8.5. Fluorescence was then assessed using 360 nm (excitation) and 460 nm (emission) filters. DNA quantification was measured with stan-dard solutions of Salmon sperm DNA. Results were expressed as µg DNA/mg of proteins.
Glutathione S-transferase
Glutathione S-transferase activity was measured using 1-chloro-2-4-dinitrobenzene (CDNB) as the co-substrat. A volume of 50 µL of S15 was mixed with 1 mM GSH and 1 mM CDNB substrate in 50 mM Hepes-NaOH, pH 7.4, containing 100 mM NaCl. The mixture was incubated at 15°C for 0, 5, 15, 25 and 45 min. Activity was expressed by the increase in absorbance at 340 nm per min per milligram of protein.
Statistical analyses
The data were expressed as the mean with the standard error. In each experience, differ-ences between control and groups of fish exposed to Mercier groundwater were
evaluat-ed by one-way analysis of variance (ANOVA) followed by post-hoc test (P≤0.05). The calcula-tions were performed using Statistica for Windows (Version 7.0, StatSoft Inc., 1995). Correlation was performed using Pearson test. Discriminant function analysis was performed to determine the well distance characteristics. Significance was set at P 0.05.
Results
Chemical analysis
Among the 61 volatile organic compounds measured, vinyl chloride (4 µg/L), trans-1,2-dichloroethylene (2 µg/L), 1,1-dichlorethane (0.4 µg/L), 1,2-dichloroethane (2 µg/L), cis-1,2-dichloroethene (0.37 µg/L) and benzene (0.29 µg/L) were found at concentrations above the detection limit at 2.7 km (Table 2).
Morphological parameters
Neither trout weights, lengths nor CF and HSI showed any significant differences in sampling sites after 4 and 14 days of exposure time (Table 3). However, significant correla-tions were found between weights and CF (r= 0.91, P 0.05), between lengths and CF (r= 0.96, P 0.05) in groups at 5.4 km.
Biomarker responses
Phase I and II biotransformation activities
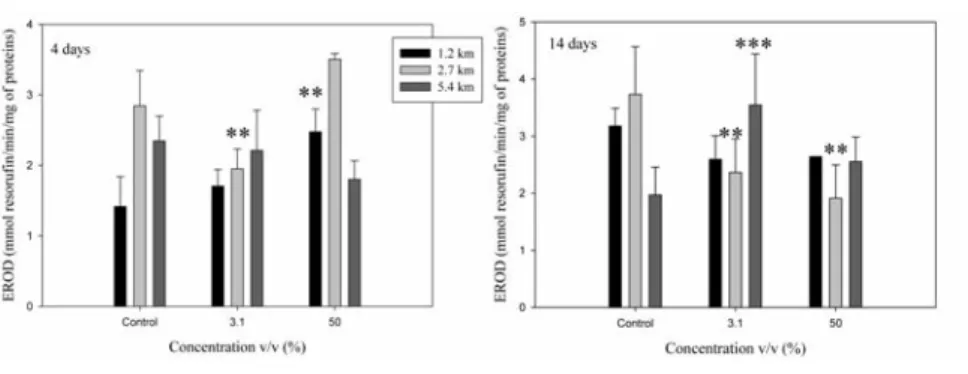
EROD activity was significantly increased in fish exposed to groundwater at 1.2 km (50%)and 5.4 km (3.1%) following 4 and 14 days exposure respectively reaching 1.8-fold induc-tions. However, a significant inhibition in EROD activity was observed in fish exposed to groundwater at 2.7 km for all times of exposure at (3.1%) and (50%) concentrations (Figure 2). GST activity in the liver of fish exposed at 3.1% groundwater concentration from the site located at 2.7 km raised significantly after 4 days, reaching 2.1-fold relative to control (Figure 3). However, at (50%) groundwater concentration, GST activity returned to 1.3-fold with respect to control suggesting saturation. Indeed, measurement of GST activities follow-ing 14 days exposure to groundwater at (3.1%) and (50%) revealed no significant effects although the mean activity reached 1.2 and 1.6-fold respectively compared to control. The samples collected from groundwater at 1.2 km and 5.4 km did not trigger the increase in GST activity compared to control.
Biomarkers of tissue damage
Lipid peroxidation expressed by TBARS levels in liver of trout were no significantly different compared to control trout (Figure 4). This result was observed for all concentrations tested. Positive correlation was obtained between LPO and GST (r=0.88, P 0.05) in group at 5.4 km (Table 4). Exposure of trout to groundwater at 1.2 km caused a significant elevation of DNA strand breaks reaching 1.2-fold after 4 days exposure at (50%) concentration and (2-fold) after 14 days exposure at (3.1%) water concentration (Figure 5). At 5.4 km distance from the lagoons, a much
Figure 1. Map with sampling points around Mercier city in campaign may 2010. The wells exposure 7201, 94-6R and 7083 are located at distances (1.2, 2.7 and 5.4 km) from the lagoons. (Modified Map provided by the Ministry of Sustainable Development, Environment and parks of Quebec, 2009).
Non-commercial
stronger induction (reaching 3.5 fold induction at 50%) compared to control was observed after 14 days. However, DNA Strand breaks were somewhat lower (1.0 and 1.3 fold) in liver of fish exposed to 3.1% and 50% groundwater respec-tively at 2.7 km for 4 days. A slight raise was observed after 14 days exposure (1.57 and 2.02 fold) compared to control. In addition, significant correlation was found in groups at 2.7 km between DNA strand breaks and LPO levels (r=0.99), P 0.05) (Table 3). However, negative correlation was between DNA strand breaks and EROD activity (r= 0.91), P 0.05) (Table 4).
Discriminant function analysis
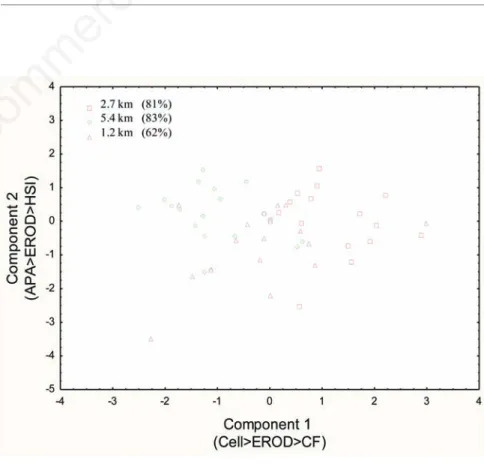
In the aim to describe the biochemical effects of chronic exposure (14 days) to contaminated groundwater on the liver of rainbow trout, dis-criminant function analyses were performed (Figure 6). The main biomarkers were identi-fied on X and Y-axis. Discrimination function analysis of the biochemical responses revealed that all three wells at 2.7 km, 5.4 km and 1.2 km and the controls were correctly classified: 81%, 83%, 62% and 100% correctness respectively. EROD was the main biomarker that discrimi-nated the sites.
Discussion
The aim of this study was to investigate the biochemical effects of exposure to
groundwa-Table 4. Biomarkers correlation in rainbow trout exposed for 4 and 14 days to Mercier groundwater at 1.2, 2.7 and 5.4 km.
DNA damage GST activity Lipid peroxidation EROD activity
DNA damage - - 0.99* (2.7/4d)
-Lipid peroxidation - 0.88* (5.4/14d) -
-EROD activity –0.91* (2.7/14d) - -
-GST, gluthatione S-transferase; EROD, ethoxyresorufin O-deethylase. *Only significant correlations are shown (P 0.05).
Figure 2. Ethoxyresorufin O-deethylase (EROD) activity in trout liver after 4 and 14 days exposure to groundwater at 1.2 km, 2.7 km and 5.4 km. Data are presented as mean±standard error. Asterisks indicate significant difference from controls (**P<0.01; ***P<0.001).
Figure 3. Gluthatione S-transferase activity in trout liver after 4 and 14 days exposure to groundwater at 1.2 km, 2.7 km and 5.4 km. Data are presented as mean±standard error. Asterisks indicate significant difference from controls (*P<0.01).
Table 3. Morphometric data of trout exposed to groundwater at 1.2 km, 2.7 km and 5.4 km.
Well Measures 4 days of exposure 14 days of exposure
Control 3.1% 50% Control 3.1% 50%
1.2 km Weight (g) 27±8 32±9 30±4 31±8 33±4 31±6
Length (cm) 13±2 14±2 14±1 13±1 14±1 13±1
Factor condition (FC) 1.3±0.2 1.0±0.1 1.1±0.1 1.4±0.2 1.3±0.1 1.5±0.2
Hepatosomatic index (HIS) 1.1±0.3 1.2±0.8 0.8±0.3 1.2±0.6 1.2±0.4 1.1±0.3
2.7 km Weight (g) 31±6 33±9 35±7 32±9 31±6 33±8
Length (cm) 13±1 13±1 13±1 14±1 13±1 13±1
Factor condition (FC) 1.3±0.1 1.3±0.2 1.4±0.2 1.4±0.1 1.4±0.0 1.4±0.1
Hepatosomatic index (HIS) 1.0±0.3 1.1±0.6 1.2±0.4 1.1±0.6 1.0±0.3 1.3±0.6
5.4 km Weight (g) 33±9 36±4 34±9 38±7 33±3 34±6
Length (cm) 15±1 16±1 15±1 14±1 14±0 14±1
condition (FC) 1.1±0.1 1.0±0.1 1.0±0.1 1.1±0.1 1.3±0.1 1.4±0.0
Hepatosomatic index (HIS) 1.1±0.7 1.1±0.2 1.2±0.3 1.1±0.3 1.0±0.2 1.1±0.3
Values reported as mean±standard error.
Non-commercial
ter at increasing distance from an industrial dumping site (Mercier lagoons) in rainbow trout and determine the behavior of the con-tamination plume in groundwater.
The concentrations of volatile organic com-pounds (e.g., benzene, dichloroethane and vinyl chloride) measured in samples at 2.74 km were 0.29 µgL-1, 2 µgL-1and 4 µgL-1
respective-ly, which indicates that the plume is more con-centrated at this distance (Table 2) . The pres-ence of VOCs in the groundwater could lead to serious health threats. The chronic exposure of organisms to low levels of VOCs can caused carcinogenesis,38 i.e. vinyl chloride and
ben-zene are widely recognized human carcino-gens.39,8 However, DNA damage was more
important at the closest and farthest sampling distance (i.e. 1.2 and 5.4 km). Hence, the com-plexity of the fate and transport of chemical mixtures in groundwater makes it difficult to suggest causative chemicals responsible for the observed effects.
The CF and HSI of the trout were homoge-neous in all exposure groups which removes size-related influences in the biomarker responses. It also suggests that the observed response were not immediately threatening at the fish morphological level. Fish from polluted environments generally show an increase in the HSI, exposition to PAHs or others sub-stances which involved biotransformation leads normally to an elevation of this index.40
However, no significant increase in HSI was observed after 14 days of exposure time. May be the exposure period was not long enough to see HIS variations.
The data obtained in this study would sug-gest the presence of chemicals able to activate the Ah receptor. Indeed, EROD activity of groundwater exposure, were significantly enhanced over fish from the control at 1.2 km (50%) and 5.4 km (3.1%), but was reduced at 2.7 km for all times of exposure at (3.1%) and (50%) concentrations. The reduction of EROD activity in fish at site 2.7 km could be due to hepatotoxic damage which may inhibit the liver cells production of this enzyme or we hypothesized the presence of the blocker (antagonist) for AhR which reduce the enzyme activity mediated normally by AhR in trout. Whyte et al.41suggested that toxicity caused by
xenobiotics accumulation and their metabo-lites might inhibit enzyme production leading to an inhibition of EROD activity. Biotransfor -mation of vinyl chloride, dichloroethane and benzene, the chemicals identified in ground-water samples at 2.7 km, are under cytochrome P450 2E1,42as well as through glutathione
con-jugation.43,44Trans and cis 1,2-dichlorethylene
inhibit their own metabolism in vivo by inacti-vation of the metabolizing enzyme presumably the CYP 450 isoform CYP 2E1.16The induction
of GST activity as for CYP450 is regulated, in part by the Ah receptor.25Indeed, an increase
Figure 6. Results for discriminant function analyses for 14 days exposure to Mercier groundwater at 1.2 km, 2.7 km and 5.4 km. CF, condition factor; HIS, hepatosomatic index; Cell, cellularity; ethoxyresorufin-O-deethylase, APA and EROD activity.
Figure 4. Lipid peroxidation in trout liver after 4 and 14 days exposure to groundwater at 1.2 km, 2.7 km and 5.4 km. Data are presented as mean±standard error. No signifi-cant difference was observed (ANOVA P>0.05).
Figure 5. DNA strand break in trout liver after 4 and 14 days exposure to groundwater at 1.2 km, 2.7 km and 5.4 km. Data are presented as mean±standard error. Asterisks indi-cate significant difference from controls (**P<0.01; ***P<0.001
Non-commercial
in hepatic GST activity has been reported in several studies after fish exposure to PAHs, PCBs and certain VOCs.17,45,46 Various
sub-strates involved in GST activity are recognized by the binding site of hydrophobic substrates.27
Nevertheless, the enzyme GST has been reported to respond differently to different sub-stances. For example, Otitoloju et al.18reported
that enzyme was inhibited by benzene, while Qian et al.47reported increased GST activity in
liver of Crucian carp (Carassius auratus) injected with chlorobenzene. In our study, a significant increased displayed in the phase II biotransformation in trout exposed to 3.1% groundwater at 2.7 km after 4 days exposure. The GST response to groundwater after 4 days exposure in all groups shows a bell-shaped trend with an initial increase in activity, but significantly only at 2.7 km. Accordingly, the low enzyme activities after 14 days in fish from 1.2 km, 2.7 km and 5.4 km could be associated with deficiency to compensate for oxidative stress, possibly due to high levels of pollutant exposure.48 Since LPO was not significantly
affected and was not related to GST activity, we cannot support the argument that decreased GST activity was associated to oxidative stress. Oxidative stress can be mediated by numer-ous organic contaminants, including, halo-genated hydrocarbons, PAHs, and dioxins.18In
the current study, LPO levels in trout exposed to groundwater at all distance increased slight-ly even if non-significantslight-ly. Although LPO was positively correlated to GST, the change in GST activity seemingly did not influence LPO under analysis of covariance.
DNA damage was measured by the levels of soluble strand breaks and can be used as tools to monitor genotoxicity in organisms.49At 4
days exposure, an initial increase in DNA strand breaks was observed in trout exposed to 50% groundwater at 1.2 km. Although, after 14 days of exposure to groundwater at 5.4 km, the amount of DNA were more elevated (reaching 3.4-fold) with respect to control. In fact, Devaux et al.50 observed that the chub
(Lenciscus cephalus) caught in Rhone River close to an industrial area presented DNA dam-age in erythrocytes. Genotoxic effect seems to be reflected by metabolites effects of chemicals on DNA, including their capabilities to lead to DNA strand. According to Gwinn et al.9which
reported that EDC, with its strong electrophilic affinity to DNA appears to induce DNA dam-age. Vinyl chloride oxidation produces an epoxide intermediate which reacts with a vari-ety of cellular nucleophiles including DNA and glutathione (GSH).16 Mattes et al.8 reported
likewise that DNA damage of vinyl chloride is due to the formation of the extremely reactive epoxide chlorooxirane during the oxidative metabolism of VC by CYP 450 in the liver. Unfortunately, we did not measure CYP2E1 activity in this study. However, DNA damage is
not correlated with EROD (r= 0.91, P 0.05), this suggests that VOCs are associated with genotoxicity.
Conclusions
The data revealed that exposure to contami-nated groundwater stimulated both phases I and II biotransformation activities as evi-denced by EROD and GST activities. The water samples were also genotoxic which was seem-ingly not related to oxidative stress given the lack of LPO changes. This study provides some insights on the toxicity of groundwater con-taminated by industrial waste to rainbow trout.
References
1. Bureau d’Audiences Publiques sur l’Environnement du Québec (BAPE). Restauration du lieu contaminé de Mercier. Montréal: Bureau d’Audiences Publiques sur l’Environnement du Québec (BAPE); 1994. p 222.
2. Poulin M, Simard G, Sylvestre M. Pollution des eaux souterraines par les composés organiques à Mercier, Québec. [Ground -water pollution by organic compounds at Mercier, Quebec]. Hydrogéologie. 1985;2: 125-31. [Article in French]
3. Centre d’expertise en analyse environ-nementale (CAEQ). Certificat d’analyse: Eaux souterraines de la région de Mercier. Projet 5534. Montréal: Centre d’expertise en analyse environnementale (CAEQ); 2010.
4. Prime J, Fournier M. Création d’un réseau de recherche interuniversitaire et multi-disciplinaire sur les problématiques envi-ronnementales associées au site des lagunes de Mercier: Rapport préparé par le Centre interinstitutionnel de recherche en écotoxicologie (CIRÉ); 2008. p 224. 5. Pohl HR, Scinicariello F. The impact of
CYP2E1 genetic variability on risk assess-ment of VOC mixtures. Regulat Toxicol Pharmacol 2011;59:364-74.
6. Poirier M, Fournier M, Brousseau P, Morin A. Effects of volatile aromatics, aldehydes, and phenols in tobacco smoke on viability and proliferation of mouse lymphocytes. J Toxicol Environ Health - Part A 2002; 65:1437-51.
7. Zabrodskii PF, Mandych VG, Germanchuk VG. Inhibition of cytochrome P-450 with 2- diethylaminoethyl-2,2-diphenylpropylac-etate (SKF-525A) reduces immunotoxicity of chlorinated carbohydrates. Bull Exper Biol Med 2006;142:324-6.
8. Mattes TE, Alexander AK, Coleman NV.
Aerobic biodegradation of the chloro -ethenes: pathways, enzymes, ecology, and evolution. FEMS Microbiol Rev 2010;34: 445-75.
9. Gwinn MR, Johns DO, Bateson TF, Guyton KZ. A review of the genotoxicity of 1,2-dichloroethane (EDC). Mutat Res Rev Mutat Res 2011;727:42-53.
10. Kumar A, Sushama A, Rohil V, Manral S, Gangopadhyay S, Prasad A, et al. Preven -tion of benzene-induced genotoxicity in bone marrow and lung cells: superiority of polyphenolic acetates to polyphenols. Archiv Toxicol 2011;85:1141-50.
11. Morozzi G, De Bartolomeo A, Fabiani R, Rosignoli P, Lepore L. Induction of DNA-damage and apoptosis by volatile organic compounds and by benzene metabolites. Igiene Moderna 1999;112:1503-13. 12. Gros M, Petrovic M, Barcelo D. Wastewater
treatment plants as a pathway for aquatic contamination by pharmaceuticals in the ebro river basin (northeast Spain). Environ Toxicol Chem 2007;26:1553-62. 13. Singh MP, Mishra M, Sharma A, Shukla
AK, Mudiam MKR, Patel DK, et al. Genotoxicity and apoptosis in Drosophila melanogaster exposed to benzene, toluene and xylene: attenuation by quercetin and curcumin. Toxicol Appl Pharmacol 2011; 253:14-30.
14. Couillard CM, Lee K, Légaré B, King TL. Effect of dispersant on the composition of the water-accommodated fraction of crude oil and its toxicity to larval marine fish. Environ Toxicol Chem 2005;24:1496-504. 15. Palanikumar L, Kumaraguru AK,
Ramakritinan CM, Anand M. Biochemical response of anthracene and benzo [a] pyrene in milkfish Chanos chanos. Ecotoxicol Environ Safety 2012;75:187-97. 16. Lilly PD, Thornton-Manning JR, Gargas
ML, Clewell HJ, Andersen ME, Manning JRT. Kinetic characterization of CYP2E1 inhibition in vivo and in vitro by the chloroethylenes. Archiv Toxicol 1998;72: 609-21.
17. Oliva M, Gonzalez de Canales ML, Gravato C, Guilhermino L, Perales JA. Biochemical effects and polycyclic aromatic hydrocar-bons (PAHs) in senegal sole (Solea sene-galensis) from a Huelva estuary (SW Spain). Ecotoxicol Environ Safety 2010;73:1842-51.
18. Otitoloju A, Olagoke O. Lipid peroxidation and antioxidant defense enzymes in Clarias gariepinus as useful biomarkers for monitoring exposure to polycyclic aro-matic hydrocarbons. Environ Monit Assess 2011;182:205-13.
19. Martinez-Gomez C, Vethaak AD, Hylland K, Burgeot T, Kohler A, Lyons BP, et al. A guide to toxicity assessment and monitor-ing effects at lower levels of biological
Non-commercial
organization following marine oil spills in European waters. ICES J Marine Sci 2010;67:1105-18.
20. Eseigbe F, Doherty V, Sogbanmu T, Otitoloju A. Histopathology alterations and lipid peroxidation as biomarkers of hydro-carbon-induced stress in earthworm, Eudrilus eugeniae. Environ Monit Assess 2013;185:2189-96.
21. Hanson N, Larsson Ã. Experiences from a biomarker study on farmed rainbow trout (Oncorhynchus mykiss) used for environ-mental monitoring in a Swedish river. Environ Toxicol Chem 2009;28:1536-45. 22. Whyte JJ, Jung RE, Schmitt CJ, Tillitt DE.
Ethoxyresorufin-O-deethylase (EROD) activity in fish as a biomarker of chemical exposure. Crit Rev Toxicol 2000;30:347-570.
23. Bols NC, Brubacher JL, Ganassin RC, Lee LEJ. Ecotoxicology and innate immunity in fish. Develop Comparat Immunol 2001; 25:853-73.
24. Van der Oost R, Beyer J, Vermeulen NPE. Fish bioaccumulation and biomarkers in environmental risk assessment: a review. Environ Toxicol Pharmacol2003;13:57-149. 25. Gonzalez JF, Reimschuessel R, Shaikh B, Kane AS. Kinetics of hepatic phase I and II biotransformation reactions in eight fin-fish species. Marine Environ Res 2009;67:183-8.
26. Cazenave J, Bistoni MDLA, Pesce SF, Wunderlin DA. Differential detoxification and antioxidant response in diverse organs of Corydoras paleatus experimen-tally exposed to microcystin-RR. Aquatic Toxicol 2006;76:1-12.
27. Monferran MV, Galanti LN, Bonansea RI, Amé MV, Wunderlin DA. Integrated survey of water pollution in the SuquÃa River basin (Cordoba, Argentina). J Environ Monit 2011;13:398-409.
28. Zhang JF, Liu H, Sun YY, Wang XR, Wu JC, Xue YQ. Responses of the antioxidant defenses of the Goldfish Carassius aura-tus, exposed to 2,4-dichlorophenol. Environ Toxicol Pharmacol 2005;19:185-90.
29. Li ZH, Zlabek V, Velisek J, Grabic R, Machova J, Kolarova J, et al. Acute toxicity of carbamazepine to juvenile rainbow trout (Oncorhynchus mykiss): Effects on antioxidant responses, hematological parameters and hepatic EROD. Ecotoxicol Environ Safety 2011;74:319-27.
30. Nigro M, Frenzilli G, Scarcelli V, Gorbi S,
Regoli F. Induction of DNA strand breakage and apoptosis in the eel Anguilla anguilla. Marine Environ Res 2002;54:517-20. 31. Sasaki YF, Saga A, Akasaka M, Ishibashi S,
Yoshida K, Su YQ, et al. Detection of in vivo genotoxicity of haloalkanes and haloalkenes carcinogenic to rodents by the alkaline single cell gel electrophoresis (comet) assay in multiple mouse organs. Mutat Res.1998;419:13-20.
32. Benchalgo N, Gagné F, Fournier M. Immunotoxic effects of an industrial waste incineration site on groundwater in rain-bow trout (oncorhynchus mykiss). J Environ Sci 2014. [In press].
33. US Environmental Protection Agency. 2006 Edition of the drinking water standards and health advisories (EPA 822-R-06-013). Washington, DC: Office of Water, US Environmental Protection Agency; 2006. Available from: http://water.epa.gov/action/ advisories/drinking/upload/2009_04_27_c riteria_drinking_dwstandards.pdf 34. WHO. Guidelines for drinking-water
quality recommendations. Vol. 1: Recom -mendations. 3rd ed. Geneva: World Health Organization; 2006. Available from: http://www.who.int/water_sanitation_heal th/dwq/gdwq3rev/en/
35. Bradford MM. A rapid and sensitive method for the quantitation of microgram quantities of protein utilizing the principle of protein dye binding. Analyt Biochem 1976;72:248-54.
36. Gagne F, Blaise C. Hepatic metallothionein level and mixed function oxidase activity in fingerling rainbow trout (Oncorhyn -chus mykiss) after acute exposure to pulp and paper mill effluents. Water Res 1993;27:1669-82.
37. Gagné F, Trottier S, Blaise C, Sproull J, Ernst B. Genotoxicity of sediment extracts obtained in the vicinity of a creosote-treat-ed wharf to rainbow trout hepatocytes. Toxicol Lett 1995;78:175-82.
38. Roose P, Brinkman UAT. Volatile organic compounds in various marine organisms from the Southern North Sea. Marine Pollut Bull 2000;40:1167-77.
39. Hiraku Y, Karwanishi S. Oxidative DNA damage and apoptosis induced by benzene metabolites. Cancer Res 1996;56:5172-8. 40. Kopecka-Pilarczyk J, Correia AD.
Biochemical response in gilthead seabream (Sparus aurata) to in vivo expo-sure to pyrene and fluorene. J Exper Marine Biol Ecol 2009;372:49-57.
41. Whyte JJ, Jung RE, Schmitt CJ, Tillitt DE. Ethoxyresorufin-O-deethylase (EROD) activity in fish as a biomarker of chemical exposure. Crit Rev Toxicol 2000;30:347-570.
42. Huang C-Y, Huang K-L, Cheng T-J, Wang J-D, Hsieh L-L. The GST T1 and CYP2E1 genotypes are possible factors causing vinyl chloride induced abnormal liver func-tion. Archiv Toxicol 1997;71:482-8. 43. Nakajima T, Wang RS, Elovaara E, Park SS,
Gelboin HV, Hietanen E, et al. Monoclonal antibody-directed characterization of cytochrome P450 isozymes responsible for toluene metabolism in rat liver. Biochem Pharmacol 1991;41:395-404.
44. Filser JG, Bolt HM. Pharmacokinetics of halogenated ethylenes in rats. Archiv Toxicol 1978;42:123-36.
45. Maria VL, Correia AC, Santos MA. Genotoxic and biochemical responses in caged eel (Anguilla anguilla L.) after short-term exposure to harbour waters. Environ Int 2004;29:923-9.
46. Yang F, Zhang Q, Guo H, Zhang S. Evaluation of cytotoxicity, genotoxicity and teratogenicity of marine sediments from Qingdao coastal areas using in vitro fish cell assay, comet assay and zebrafish embryo test. Toxicol Vitro 2010;24:2003-11. 47. Qian Y, Yin D, Li Y, Wang J, Zhang M, Hu S. Effects of four chlorobenzenes on serum sex steroids and hepatic microsome enzyme activities in crucian carp, Carassius auratus. Chemosphere 2004;57: 127-33.
48. Correia AD, Gongalves R, Scholze M, Ferreira M, Henriques MA-R. Biochemical and behavioral responses in gilthead seabream (Sparus aurata) to phenan-threne. J Exper Marine Biol Ecol 2007;347: 109-22.
49. Costa PM, Neuparth TS, Caeiro S, Lobo J, Martins M, Ferreira AM, et al. Assessment of the genotoxic potential of contaminated estuarine sediments in fish peripheral blood: Laboratory versus in situ studies. Environ Res 2011;111:25-36.
50. Devaux A, Flammarion P, Bernardon V, Garric J, Monod G. Monitoring of the chemical pollution of the river Rhone through measurement of DNA damage and cytochrome P4501A induction in Chub (Leuciscus cephalus). Marine Environ Res 1998;46:257-62.