To link to this article : DOI:
10.1016/j.jcrysgro.2014.10.009
URL :
http://dx.doi.org/10.1016/j.jcrysgro.2014.10.009
This is an author-deposited version published in:
http://oatao.univ-toulouse.fr/
Eprints ID: 15916
O
pen
A
rchive
T
oulouse
A
rchive
O
uverte (
OATAO
)
OATAO is an open access repository that collects the work of Toulouse
researchers and makes it freely available over the web where possible.
To cite this version: Kaddeche, Slim and Garandet, Jean-Paul and Henry,
Daniel and Ben Hadid, Hamda and Mojtabi, Abdelkader On the effect of
natural convection on solute segregation in the horizontal Bridgman
configuration: Convergence of a theoretical model with numerical and
experimental data. (2015) Journal of Crystal Growth, vol. 409. pp. 89-94.
ISSN 0022-0248
Any correspondence concerning this service should be sent to the repository administrator:
[email protected]
On the effect of natural convection on solute segregation
in the horizontal Bridgman configuration: Convergence
of a theoretical model with numerical and experimental data
S. Kaddeche
a,n, J.P. Garandet
b, D. Henry
c, H. Ben Hadid
c, A. Mojtabi
daUniversity of Carthage, Institut National des Sciences Appliquées et de Technologie (INSAT), Laboratoire de Recherche Matériaux, Mesures et Applications,
B.P. 676, 1080 Tunis Cedex, Tunisia
bCEA, LITEN, Department of Solar Technologies, National Institute of Solar Energy, F-73375 Le Bourget du Lac, France
cLaboratoire de Mécanique des Fluides et d’Acoustique, CNRS/Université de Lyon, École Centrale de Lyon/Université Lyon 1/INSA de Lyon, ECL,
36 Avenue Guy de Collongue, 69134 Ecully Cedex, France
dInstitut de Mécanique des Fluides de Toulouse, UMR CNRS/INP/UPS 5502, UFR MIG, Université Paul Sabatier, 118 Route de Narbonne,
31062 Toulouse Cedex, France
Keywords: A1. Convection
A1. Directional solidification A1. Segregation
A2. Growth from melt
a b s t r a c t
The effect of natural convection on solute segregation in the horizontal Bridgman configuration is studied. The objective is to check whether a single non-dimensional number, based on the fluid flow induced interface shear stress, is able to capture the physics of the mass transport phenomena. A number of heat and mass transfer numerical simulations are carried out in the laminar convection regime, and the segregation results are found to be in good agreement with the predictions of the scaling analysis. At the higher convective levels relevant for the comparison with existing experimental data, a direct computation of the segregation phenomena is not possible, but numerical simulations accounting for turbulence modeling can provide the interface shear stress. With this procedure, a good agreement between the experimentally measured segregation and the predictions of the scaling analysis is again observed, thus validating the choice of the interface shear stress as a key parameter for the segregation studies.
1. Introduction
In melt growth technologies, solute or impurity segregation often represents an important issue, e.g. for the control of solidification in concentrated semiconductor alloys [1] or for the purification of upgraded metallurgical grade Si feedstock in photovoltaic applica-tions[2]. For such an issue, the role of both Fickian diffusion and convection has been widely recognized in the past, but a global understanding is still missing. As a matter of fact, the global heat, momentum and mass transport problem features a variety of length scales, particularly due to the existence of thin solute boundary layers in the vicinity of the solidification interface which often prevents an accurate global numerical modeling of the growth configuration. Therefore models allowing to somehow decouple species transport from the heat and momentum transport problems can be very useful. In such a perspective, order of magnitude analyses can provide interesting insights, particularly if the objective is primarily
to determine whether impurity transport is mainly driven by convection or by diffusion. As a matter of fact, it must be understood that such approaches cannot be expected to be quantitatively accurate, but they can provide scaling laws and as such useful insights in the physics of the transport phenomena.
Attempts in this direction are not new, starting from the pioneering work of Burton et al.[3], later on referred to as BPS, in their model Czochralski configuration. In this pioneering work, BPS managed to relate the characteristics of the forced convection flow to the effective partition coefficient thanks to a newly introduced convecto-diffusive parameter. This pioneering work was later on refined by Wilson[4], who proposed a scientifically sound defini-tion for the solute boundary layer thickness and the convecto-diffusive parameter. In addition to Czochralski growth, this approach proved very useful for the interpretation of the numerical simulation results of Kaddeche et al.[5]in the horizontal Bridgman configuration.
On a related line of thought, Ostrogorsky and Müller [6]
proposed a model based on a mass balance and the related solute fluxes across the growth interface to yield the effective partition coefficient and the boundary layer thickness. In a couple of recent papers, Ostrogorsky[7]relied on correlations for the convective
n
Corresponding author.
E-mail addresses:[email protected],
mass transport coefficient in various fluid flow configurations to derive estimates of the partition coefficient. A common feature of all the above literature is that knowledge of some external features of the involved fluid flow is necessary as an input in the mass transport problem. As a consequence the results are presented as a function of various non-dimensional groups that a priori charac-terize the convection problem.
Such is not the case in the recent work by Garandet et al.[8]
where the authors proceed to define the local velocity field based on the interface shear stress induced by the motion of the fluid. As such, the physical nature of the convective driving forces does not explicitly appear in the theoretical frame, which can, as a con-sequence, be considered universal in nature. It should of course be stated that the interface shear stress may not be fully familiar to the experimenter, but in the frame of an approach where numer-ical simulations are carried out for heat transfer and fluid flow, it is readily available as a result of the computations.
In any case, comparisons with numerical results obtained in the lid driven cavity configuration support the validity of the theory[8]
and the ability of the scaling analysis to capture the physics of the segregation phenomena. However, in part due to the fact that lid driven convection is rarely encountered in crystal growth devices, the necessity of further tests for this model had been mentioned[8]. In this respect, the horizontal Bridgman configuration presents a number of advantages, due to a well-defined convective driving source, and more important to the existence of a relatively large and reliable numerical[5]and experimental[9–10]data base.
InSection 2, we will first briefly outline the theoretical model along with the procedures involved in the determination of the numerical and experimental data base that will be used for the comparisons. We will then proceed in Section 3 to the presentation of the results, along with a discussion of the validity of the model.
2. Background and procedures 2.1. Model formulation
Our purpose here is only to briefly recall the outline of the procedure. For more details the interested reader is referred to Ref.[8]. Our starting point is the convecto-diffusive mass balance equation, which governs the concentration C of an impurity or a dopant (expressed here as mass fraction) in a frame moving with the solid–liquid interface at a rate VIalong the Z-direction
∂C=∂t þðV:∇Þ C ¼ D∇2C þVI∂C=∂Z; ð1Þ V and D respectively standing for the convective velocity, solution of the Navier–Stokes equations, and the impurity or dopant diffusion coefficient. Closed form analytical solutions to Eq. (1)
exist only in rare cases, such as diffusion controlled growth (V¼ 0), thus requiring the recourse to numerical simulations or simple order of magnitude analyses, as carried out in[8]. The model is based on approximate expressions in a two-dimensional repre-sentation for the components of the convective flow parallel and normal to the interface, denoted respectively as U (along the vertical coordinate X) and W (along the horizontal coordinate Z). More specifically, it is supposed that away from the cavity lateral walls, U and W can be written as follows:
U Zð Þ % ðτ=ηÞ Z; W Zð Þ % ðτ=ηHÞ Z2; ð2Þ where τ represents the interface shear stress, generally defined as τ¼ η ∂v! t=∂xn"Iwhere vtis the tangential velocity, xnis the normal
direction and the subscript I indicates an evaluation at the inter-face (here, with our notations, τ ¼ η ∂U=∂Z! "
I), η is the dynamic
viscosity of the fluid, H is a characteristic macroscopic dimension
of the solid–liquid front and Z is the distance from the point of interest to the interface. At this point, it should be mentioned that the concept of ‘interface shear stress’ may appear questionable since, from a physical standpoint, the key physical parameter defining the flow field is rather the gradient of the tangential velocity in the direction normal to the interface. Nevertheless, in Newtonian fluids (as those considered in the present work), this quantity is linearly related to the interface shear stress and can be written as τ=η as expressed in Eq.(2).
In addition, the concept of interface shear stress is commonly used in the turbulence literature in the context of wall bounded shear flows, resulting in the fact that as mentioned earlier, the values of the interface shear stress are readily available as a result of the numerical simulations in turbulent flow conditions in standard commercial codes. Finally, from an experimental stand-point, it should also be stated that a number of techniques have been developed for the measurement of wall shear stresses[11]. In view of all these arguments, reference will be made to interface shear stress all through the paper, even though it should be remembered that a presentation of the results in terms of normal velocity gradients would also be possible.
In any case, as discussed in [8], it is expected that the expressions given by Eq. (2) will be adequate in both laminar and turbulent convective configurations if in the latter case, U and W are meant to represent the components of the Reynolds averaged velocity field. The scaling analysis then allows deriving the value of the convecto-diffusive parameter Δ (namely the dimensional solute boundary layer thickness δ normalized by D/VI) as a function of a ‘universal’ nondimensional group given as
B ¼ τD2=V
I3ηH: ð3Þ
The analytic expression obtained is given in Ref. [8]. For the sake of completeness, it should be recalled that the convecto-diffusive parameter Δ is of paramount importance in segregation problems, since it can be univocally related to the thermodynamic and effective partition coefficients k and keff according to the
formula keff¼ k/(1 & (1 & k)Δ)[4].
2.2. Numerical procedures
Our objective in this section is again only to outline the numerical procedures used in the present work. We actually relied on two distinct codes, a two dimensional in-house program for a detailed comparison with the predictions of the scaling analysis in laminar fluid flow configurations, and the commercial software Fluent, which was used for the derivation of the interface shear stress in turbulent conditions in order to test the scaling analysis against the experimental data.
Regarding the in-house code[5], the governing equations were solved in a vorticity–stream function formulation using an alternat-ing direction implicit (ADI) technique, with a finite-difference method involving forward differences for time derivatives and Hermitian relationships for spatial derivatives, resulting in a trunca-tion error in O(Δt2
, ΔX4
, ΔZ4), i.e. of second and fourth orders in time
and space, respectively (see Hirsh[12]and Roux et al.[13]). The mesh used to solve the problem was generated by a technique initially proposed by Thompson[14]. The node density is of course larger near the side walls of the cavity, especially in the vicinity of the growth interface. As shown in [5], a 25 ' 101 grid guarantees a sufficient accuracy for such studies. Regarding physical assumptions, only the thermal convection in the Boussinesq approximation was considered, which amounts to assuming that the alloy is sufficiently dilute for solutal buoyancy to be negligible.
A schematic of the problem is shown inFig. 1. In dimensional form, the parameters of the problem are the cavity width H, length L,
the imposed temperature difference ΔT and the gravity acceleration g. In addition, the fluid characteristics, namely its dynamic η and kinematic ν viscosities, as well as its thermal expansion coefficient β and thermal conductivity κ, have to be considered. In a cavity with fixed walls, two non-dimensional parameters, namely the Grashof number, Gr¼β(ΔT/L)gH4/ν2, and the Prandtl number, Pr¼ν/κ, would
be sufficient to fully characterize the fluid flow. However, care is needed to account for the motion of the solid–liquid interface, which introduces the interface velocity VIas a boundary condition in the
hydrodynamic problem. To model the segregation during directional solidification, the species diffusion and partition coefficients, respec-tively denoted as D and k, have to be considered. Thus, to fully specify the segregation problem, two other non-dimensional para-meters, e.g. the Schmidt number, Sc¼ν/D, and the interface velocity based Peclet number, Pe¼HVI/D, have to be introduced.
Simulations were carried out in non-dimensional form, the respective ranges of variations being 0.01–5000 for Gr, 1–10 for Sc and 0.2–2 for Pe (Pe/Sc¼0.2). The Prandtl number was kept at a fixed value, namely Pr¼0.015, representative of liquid metals such as the tin based alloys used in the experimental program. As for the partition coefficient, by nature non-dimensional, it was checked that its value did not affect the results in terms of effective partition coefficients and convecto-diffusive parameters. Most simulations were carried out using k¼0.087, a value representative of Ga segregation in Ge. Since in the present in-house code solidification is actually modeled by the motion of the growth interface, the initial and final conditions have to be specified. As done previously[5], a cavity of initial length over width L/H ratio of 4 was modeled, with the solidification proceeding to half the cavity length in order to provide sufficient data for the extraction of the effective partition coefficients and convecto-diffusive parameters.
It is quite obvious that except may be for the idealized Czochralski problem studied by BPS[3], the segregation problem in actual crystal growth configurations is never fully one-dimensional. Nevertheless, if the focus is not on radial or lateral homogeneity, a 1D approach is often sufficient to gain useful information on the species transport mechanisms that govern the longitudinal macrosegregation. To allow the comparison between scaling analysis and numerical results, our approach was to take an average of the composition field at the interface, Csav, as a function
of the position along the ingot, and to fit the obtained data according to the model of Favier[15]in order to extract the value of the effective partition coefficient for the corresponding simula-tion condisimula-tions. A typical example of such a procedure is shown in
Fig. 2, where it is seen that the numerical data can be adequately fitted using Favier's procedure, thus supporting the validity of the 1D approach and the possibility to extract a meaningful value for Δ. The in-house code was unfortunately found to be inadequate to directly model segregation in the conditions relevant to the experiments to be presented in the next section, specially due to the high values of the Grashof number involved, namely Gr¼53,500 and Gr¼230,000. For those cases, in order to allow a comparison of
the experimentally measured segregation with the scaling analysis, we relied on the commercial code Fluent to model the fluid flow and extract a value of the interface shear stress[16]. The simula-tions were carried out in a dimensional form. Regarding fluid flow at high Grashof number, the Fluent code solves the modified equations of momentum and energy conservation featuring a turbulent viscosity that is derived from the solution of two trans-port equations: one for the turbulent kinetic energy k, the other for its rate of dissipation ε. In addition to this k– ε model, we also tested another turbulence model available in the Fluent code, namely the renormalization group (RNG) based k– ε model. For both the 2D and 3D numerical simulations with the Fluent code, for Grashof num-bers lower than 5000 we selected the laminar option, and for Grashof numbers higher than 5000 we adopted the k– ε model. As already noted in[8], for low to moderate convective levels (typically for Gro5000), we checked that both k– ε and laminar models yielded similar results in the Fluent calculations for both the 2D and 3D configurations. Nevertheless, the convergence with the k– ε model was slower, justifying our choice of the laminar option[16]. For these calculations with the Fluent code, the value of the Prandtl number was again kept fixed at 0.015. Simulations were mostly carried out in a 2D configuration for a cavity with an aspect ratio L/H ¼4, but a number of 3D cases were also modeled in order to check the validity of the 2D assumption. For these 3D cases, the
Fig. 1. Model cavity configuration and process parameters.
Fig. 2. Fit of the averaged composition profiles obtained from the numerical simulation (solid line) by using Favier's 1D model (black dots): (a) Gr ¼1000, Pe¼2, Sc¼ 10 and (b) Gr¼ 5000, Pe¼ 0.2, Sc¼ 1 for k¼ 0.087 and Pr ¼ 0.015.
cavity, with a square cross-section, had the same aspect ratio L/H¼4. It should be clear that the Fluent simulations only focused on the hydrodynamic problem, the connection with the experi-mental segregation results being ensured through the model discussed inSection 2.1above.
2.3. Experimental database
For purposes of comparison with the scaling analysis, we will rely on experimental data obtained within the frame of the Mephisto program. Mephisto is essentially a sophisticated Bridg-man furnace, aiming at the investigation of a number of solidifica-tion issues, e.g. the morphological stability of a planar front, the effect of g-jitters in microgravity conditions or the determination of liquid phase thermophysical properties[10,17]. Its most salient feature is the implementation of an in situ and real time Seebeck measurement between two solid/liquid interfaces, one at a given position providing a fixed reference temperature, while the other is allowed to move according to the specifications provided by the experimenter. The Seebeck signal thus provides an information on the global undercooling of the growth interface, information which depends on the structure of the solidification front, i.e. planar or cellular/dendritic. In planar front conditions, the Seebeck signal is directly proportional to the interface under-cooling [10,17], meaning that an experimental determination of the average interface composition, and thus of the convecto-diffusive parameter is straightforward. The Mephisto program was conducted within the frame of a close collaboration between the French nuclear energy commission CEA and the French space agency CNES for the building of the furnace, as well as the American space agency NASA for its implementation within the now retired shuttle in the frame of the United States Microgravity Payload (USMP) missions. Regarding space experiments, the data that will be shown in the present paper comes from the USMP1 and USMP3 missions, where the focus was on dilute Sn:Bi alloys and the solidification was carried out in cylindrical samples of 6 mm in diameter. In USMP1, the selected Bi composition was 0.58 at%, the liquid phase temperature gradient was 173 K/cm and the growth velocity was varied between 2 and 5.5 mm/s to remain in planar front conditions. As for USMP3, the selected Bi composi-tion was 1.6 at%, the liquid phase temperature gradient was 165 K/ cm and the growth velocity was varied between 0.5 and 2 mm/s, again to remain in planar front conditions. In parallel with the flight experiments, a number of experiments were carried out on earth, also on dilute Sn:Bi alloys, both in the Mephisto ground model and in Mephisto's sister furnace Ramses where the sample diameter was slightly smaller at 4 mm. In the Mephisto ground based configuration, the Bi composition was 0.58 at%, the tem-perature gradient was 123 K/cm and the growth velocity was scaled between 5 and 18.3 mm/s. The respective conditions for the Ramses experiments were a Bi composition of 0.13 at%, a temperature gradient of 144 K/cm and a growth velocity between 0.83 and 83 mm/s. It is to be noted that the lower Bi content in the Ramses experiment allowed investigating a larger range of growth velocities while remaining in planar front conditions.
3. Results and discussion
In the present paper where our main purpose is to show that a simple scaling analysis model is able to capture the main features of the segregation phenomena, it is of paramount importance to check whether a single interface shear stress value to be used in Eq.(3)can be unambiguously defined for a given set of simulation or experimental parameters. In this respect, a first question is related to the variation of the interface shear stress value over the
growth interface. Such an issue was discussed in[8]where it was seen that at least from an order of magnitude perspective, the segregation model holds both in terms of maximal or average interface shear stress. Shown in Fig. 3 is the variation of this dimensional wall shear stress obtained in a 2D simulation as a function of the position along the interface for both the hot and cold walls in the Mephisto ground configuration. Both curves are not identical due to a well-known tilt of the main convective loop at high convection levels[18]. The maximal as well as the average shear stress values, however, are exactly similar, as may have been expected due to the centro-symmetry of the flow pattern[18]. In the present work, we decided to focus on the average interface shear stress for the presentation of the results.
Another issue, which was not discussed in[8]since the mass transport problem was there tackled in a quasi-steady form, pertains to the time variation of the interface shear stress. Such a question is indeed far from obvious, since solidification is by nature a transient problem where the size of the fluid domain reduces, meaning that viscosity effects can be expected to become more important as growth proceeds. A related question, also of paramount importance for the practical relevance of the present work, is to check whether the interface shear stress can be unambiguously defined from fluid flow data in a fixed geometry, without requiring a full simulation with a moving interface. This may appear to be an a priori simple question since the imposed growth velocity (in the mm/s range in dimensional terms) is much smaller than the natural convection velocity (in the cm/s range). As such it may be expected to have little or no impact on the interface shear stress, but this point needs to be addressed.
To do so, shown in Fig. 4a and b is the variation of the non-dimensional average interface shear stress Sh, defined as Sh¼τH2/ην,
with the position of the growth front for different values of the Pe/Sc ratio that represents the dimensionless interface velocity from an hydrodynamic problem standpoint and two distinct values of the Grashof number Gr. Both series of curves exhibit a similar behavior, with the interface shear stress increasing significantly during a transient period after the initiation of the solidification. The interface shear stress then reaches some kind of plateau, where the increase is much smaller and probably due to confinement effects, as shown from the data points obtained at Pe¼0, i.e. in a cavity with fixed walls but of dimensions corresponding to the size of the liquid domain. For our present purposes, this allows to consider the process as quasi-steady and use the average interface shear stress at a given position of the interface along the grown ingot as a relevant input
Fig. 3. Variation of the wall shear stress as a function of the position along the interface for both hot and cold walls from the 2D Fluent simulations in the Mephisto ground configuration.
for comparison of the numerical data with the predictions of the scaling analysis. As for the effect of the growth velocity, it can be seen in bothFig. 4a and b that the interface shear stress increases with the Pe/Sc ratio. The increase is, however, limited and at least again from an order of magnitude perspective, the interface shear stress can be safely estimated from a calculation carried out at Pe¼0, thus requiring only the simulation of the coupled heat transfer–hydrodynamic problem in a cavity with fixed walls. This is again favorable in the perspective of a comparison between the predictions given by the scaling analysis and the experimental data, since our Fluent simulations do not include growth interface motion, which means that the interface shear stress is computed with a zero velocity boundary condition corresponding to Pe¼ 0. Another point to be mentioned regarding the comparison with the Mephisto data is that in the experiments, the Pe/Sc ratio remains always smaller than 2, and is often much smaller than unity, due to the large value of the Schmidt number (Sc¼144) in Bismuth doped Tin alloys.
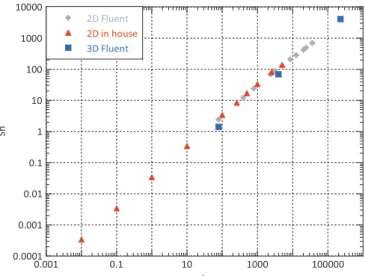
All this being taken into account, we can now present the variations of the non-dimensional interface shear stress Sh as a function of the Grashof number for both the in-house code and the Fluent simulations. This is done inFig. 5where the Gr variation range is seen to cover almost 8 orders of magnitude. The scatter of
the data is remarkably limited, which supports our contention that the Grashof number is the main parameter of the fluid flow problem for these small Pr situations. Also quite remarkable, at least from an order of magnitude perspective is the consistency between the in-house code and the Fluent code results. Finally, the simulations carried out in a 3D configuration with the Fluent software confirmed that the 2D approximation is indeed very good, at least for our present problem where we focus on interface shear stress and segregation issues in an order of magnitude perspective. This supports the validity of our choice of the interface shear stress as a rather robust parameter for the characterization of the fluid flow pattern in natural convection problems.
A priori surprising is the quasi-linear variation of Sh as a function of Gr, even far away from the viscous regime where it can be expected to hold from a simple buoyancy vs viscosity force balance. A departure from a perfect proportionality relation can be observed somewhere between Gr ¼1000 and Gr¼ 10,000, but a much stronger effect may have been expected. For the sake of completeness, a word on heat transfer issues and on the value of the Prandtl number may be appropriate: for the in-house code simulations, due to the moderate convective levels, the results in terms of fluid flow at Pr¼0.015 are very similar to those in the reference Pr¼ 0 case. Such is not the case in the Fluent simulations, where the isotherms are seen to be significantly distorted. Never-theless,Fig. 5clearly shows that this thermal effect has virtually no influence (again for order of magnitude purposes) on the observed values of the shear stress.
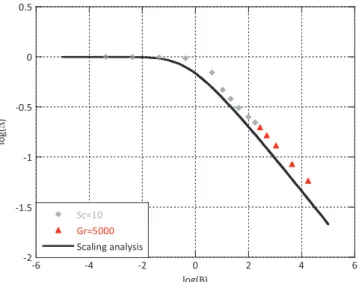
If we now turn to species transport issues and to the comparison of the segregation data with the predictions of the scaling analysis, let us first focus on the results of the in-house code where the effective partition coefficient and the convecto-diffusive parameters can be directly computed from the numerical simulations results. The results are shown inFig. 6where a distinction is made between the simulations carried out either at fixed Gr or at fixed Sc. These different variations are chosen so as to allow for a large range of variation of the B parameter. Both sets of data are perfectly in line, supporting the validity of our choice of a (B,Δ) representation to account for segregation. On a quantitative basis, the agreement between the numerical data and the predictions of the model is quite good from an order of magnitude perspective, except may be at the transition between the quasi diffusive (Δ% 1) and the fully convective (Δ{1) transport regimes, where a 1D approach is questionable due to the large lateral or radial segregation.
Fig. 4. Evolution of the non-dimensional average interface shear stress Sh with the position of the moving interface for Pr ¼0.015, (a) Gr ¼100 and (b) Gr¼ 1000, for a 2D model with an initial aspect ratio A¼ 4 and different values of Pe/Sc.
Fig. 5. Variation of the non-dimensional average interface shear stress Sh as a function of the Grashof number Gr for both in house and Fluent simulations at Pr¼ 0.015.
If we now turn to the comparison between scaling analysis and experimental data, we first want to recall that in that case, the numerical simulations do not allow a direct access to the effective partition coefficient and the convecto-diffusive parameter. Our procedure is to solve the Navier–Stokes equations for the Grashof number relevant to the growth conditions, thus obtain a numerical value for the average interface shear stress and then derive the B parameter. This B parameter is then associated to the experimen-tally measured Δ for the given growth conditions and plotted against the scaling analysis master curve. The results of this procedure are shown in Fig. 7, where the data coming from ground based and microgravity experiments again allow covering a wide range of variation of the growth parameters. With respect to the numerical simulation results shown in Fig. 6, the experi-mental data are obviously more scattered, but the agreement with the predictions of the scaling analysis can still be considered very good. Regarding the comparison with the experiments, it should
be mentioned that solutal buoyancy, coming from the variation of the alloy density with composition, may have been involved in the flow driving process. However, using the procedure developed in Ref.[19], we checked that thermal buoyancy was clearly dominant in all our experimental cases.
4. Concluding remarks
Our objective in the present paper was to test the validity of a recently developed segregation model based on the value of the flow induced interface shear stress against existing well docu-mented numerical and experimental data obtained in the hori-zontal Bridgman configuration. From a theoretical standpoint, such a configuration is characterized by a well-defined convective driving source, an interesting feature for purposes of comparison with model predictions. Our results show that despite unavoidable space and time variations during solidification, the interface shear stress is a quite robust indicator of the hydrodynamic convection level in the fluid. Our contention that at least for the purposes of solute segregation modeling, the flow induced interface shear stress can be computed from the Navier–Stokes equations without having to fully model the solidification problem and its associated ultra-thin solute boundary layers is thus justified. As for mass transport issues, it was seen that the previously introduced [8]
non-dimensional parameter based on this interface shear stress could satisfactorily account for the observed chemical segregation along the solidified ingots. As a matter of fact, we observed a good agreement between the predictions of the scaling analysis and both the numerical and experimental data.
As extensions to the present work, further tests of the validity of the model could be carried out, e.g. in forced convection conditions or for various types of magnetohydrodynamic flows
[20]. It could also be interested to check whether the present interface shear stress model could be used to model radial or lateral solute segregation.
References
[1]C. Stelian, T. Duffar, A. Mitric, V. Corregidor, L.C. Alves, N.P. Barradas, J. Cryst. Growth 283 (2005) 124.
[2]J. Hofstetter, J.F. Lelievre, C. del Canizo, A. Luque, Mat. Sci. Eng. B 159–160 (2009) 299.
[3]J.A. Burton, R.C. Prim, W.P. Schlichter, J. Chem. Phys. 21 (1953) 1987. [4]L.O. Wilson, J. Cryst. Growth 44 (1978) 247.
[5]S. Kaddeche, H. Ben Hadid, D. Henry, J. Cryst. Growth 135 (1994) 341. [6]A. Ostrogorsky, G. Müller, J. Cryst. Growth 121 (1992) 587.
[7]A. Ostrogorsky, J. Crystal Growth 348 (2012) 97;
A. Ostrogorsky, J. Crystal Growth 380 (2013) 43.
[8]J.P. Garandet, N. Kaupp, D. Pelletier, Y. Delannoy, J. Cryst. Growth 340 (2012) 149.
[9]A. Rouzaud, J. Comera, P. Contamin, B. Angelier, F. Herbillon, J.J. Favier, J. Cryst. Growth 129 (1993) 173.
[10]J.J. Favier, J.P. Garandet, A. Rouzaud, D. Camel, J. Cryst. Growth 140 (1994) 237. [11] T.J. Hanratty, J.A. Campbell, Fluid Mechanics Measurements, in: R.J. Goldstein
(Ed.), Hemisphere Publishing Corporation, New York, 1983, p. 559. [12]R. Hirsh, J. Comput. Phys. 19 (1975) 90.
[13]B. Roux, P. Bontoux, T.P. Loc, O. Daube, in: R. Rautmann (Ed.), Lecture Notes in Mathematics, 771, Springer, Berlin, 1980, p. 450.
[14]J.F. Thompson, Z. Vawarsi, C.W. Matsin, Numerical Grid Generation, Elsevier, Amsterdam, 1985.
[15]J.J. Favier, Acta Metall. 29 (1981) 197 and 205. [16] ANSYS Inc., FLUENT 12.0 Theory Guide 2009.
[17] J.P. Garandet, G. Boutet, P. Lehmann, B. Drevet, D. Camel, A. Rouzaud, J.J. Favier, G. Faivre, S. Coriell, J.I.D. Alexander, B. Billia, J. Cryst. Growth 279 (2005) 195. [18]H. Ben Hadid, D. Henry, S. Kaddeche, J. Fluid Mech. 333 (1997) 23. [19]T. Alboussière, A.C. Neubrand, J.P. Garandet, R. Moreau, J. Cryst. Growth 181
(1997) 133.
[20] C. Tanasie, D. Vizman, J. Friedrich, J. Cryst. Growth 318 (2011) 293. Fig. 7. Variation of the convecto-diffusive parameter Δ as a function of B. Full line:
theoretical predictions; symbols: experimental results.
∆
Fig. 6. Variation of the convecto-diffusive parameter Δ as a function of B. Full line: theoretical predictions; symbols: numerical simulation results. The set of simula-tions performed for Sc¼ 10 corresponds to Gr values between 0.01 and 5000. The set of simulations performed for Gr¼ 5000 corresponds to Sc values between 1 and 8. In both cases, we choose Pe/Sc ¼ 0.2.