O
pen
A
rchive
T
OULOUSE
A
rchive
O
uverte (
OATAO
)
OATAO is an open access repository that collects the work of Toulouse researchers and makes it freely available over the web where possible.
This is an author-deposited version published in: http://oatao.univ-toulouse.fr/ Eprints ID : 14338
To link to this article: DOI: 10.1177/0957650915587144 URL: http://dx.doi.org/10.1177/0957650915587144
To cite this version : Dufour, Guillaume and Garcia Rosa, Nicolas and Duplaa, Sébastien Validation and flow structure analysis in a turbofan stage at windmill. (2015)
Proc IMechE Part A: Journal of Power and Energy, vol. 22 (n°6). pp.571-583. ISSN 0957-6509
Any correspondance concerning this service should be sent to the repository administrator: [email protected]
Validation and flow structure analysis in a
turbofan stage at windmill
Guillaume Dufour∗ Nicol ´as Garc´ıa Rosa S ´ebastien Duplaa Universit ´e de Toulouse
Institut Sup ´erieur de l’A ´eronautique et de l’Espace (ISAE) 10 avenue Edouard Belin, 31400 Toulouse
France
ABSTRACT
In the present study, the flow through the fan stage of a high bypass ratio turbofan at windmill is studied numerically. First, steady mixing plane simulations are validated against detailed experimental engine test-bed measurements, at several locations within the fan stage and close to the core/bypass flow splitter. Good agreement between the numerical and experimental results is obtained. A local flow analysis is proposed, evidencing several characteristics of the flow in windmilling: in the rotor, the size of the separation zone is found to increase from hub to tip, and in the stator, massive flow separation occurs at mid-span, which leads to the formation of two streamwise counter-rotating vortices. Then, the Nonlinear Harmonic (NLH) method is applied to a section (at 70 % of the relative span) of the fan stage. A modal analysis is performed, showing a specific behavior at windmill: the massively separated flows in the rotor and the stator entail strong rotor/stator interactions modes. Finally, the unsteady flow pattern is examined: the velocity defect of the rotor wake, which periodically increases the flow angle on the stator, is shown to trigger a periodic movement of the reattachment point at the trailing edge of the stator, associated with vortex shedding from the lower side of the vane. The implication of this qualitative flow behavior on the method to extract CFD results for comparisons with experiments is discussed.
1 Introduction
When a turbofan engine flames out during flight, the ram pressure at the fan inlet creates an internal flow that causes spool rotation and windmilling operation [1] (corresponding to a freewheeling mode of the rotor). Early in the design process, determination of the windmilling rotational speed of the fan can be critical in sizing the shaft bearing lubrication systems and the supporting structure of the engine [2]. Furthermore, the assessment of the relight capability of the engine requires the evaluation of the mass flow rate, pressure and temperature in the combustor. Finally, engine drag at windmill and energy extraction potential from the engine are required for integration questions. Though global approaches [1, 3–9] can provide useful information, the characterization, understanding and prediction of the flow in the turbomachinery components are essential to properly account for the specificity of the windmilling regime, particularly for relight capability assessment.
Regarding the aerodynamics of the fan stage, the available experimental [10] or numerical stud-ies [10–12] indicate that, in the windmilling regime, the fan stage operates under severe negative angles of attack, leading to massive flow separation on the lower side of both the rotor and the stator. Prasad & Lord [12] compare CFD and experimental results, but the validation data is limited in terms of location within the engine (only between the rotor and the stator) and quantities (pressure and flow angle only). Due to the separation, significant unsteady rotor/stator wake interactions can be expected. Unsteady analyses at windmill have been proposed by Goto et al. [13] and Gill et al. [14, 15], but both studies consider compressor (low aspect ratio blades), which can be expected to exhibit different physics than classical high-aspect ratio fan blades. In this context, the problematic of the present study is to gain more insight into the physics of the flow in a fan stage at windmill. To this end, the proposed approach consists in first validating flow predictions against detailed measurements in a complete modern high-bypass-ratio geared turbofan (Garc´ıa Rosa et al. [16]). Then, a simplified computational model of a section of the stage is simulated with an unsteady approach, in order to analyze rotor/stator interactions and unsteady separated-flow patterns.
After introducing the test case, the numerical methods are briefly described. In the following sec-tions, validation results at several measurement planes are discussed, and a detailed local analysis of the flow is proposed. Finally, the unsteady results are presented, and implication to improve the validation process are pointed out.
2 Test case and methodology 2.1 The DGEN 380 Turbofan
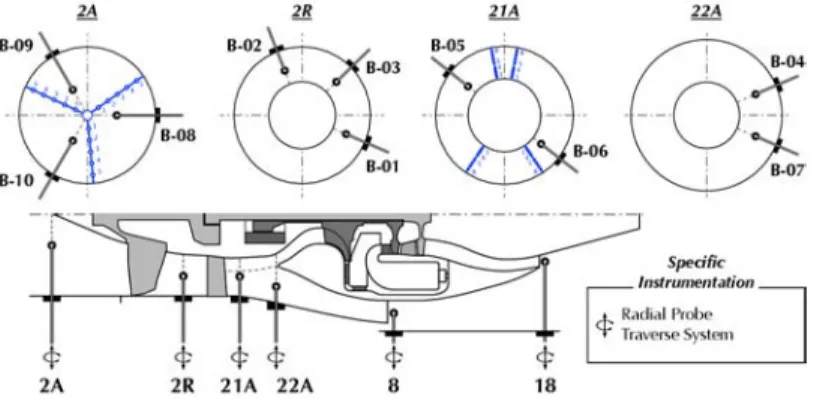
The DGEN 380 is an advanced, high bypass ratio, unmixed-flow geared turbofan developed by Price Induction. The engine is designed for two- to four-seater private light aircraft in twin-jet configuration. It is optimized for a cruise altitude of 4 500 m and a cruise Mach number of 0.338. The fan diameter is less than 352 mm and is driven by a single-stage uncooled low-pressure turbine stage. The core engine consists of a centrifugal compressor and a single-stage high-pressure turbine stage. Figure 1 presents a meridional cut of the engine. In this engine, the stator blade (fan outlet guide vane) is located upstream of the core/bypass flow splitter, which makes it reasonable to consider the fan stage independent of the potential effect from the high-pressure compressor. The fan rotor has ZR =14 blades and the stator ZS=40.
A fully-instrumented version of the DGEN 380 is on the test rig of ISAE, specially suited to re-produce windmilling operation in an ambient ground set up. The engine is equipped with conventional measurement systems to characterize the cycle performance, and with directional five-hole probes to characterize the flow across the fan stage. To reproduce windmilling conditions, a 75 kW centrifugal fan is used to blow air through the engine, up to 6 kg/s mass flow rate and a local Mach number of
0.16 at the engine inlet [16]. In the present study the focus is on two windmilling operating points, corresponding to inlet Mach numbers of M0=0.16 and M0=0.08, respectively.
Numerical configuration
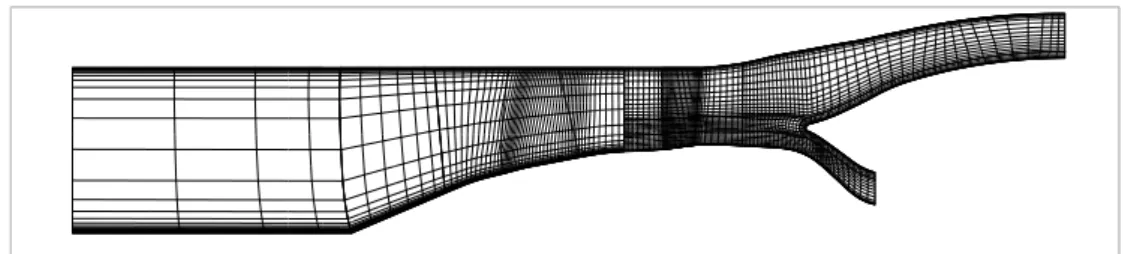
The numerical domain starts upstream of the spinner and ends right upstream of the bypass nozzle exit, and at the inlet of the high-pressure compressor in the core flow duct, as illustrated in Figure 2(a) with a meridional mesh. A mixing plane is located between the rotor and the stator. The geometry of the fan includes the hub fillet and the tip clearance gap, as can be observed in Figure 2(b) and 2(c), respectively.
The numerical domain is discretized with a multi-block structured mesh generated with Numeca’s Autogrid 5TM, consisting of O-type blocks around the blades, and H-type blocks to fill the passage. The first cell at the wall has a size of 10 µm, ensuring a value of ∆y+
w ∼ 1.5 over the blades for all the simulations at windmill. The expansion ratio across the boundary layer mesh is about 10 %. The tip-gap region is meshed using a butterfly topology (i.e., anO-type block surrounded by andH-type block), using 25 points in the span direction. Non-matching connections are used on periodic faces to facilitate the generation of a high-orthogonality mesh, as shown in Figure 2. Overall, the mesh is comprised of about 8 million points (details are given in Table 1).
Number of points ∆y+
w Total O grid Azimuth Span aver. max.
Rotor 3.5 Mpts 273 × 33 73 161 1.4 5.7
Stator 4.4 Mpts 233 × 37 65 157 1.4 7.0
Table 1. Mesh characteristics.
2.2 Numerical methods
The simulations are performed with the Euranus solver of the Fine/TurboTM package of Numeca. This multi-block solver is thoroughly presented by Hirsch et al. [17].
For steady problems, the Reynolds-averaged Navier–Stokes equations (RANS) in the rotating frame are solved with a pseudo-time-marching method. Time integration is ensured by a four-stage Runge-Kutta scheme with implicit residual smoothing. Local time stepping and a three-level multigrid tech-nique are used to accelerate convergence to the steady state.
The discretization in space is based on a cell-centered finite-volume approach. Convective fluxes are determined by a second-order centered scheme with added artificial dissipation of the Jameson type [18]. Viscous fluxes are centered. The mixing plane interface is treated with a conservative coupling by pitchwise rows. Turbulence closure is provided by the one-equation model of Spalart & Allmaras.
At the inlet of the numerical domain, radial profiles are imposed according to the experimental measurements to account for the installation effects of the windmilling set-up (including boundary layers generated along the wall of the duct connecting the blower to the engine, and a small residual tangential velocity induced by the blower). At the core and bypass duct outlets, static pressure is imposed with a radial equilibrium condition. The values derived from the experimental data are adjusted to match the experimental total pressure profiles at station 22A (see Figure 1).
(a) Meridional view (one every 4 points shown).
(b) Close up of rotor leading edge at hub (one every 2 points shown).
(c) Close up of rotor trailing edge at tip (one every 2 points shown).
Fig. 2. Views of the mesh.
2.3 Post-processing
All the quantities compared in the present paper are based on radial traverse of 5-hole probes at dif-ferent azimuthal positions: the experimental (EXP) values can thus be regarded as time averages. The numerical post-processing is adapted to best match the experimental procedure depending on the station considered:
(i) Downstream of the fan, the (fixed) probe sees the rotating flow issued from the rotor. In the calcu-lation, the axial position of the probe lies in the rotating frame of the rotor. Since the computed flow is steady in the relative frame, it can be assumed that azimuthal averaging in the relative frame is equiv-alent to temporal averaging at a fixed position in the absolute frame. Therefore, the radial profiles at station 2R are extracted after a mass-weighted azimuthal averaging of the CFD results.
(ii) Downstream of the stator, the flow is not rotating, therefore the extraction from the computation is performed along a constant azimuthal position matching the experimental location. However, since the real flow is unsteady, this induces a bias in the comparison, which will be discussed further.
3 Validation against experimental results
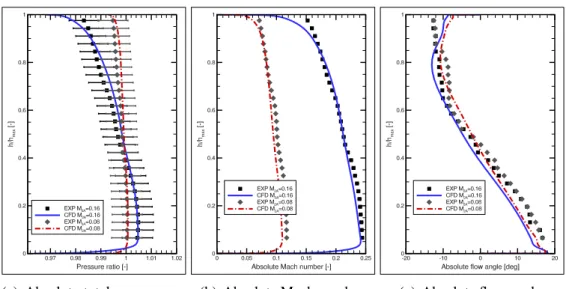
Figures 3, 4 and 5 present the comparison between the CFD and experimental results at stations 2R, 21A and 22A, respectively, for the absolute total pressure ratio, Mach number and flow angle. For each plot, the results for the two windmilling operating points are presented, denoted according to the inlet Mach number M2A.
(a) Absolute total pressure ra-tio.
(b) Absolute Mach number. (c) Absolute flow angle.
Fig. 3. Validation downstream of the rotor (station 2R).
(a) Absolute total pressure ra-tio.
(b) Absolute Mach number. (c) Absolute flow angle.
Fig. 4. Validation downstream of the stator (station 21A).
(a) Absolute total pressure ra-tio.
(b) Absolute Mach number. (c) Absolute flow angle.
Downstream of the rotor (station 2R), the agreement is quite fair, with some minor discrepancies in the tip region.
Downstream of the stator (21A), some more important discrepancies appear above midspan. In ad-dition to the fixed azimuthal position extraction described earlier (referred to as “θ post”), a different extraction is plotted, obtained from an azimuthal pitch-average (referred to as “pav post”). This ex-traction yields results in better agreement with the experimental ones. To understand this behavior, the separation zones and the unsteady nature of the flow are discussed in the following two sections.
Finally, at the station close to the flow splitter (22A) the agreement is fair for the pressure ratio (within experimental uncertainties), but more scattered for the Mach number. Close to the hub, a region of low velocity is observed, in which the absolute flow angle prediction is far off the experimental measurement.
4 Local flow analysis of 3D results
The goal of this section is to use the CFD results to better understand the flow topology.
Figure 6(a) presents friction lines on the lower side of the rotor. Flow separation, due to the negative angle of attack, occurs at the leading edge along the whole span, as already observed by Prasad & Lord [12]. The reattachment line is visible close to the leading-edge at the hub, and moves further downstream for the outboard sections, until about 75 % of the chord close to the tip. This is illustrated with blade-to-blade contours of relative Mach number in Figures 6(b) and 6(c).
In the stator, Figure 7(a), the separation topology is more complex. The separation line is again at the leading edge, and the reattachment line moves further downstream along the span, until about 60 % span where there is no reattachment on the blade. However, close to the shroud (about 90 % span), the flow reattaches, with a reattachment line moving back upstream towards the leading edge. This area of full separation is thus responsible for the absolute flow angle profile issued from the stator (Figure 4(c)), where a deviation of −4◦ can be observed between 60 % and 90 % span. In the fully separated zone, two counter-rotating streamwise vortices can be seen with the secondary flow streamlines in the low Mach region in Figure 7(a). Figures 7(b) and 7(c) depict the associated Mach number contours in blade-to-blade planes.
Finally, Figure 8 shows the pitch-averaged contours of Mach number close to the flow splitter. A separation due to aerodynamic blockage in the core duct is observed, which is responsible for the low velocity region previously observed in the radial profiles at station 22A.
5 Unsteady analysis at 70 % relative blade height
In this section, unsteady simulations are discussed, in order to: (i) gain further insight into the flow mechanisms occurring at windmill, and (ii) propose an explanation for the improved agreement of CFD and experiments observed above when using pitch-averaging downstream of the stator (“θ post” as compared to “pav post” in Figure 4).
5.1 The nonlinear harmonic method (NLH)
As an alternative to classical time-marching approaches, the Fourier-based nonlinear harmonic method (NLH) is used. Originally proposed by He [19–22], the method has been implemented in Eu-ranus by Vilmin [23], and assessed for many turbomachinery applications (see for instance Refs. [24–26] for instance).
Following the approach proposed by He [27] for multi-harmonic flows, the flow variables are mapped on a set of prescribed frequencies using generalized Fourier series. Injecting this
decompo-(a) Friction lines on the lower side of the rotor (flow from left to right).
(b) Relative blade height of 15 %.
(c) Relative blade height of 90 %.
Fig. 6. Structure of the separated flow in the rotor for theM2A=0.16windmilling operating point.
(a) Friction lines on the lower side of the stator (flow from right to left).
(b) Relative blade height of 15 %.
(c) Relative blade height of 90 %.
Fig. 7. Structure of the separated flow in the stator.
sition into the URANS equations, and retaining only first-order terms, conservation equations for the complex harmonic amplitudes are obtained, which are then solved directly in the frequency domain. By time averaging the URANS equations, a system similar to the Reynolds-averaged one is obtained, with the impact of unsteady-flow effects appearing as deterministic stresses, much like the Reynolds stresses, except that the former can be directly computed from the harmonics obtained simultaneously in the frequency domain. Used in combination with generalized chorochronic (phase-lag) boundary conditions [23, 28, 29], a single-passage mesh can be used.
Fig. 8. Mass-pondered pitch-averaged contours of absolute Mach number, with streamlines. The vertical line indicates station 21A.
of 70 % is selected, because according to the previous analysis, it is the area where the largest separation zone is predicted. Due to the 2D nature of the section, the results obtained are not directly representative of the 3D flow, but this study aims at a qualitative understanding of the rotor/stator interaction with separated flows at negative incidence, and at a first analysis of the unsteady flow pattern in the stage at windmill. A detailed discussion of the mesh and number of harmonics convergence effects for this case can be found in a previous study (Ref. [30]).
5.2 Modal analysis
Using the NLH results for the harmonics of the flow variables, instantaneous solutions can be com-puted by spectral reconstruction in the time domain. Using phase-lag relations, the flow field over an arbitrary number of blade channels can be computed.
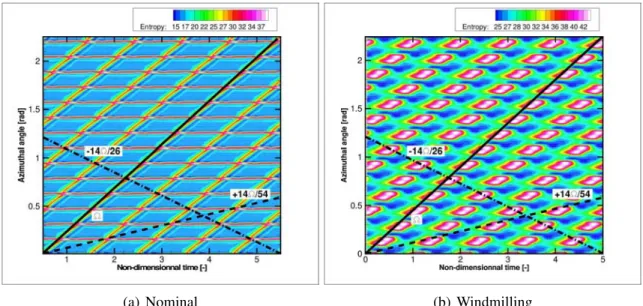
To analyze the nature of the rotor/stator interactions, the full signal over 360◦one chord downstream of the stator is extracted at each instant. The flow variable selected is the entropy, as it allows to visualize the wakes regardless of the reference frame. Figure 9 shows the space–time diagram thus obtained. To give some perspective, both the nominal and the windmilling operating point are included. In a space-time diagram in the absolute frame, horizontal stripes correspond to stator wakes, and diagonal stripes correspond to rotating modes.
For the nominal operating point, the stator wakes (horizontal stripes) can be clearly distinguished from the first rotating mode, which corresponds to the rotor wakes. In this case, the rotor wakes are simply convected through the stator: they appear as stripes of slope 1 (i.e., they rotate at the shaft speed Ω). Interaction modes appear when the rotor and stator wakes intersect, which are shown in the space–time diagram as positive and negative slopes lines.
For the windmilling operating point, the structures are more intricate: the stator wake are modulated by the rotor wakes, and the distinction between horizontal and diagonal modes is less obvious. The unsteady “pockets” of higher entropy can be seen as: (i) horizontal, (ii) diagonal with a slope of 1, (iii) diagonal with a slope of −14/26 and (iv) diagonal with a slope of +14/54.
The values of theses slopes can be explained according to the framework proposed by Tyler & Sofrin [31], which states that rotor/stator interactions give rise to spatial modes characterized by:
mθ=n × ZR+k × ZS, (1)
where m is the number of the azimuthal mode (i.e., the number of lobes of the rotating waves created by the interaction), n and k are relative integers, and ZR and ZS are the rotor and stator numbers of
(a) Nominal (b) Windmilling
Fig. 9. Space–time diagram of entropy downstream of the stator.
blades. As discussed by Courtiade et al. for instance [32], the rotational speed ωmθ of the mode can be
expressed as: ωm θ = n × ZR mθ Ω. (2)
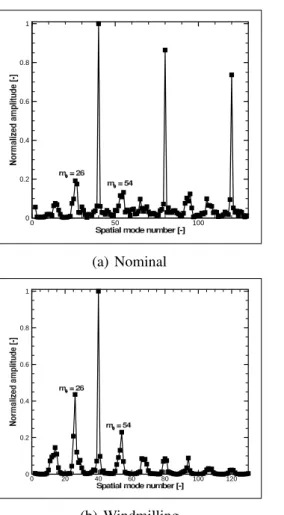
For a given instant, a spatial discrete Fourier transform (DFT) can be applied to the entropy signal, as shown in Figure 10. The results show very different spatial interactions for the two cases, which are summarized in the table of Figure 10. For the nominal operating point, the main mode is that of the stator mθ=40 = 1 × ZS. The secondary modes are the harmonics of the stator mode mθ=80 = 2 × ZS to mθ =240 = 6 × ZS, and only then come the interaction modes between the rotor and the stator as mθ =26 = −1 × ZR+1 × ZS and mθ=54 = +1 × ZR+1 × ZS. For the windmilling case, the main mode is the stator mode mθ =40 = 1 × ZS, whose rotational speed is zero, and which corresponds to the horizontal lines in Figure 9. The second mode is an interaction mode mθ=26 = −1 × ZR+1 × ZS, corresponding to a rotational speed of ω26 =14/26, which is the first stripe previously identified. The following modes, by order of importance, are mθ=54 = 1 × ZR+1 × ZS corresponding to a rotational speed of ω54=14/26, mθ=14 = 1 × ZRthe rotor mode and then mθ=68 = 1 × ZR+2 × ZS and only after comes the first harmonic of the stator mode mθ=80 = 2 × ZS. It appears therefore that all the stripes observed in the space-time diagram do have a modal behavior. To understand the reason for the intricate nature of the different stripes, a qualitative flow analysis is proposed in the next section. 5.3 Unsteady flow pattern analysis
Figure 11 presents a sequence of snapshots of the flow around the stator blade at 6 instants, uniformly sampling the period in the stator (i.e., associated the rotor blade passing frequency as seen by the stator FBPF−R= ω ∗ ZR/2π ≃ 700 Hz). Three stator blades are visible, but the focus will be on the flow around the central one. Color contours of entropy are represented, with the black line indicating zero axial velocity. Time goes from left to right then top to bottom.
During the unsteady passing of the wake, the velocity defect in the relative frame entails a positive variation of the absolute angle flow angle: the incidence on the stator is increased. Since the separation occurs on the lower side because of the highly negative angle attack, the flow reattaches (because the incidence on the stator is “less negative”) at three quarters of the chord after the passing of the wake, as
0 50 100 0 0.2 0.4 0.6 0.8 1 (a) Nominal 0 20 40 60 80 100 120 0 0.2 0.4 0.6 0.8 1 (b) Windmilling mθ n k ωmθ/Ω Nominal 40 0 1 0 80 0 2 0 160 0 3 0 240 0 4 0 26 −1 1 −14/26 54 1 1 14/54 Windmilling 40 0 1 0 26 −1 1 −14/26 54 1 1 14/54 14 1 0 1 68 1 2 28/68 80 0 2 0
Fig. 10. Spatial modes extraction at a given instant.
illustrated on the velocity diagrams of Figure 12. Due to the periodic passing, vortex shedding occurs, visible as a spot of high entropy level in Figure 11, with a time period locked on to the rotor blade passing frequency as seen by the stator.
Finally, it appears that downstream of the stator, the wakes of the rotor and stator merge as a single high entropy zone. This is the reason why the high entropy spots in the space–time diagram at windmill can be linked simultaneously to the rotor, the stator and the interaction modes.
Fig. 11. Snapshots of the flow at windmill: contours of entropy on a blade-to-blade plane in the stator. The black line indicates zero axial velocity. Time goes from left to right and top to bottom with uniform sampling of the period in the stator( ie, the blade passing frequency of the rotor). The black square represents the “θpost” extraction point.
Wake
i>0
5.4 Consequences for validation of steady simulations
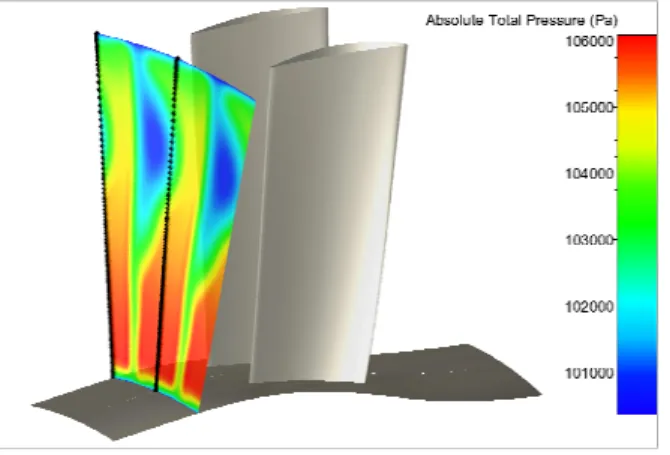
Going back to the validation of the radial profile at station 21A (Figure 4), the unsteady flow pattern is – at least qualitatively – what a probe sees and averages in time. Comparing the flow field at the probe location in the unsteady case (Figure 11) and in the steady case (Figure 13), it appears that, in the mixing plane simulation, the numerical probe is within the separated zone around 70 % span, whereas in the unsteady case the separated zone is only intermittently at the probe location. The conclusion is that, given the unsteady effects, which are neglected in the mixing plane calculations, a work-around to reduce the modeling error due to the steady approach is to perform a post-processing of the steady results downstream of the stator with pitch-averaging, to improve the agreement with the experimental data. Generalization of this procedure should be performed on a case-dependant basis, but it is probably suited to flows with strong unsteadiness associated to large variations of the azimuthal properties.
Fig. 13. 3D mixing plane computation: location of the “θextract” probe line at station 21A downstream of the stator, with contours of absolute total pressure.
6 Conclusion and perspectives
In this paper, the flow through a fan stage at windmill has been investigated using CFD simulations. Validation against detailed experimental data shows the ability of the mixing-plane approach to repro-duce the essential flow physics.
Local analysis confirms the negative angle of attack on both the rotor and the stator, leading to lower-side flow separation. The 3D topology of the separation patterns on the blades is evidenced, showing a more complex behavior in the stator, with a fully 3D separation topology. Finally, flow separation from the hub surface right upstream of the secondary/core flow splitter is reproduced in the calculation. Investigations are being carried on the upstream effects of the high-pressure centrifugal compressor in the core duct.
Using the NLH method, unsteady analysis of the flow over a section of the stage close to the tip indicates that the modal content of the rotor/stator interactions downstream of the stator is quite specific: several fundamental and interaction modes are found to superimpose, as the wakes of the rotor and stator merge. Overall, the unsteady flow analysis provides valuable information for post-processing the steady CFD results, which is shown to improve the validation methodology to compare calculations and experiments. Current investigations on the unsteady flow effects at windmilling are focused on non-synchronized unsteady separation behavior in the rotor.
References
[1] P. P. Walsh and P. Fletcher, 2004. Gas Turbine Performance. Blackwell Science, Oxford, U.K. [2] von Groll, G., and Ewins, D. J., 2000. “On the Dynamics of Windmilling in Aero-Engines”. In
IMechE Conference Transactions, Vol. 6, Professional Engineering Publishing; 1998, pp. 721–730. [3] Riegler, C., Bauer, M., and Kurzke, J., 2001. “Some Aspects of Modeling Compressor Behavior
in Gas Turbine Performance Calculations”. Journal of Turbomachinery, 123(2), pp. 372–378. [4] Anderson, B. A., Messih, D., and Plybon, R., 1997. “Engine Out Performance Characteristics”. In
ISABE, no. 97-7216.
[5] Braig, W., Schulte, H., and Riegler, R., 1999. “Comparative Analysis of the Windmilling Perfor-mance of Turbojet and Turbofan Engines”. Journal of Propulsion and Power, 15(2), pp. 326–333. [6] Riegler, C., Bauer, M., and Schulte, H., 2003. “Validation of a Mixed Flow Turbofan Performance
Model in the Sub-Idle Operating Range”. Vol. 2003, ASME, pp. 83–90.
[7] Pilet, J., Lecordix, J.-L., Rosa, N. G., Bar`enes, R., and Lavergne, G., 2011. “Towards a Fully Coupled Component Zooming Approach in Engine Performance Simulation”. Vol. 2011, ASME, pp. 287–299.
[8] Fuksman, I., and Sirica, S., 2012. “Real-Time Execution of a High Fidelity Aero-Thermodynamic Turbofan Engine Simulation”. Journal of Engineering for Gas Turbines and Power, 134(5), p. 054501.
[9] Zachos, P. K., 2013. “Modelling and Analysis of Turbofan Engines Under Windmilling Condi-tions”. Journal of Propulsion and Power, 29(4), pp. 882–890.
[10] Zachos, P. K., Grech, N., Charnley, B., Pachidis, V., and Singh, R., 2011. “Experimental and Numerical Investigation of a Compressor Cascade at Highly Negative Incidence”. Engineering Applications of Computational Fluid Mechanics, 5(1), pp. 26–36.
[11] Celestina, M. L., Suder, K. L., and Kulkarni, S., 2010. “Results of an Advanced Fan Stage Over a Wide Operating Range of Speed and Bypass Ratio: Part II—Comparison of CFD and Experimental Results”. Vol. 2010, ASME, pp. 465–475.
[12] Prasad, D., and Lord, W. K., 2010. “Internal Losses and Flow Behavior of a Turbofan Stage at Windmill”. Journal of Turbomachinery, 132(3), p. 031007.
[13] goto2014, 2014. “Unsteady Flow Structure in an Axial Compressor at Windmill Condition”. In ASME Turbo Expo 2014, no. GT2014-25609.
[14] Gill, A., von Backstr¨om, T., and Harms, T., 2007. “Fundamentals of Four-Quadrant Axial Flow Compressor Maps”. Proceedings of the Institution of Mechanical Engineers, Part A: Journal of Power and Energy, 221(7), pp. 1001–1010.
[15] Gill, A., von Backstr¨om, T., and Harms, T., 2014. “Flow Fields in an Axial Flow Compressor During Four-Quadrant Operation”. Journal of Turbomachinery, 136(6), p. 061007.
[16] Garc´ıa Rosa, N., Dufour, G., Bar`enes, R., and Lavergne, G., 2015. “Experimental Analysis of the Global Performance and the Flow Through a High-Bypass Turbofan in Windmilling Conditions”. Journal of Turbomachinery, 137(051001).
[17] Hirsch, C., Lacor, C., Dener, C., and Vucinic, D., 1991. An Integrated CFD System for 3D Turbo-machinery Applications. Tech. rep., AGARD-CP-510.
[18] Jameson, A., Schmidt, W., and Turkel, E., 1981. “Numerical Solutions of the Euler Equations by Finite Volume Methods Using Runge-Kutta Time-Stepping Schemes”. In AIAA 14th Fluid and Plasma Dynamic Conference, no. AIAA Paper 81-1259.
[19] He, L., and Ning, W., 1998. “Efficient Approach for Analysis of Unsteady Viscous Flows in Turbomachines”. AIAA Journal, 36(11), Nov., pp. 2005–2012.
[20] Ning, W., and He, L., 1998. “Computation of Unsteady Flows Around Oscillating Blades Us-ing Linear and Nonlinear Harmonic Euler Methods”. Journal of Turbomachinery, 120(3), July, pp. 508–514.
[21] Chen, T., Vasanthakumar, P., and He, L., 2001. “Analysis of Unsteady Blade Row Interaction Using Nonlinear Harmonic Approach”. Journal Of Propulsion And Power, 17(3), pp. 651–658. [22] He, L., Chen, T., Wells, R. G., Li, Y. S., and Ning, W., 2002. “Analysis of Rotor–Rotor and
Stator–Stator Interferences in Multi-Stage Turbomachines”. Journal of Turbomachinery, 124(4), pp. 564–571.
[23] Vilmin, S., Hirsch, C., Lorrain, E., and Swoboda, M., 2006. “Unsteady Flow Modeling across the Rotor/Stator Interface Using the Nonlinear Harmonic Method”. In Proceedings of GT2006 – ASME Turbo Expo 2006: Power for Land, Sea and Air, no. 90210 in GT-2006.
[24] Vilmin, S., Lorrain, E., and Hirsch, C., 2007. “The Nonlinear Harmonic Method for Rotor/Stator Interactions Applied to Thermally Perfect Gas”. In 8th International Symposium on Experimental and Computational Aerothermodynamics of Internal Flows, no. ISAIF8-0066.
[25] Hembera, M., Danner, F., Kainz, M., and Kau, H.-P., 2010. “Comparing Frequency-Based Flow Solutions to Traditional Unsteady Fluid Dynamics Analysis in Turbomachinery”. In High Perfor-mance Computing in Science and Engineering, Garching/Munich 2009, S. Wagner, M. Steinmetz, A. Bode, and M. M. M¨uller, eds. Springer Berlin Heidelberg, pp. 161–174.
[26] Liu, B., Zhang, B., and Liu, Y., 2014. “Numerical Investigations of Impeller–Diffuser Interac-tions in a Transonic Centrifugal Compressor Stage using Nonlinear Harmonic Method”. Pro-ceedings of the Institution of Mechanical Engineers, Part A: Journal of Power and Energy, p. 0957650914544484.
[27] He, L., 1992. “Method of Simulating Unsteady Turbomachinery Flows with Multiple Perturba-tions”. AIAA Journal, 30(11), pp. 2730–2735.
[28] He, L., 1990. “An Euler Solution for Unsteady Flows Around Oscillating Blades”. Journal of Turbomachinery, 112(4), pp. 714–722.
[29] Giovannini, M., Marconcini, M., Arnone, A., and Bertini, F., 2014. “Evaluation of Unsteady Computational Fluid Dynamics Models Applied to the Analysis of a Transonic High-Pressure Turbine Stage”. Proceedings of the Institution of Mechanical Engineers, Part A: Journal of Power and Energy, p. 0957650914536170.
[30] Dufour, G., Carbonneau, X., and Garc´ıa Rosa, N., 2013. “Nonlinear Harmonic Simulations of the Unsteady Aerodynamics of a Fan Stage Section at Windmill”. In Turbo Expo Conference, no. GT2013-95485.
[31] Tyler, J. M., and Sofrin, T. G., 1962. “Axial Flow Compressor Noise Studies”. Society of Automo-tive Engineers Transactions, 70, pp. 309–332.
[32] Courtiade, N., Ottavy, X., and Gourdain, N., 2012. “Modal Decomposition for the Analysis of the Rotor-stator Interactions in Multistage Compressors”. Journal of Thermal Science, 21(3), pp. 276– 285.