To cite this version : Mollicone, Jessica and Ansart, Florence and
Lenormand, Pascal and Duployer, Benjamin and Tenailleau,
Christophe and Vicente, Jérôme Characterization and functionalization
by sol–gel route of SiC foams. (2014) Journal of the European Ceramic
Society, vol. 34 (n° 15). pp. 3479-3487. ISSN 0955-2219
To link to this article : doi:
10.1016/j.jeurceramsoc.2014.05.030
URL :
http://dx.doi.org/10.1016/j.jeurceramsoc.2014.05.030
Open Archive TOULOUSE Archive Ouverte (OATAO)
OATAO is an open access repository that collects the work of Toulouse researchers and
makes it freely available over the web where possible.
This is an author-deposited version published in :
http://oatao.univ-toulouse.fr/
Eprints ID : 14113
Any correspondance concerning this service should be sent to the repository
administrator:
[email protected]
Characterization and functionalization by sol–gel route of SiC foams
J. Mollicone
a,∗, F. Ansart
a, P. Lenormand
a, B. Duployer
a, C. Tenailleau
a, J. Vicente
b aCIRIMAT-UMR CNRS 5085, 118 route de Narbonne, 31062 Toulouse cedex 9, FrancebLaboratoire IUSTI, Technopôle de Château-Gombert, 5 rue Enrico Fermi, 13453 Marseille cedex 13, France
Abstract
Ceramic foam materials are commonly used for various applications, including catalyst supports or solar receivers. SiC foams are good candidates for the latter application as solar receivers. Its efficiency is directly related to the geometry, which can be evidenced by X-ray microtomography, and optical properties of the receiver. A promising route to add functionalities with homogenous and adhering oxide coatings onto complex SiC foams in a single step process is proposed. This oxide synthetic process is derived from the Pechini method. Foams are fully impregnated by precursor sols with a controlled viscosity making a thin and totally covering coating.
Keywords:SiC foam; Sol–gel processes; Impregnation; Oxide coatings; X-ray microtomography
1. Introduction
Ceramic foam materials have a large surface area, open-cell porosity, low density, good mechanical strength and good resistance to high temperatures making such porous media commonly used for various applications, including catalyst sup-ports or solar receivers.1 Foams structure, microstructure and morphology characterizations enable to understand and predict the heat transfer phenomena and facilitate the numerical simu-lation of radiative transfer or the numerical generation of foams. Heat transfer properties are not only related to the cell size and porosity, but also to struts geometry and dimension.2,3 A way
to extract statistical information from these foams is to char-acterize them by X-ray microtomography. This non-destructive technique, based on a 3D reconstruction of the sample, allows a precise and quantitative analysis of the foam parameters, which is not easy in traditional 2D analyzes. Pardo-Alonso et al.4use X-ray microtomography to characterize polyurethane foams, extracting quantitative structural information from images of the sample 3D reconstruction. In this work, a more specific quantitative structural analysis of SiC foams is presented,
∗Corresponding author. Tel.: +33 561556534; fax: +33 561556163. E-mail address:[email protected](J. Mollicone).
showing the complex morphology of such substrate and its open porosity.
As said before, foams are usually dedicated to catalysis or solar applications. If these foams are coated, other functional-ities can be brought. For example, Cr2O3is a good candidate
since it has already proven its efficiency as an oxidation barrier onto metallic support.5,6 Indeed, stainless steel oxidation that usually occurs at high temperatures is decreased once coated with Cr2O3. The coating has to be adherent, continuous and
cov-ering in order to insure the complete substrate protection. It also has to support high temperature cyclings without crack forma-tion. A versatile and very promising route to synthesize Cr2O3
is the sol–gel route, following the Pechini method.7A polymer-ization reaction between organic compounds followed by the chelating of metallic cations enables the formation of oxides. It is thus possible to control the sol viscosity and coating microstruc-ture. Coatings made via liquid route, especially sols, are widely used and often prepared by the dip-coating technique.8Our main challenge is to cover the entire foam surface, to keep an open porosity, while preserving the homogeneity and adherence of the coating. This depends on essential parameters such as the sol viscosity and precursors concentrations. Some methods of SiC foam impregnation have already been developed. Vargová et al.9realize a TiO2coating using the dip-coating method but
they need to proceed several times in order to obtain the final
coating. Amrousse et al.10realize an alumina layer on SiC foam using a hydrothermal technique, however the coating is non adherent and presents several cracks. In this study, an easy and fast method is proposed to perform homogenous and adherent oxide coatings. The viscosity is easily controlled by acting on the kinetics of the polymerization reaction. Sols are synthesized and then used to coat several substrates in only one step, even if the substrate has a complex morphology and an uneven and rough topography.
2. Materials and methods
2.1. Commercial ceramic foams
Commercial b-SiC foams (SICAT company, France) with an opened porosity of 15 ppi (pores per inch, which corresponds to a pore diameter of 2.8 mm), and a mean size of 20 mm × 20 mm × 10 mm were used in this study. The specific surface area is about 28 m2g−1. They are manufactured by impregnating a polyurethane template with a precursor slurry which leads to SiC foams after a thermal treatment and carbonization of the template.
2.2. Preparation of the coating and impregnation of foams A route derived from the Pechini’s patent7was used to syn-thesize a precursor sol which leads to the formation of a metallic oxide (Cr2O3in this study) after a suitable heat treatment that
we will discuss later. With this low-cost process it is possible to easily coat various substrates controlling the sol viscosity. Coatings obtained after a heat treatment are also homogenous at a molecular scale and the stoichiometry is totally controlled. Two kinds of starting materials are used: inorganic compounds (metallic nitrates) provide cations and organic compounds (acetylacetone (acac, chelating agent), hexam-ethylenetetramine (HMTA, polymeric precursor)) form a polymeric chain with a homogenous cation distribution in the structural network. The precursor sol is prepared using acetic acid and water as solvents.
Nitrates Cr(NO3)3, 9H2O are dissolved in 5 mL of distilled
water, three concentrations are used in this work: 0.5 M, 1.0 M, 1.5 M. Organic compounds (HMTA and acac) are dissolved in acetic acid with a molar ratio of 1:1. Nitrates and organic com-pounds are then mixed with a ratio of 1:3.1 according to previous work11giving a solution with a final volume of 25 mL. The kinet-ics of the polymerization reaction is increased when heating the mixture during 5 min at 60◦C.
SiC foams were totally immersed into the precursor sol dur-ing few minutes and the excess of sol was removed by an air jet. According to previous works12 the samples were calcined in air at 800◦C during 2 h with a heating rate of 100◦C/h. Since organic compounds are being removed up to 400◦C a slow heat-ing rate is necessary to avoid the formation of cracks in the coating. In parallel, a part of the sol was calcined in the same con-ditions in order to more easily characterize the crystalline phase.
2.3. Characterization techniques
Structure, microstructure and morphology of foams were characterized. Structure was determined by X-ray diffraction using a BRUKER AXS D4 Endeavor diffractometer operating with a Cu-Ka radiation source after sample grinding.
Microstructural information of the SiC foam was obtained by scanning electron microscopy (JEOL JSM–6510LV).
Morphology of the SiC foam was firstly determined with a 3D optical microscope KEYENCE (magnification 20–200×). To obtain statistical information, X-ray computed microtomog-raphy images were obtained with a Phoenix/GE Nanotom 180 instrument using a tungsten target. The acquisition parameters were a voltage of 90 kV and a current of 100 mA, a binning of 1 × 1 and a time of 1000 ms. Data were processed with Datosx reconstruction software in order to obtain 3D images of SiC foams.
Sols and coatings main features were also characterized. The sol viscosity was measured at 21◦C with a shearing viscometer Lamy Rheomat RM 100. Contact angle was measured with a DIGIDROP Fast 60-GBX device. A SiC pellet was used with the same chemical composition as the SiC foam to facilitate the measurement of the angle. Even if the porosity or roughness are different from the pellet to the foam, this method seems to be the more suitable to evaluate the wettability range.
Powders obtained after sol calcination were then charac-terized by X-ray diffraction. The coating microstructure was determined with a scanning electron microscope JEOL 8700F. Thermogravimetric and differential thermal analyzes were car-ried out to determine thermal behavior of foam with and without coatings with a Setaram TGA-DTA 92 instrument up to 1200◦C
at 1◦C/min under air.
3. Results and discussion
3.1. Characterizations of uncoated SiC foams 3.1.1. Chemical composition
Firstly, chemical composition of the SiC foam samples was controlled by Inductively Coupled Plasma (ICP) and an excess of 9% of carbon was measured. Moreover, some impurities were detected such as Fe, Al, Ca or Mn in very low concentrations (less than 500 ppm) compared to Si and C concentrations. The pyrolysis of the polyurethane template during the manufactur-ing process involves this carbon excess while the impurities are probably due to the binder used during the process.
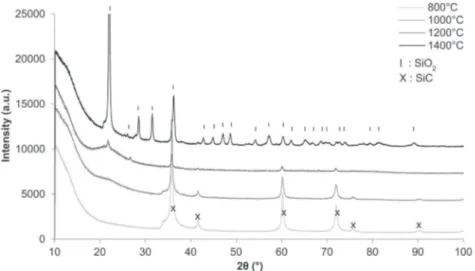
3.1.2. Structural and microstructural characterizations X-ray diffraction patterns were performed on ground SiC foams at room temperature (Fig. 1). Silicon carbide can be found in various polytypes particularly in cubic and hexagonal struc-tures. The SiC was crystallized and the XRD pattern was indexed in the cubic structure with a F-43 m space group and noted 3 C in the Ramsdell notation (JCPDS n◦00-029-1129). The shoul-der observed at 2θ = 33◦corresponds to a stacking fault in the structure.15
Fig. 1. room temperature XRD pattern of ground b-SiC foam.
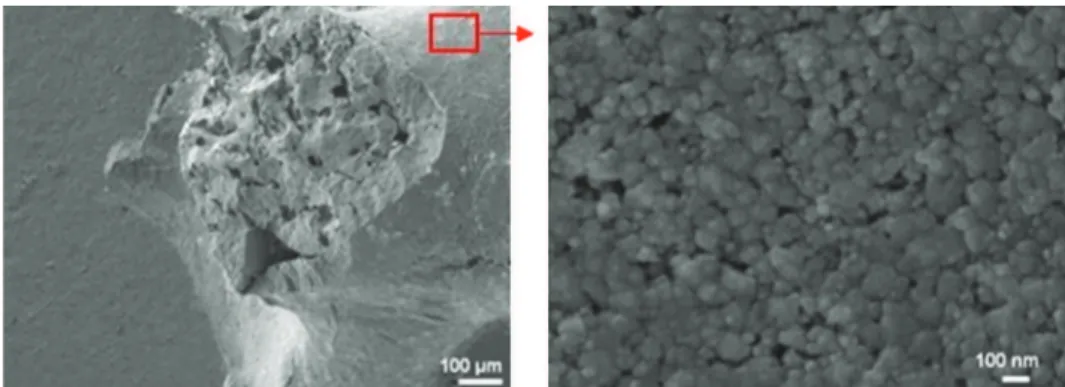
Grain are in the range of 50–100 nm (Fig. 2). An intergranular porosity with a size of 10 nm was also highlighted.
3.1.3. Morphology of foams
3.1.3.1. Implementation of the analysis method. The foam structure mainly depends on the manufacturing process. Porosity is constituted of cells interconnected through throats, which are separated by struts (Fig. 3a). Sample cells have an ellipsoidal shape (Fig. 3b) that can be described by 3 orthogonal axes a, b and c (a > b > c) in a 3D referential O,x,y,z. These three axes have a specific orientation characterized by the elevation angle ϕ and the azimuth angle θ (Fig. 3b). SiC foam throats are described by 2 parameters a′and b′corresponding to the
equiva-lent oval included in the throat (Fig. 3a). Struts have a triangular shape (Fig. 3c)13and inner and outer circles can describe them. In this study, it is of great interest to characterize SiC foam morphology. Indeed, the SiC foam cells network is complex (obstructed pores, oriented cells etc.) so the implementation of a coating process can be a real difficulty on a complex substrate. X-ray microtomography analysis is then a really well suited technique to determine the foam microstructure.
A software (iMorph) was developed by Jérôme Vicente (IUSTI laboratory, France) in order to precisely characterize these foam parameters. The morphology study mainly focused on the poral space analysis. To speed-up the computation time and limit memory allocation, as the original voxel size (14.17 mm) is small enough to capture the porous structure, the
resolution has been reduced by a factor of 2 in every direc-tions in order to obtain a new voxel size of 28.34 mm (a voxel corresponds to a pixel in 3D, resolution of images depends on the voxel size). Finally, a region of interest (ROI) is selected to perform the computation (Fig. 4a). This ROI is chosen to be representative of the macroscopic sample and contains a large number of full cells totally included in the ROI to give good statistical shape description and connectivity statistic. Table 1
reports information about the reconstruction of SiC.
3D morphological filters were previously applied to the images obtained after the acquisition in order to characterize the sample cells, throats and struts and to include in our calcu-lation the connected porosity. In fact, due to the manufacturing process (pyrolysis of a polymeric template), an internal poros-ity is observed (Figs. 3c and 4b) that could be connected to the macroscopic poral space. Filters have been used to eliminate this internal porosity. A first dilation and erosion of the 3D binary images allows to close the holes of the solid surface (Fig. 4c). The second filter based on connected component analysis removes the unconnected pores such as pore cavities enclosed in the struts (Fig. 4d).
Cells and throats can be individualized (represented by a color onFig. 5a and b respectively) using the iMorph program. Cells segmentation is obtained after maximal ball identification and watershed transform.14 Once cells are labeled, their shape and orientation can be determined, as well as their connectivity (number of nearest cells to a considered cell, Fig. 5b). Struts shape can also be evidenced (Fig. 5c) after complex morpho-logical methods. A local shape classification method is used to localize strut centers and orientations, then the intersection of the perpendicular plane passing through the struts center is computed with the surface Mesh.
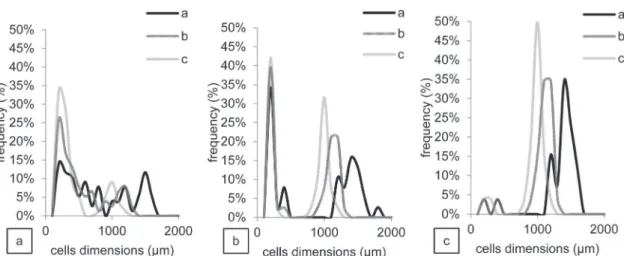
3.1.3.2. Analysis of the results. iMorph program analysis shows that cells are not spherical but have an ellipsoidal shape (Fig. 3b). A filter needs to be applied during image analysis to determine a, b and c axes. SiC foams have actually a closed porosity due to the manufacturing process (pyrolysis of a polyurethane template), which is included in the pores analyses.Fig. 6a shows a too extended distribution of a, b and c representatives of both closed and opened porosities. However, when filters are applied, it is possible to eliminate closed porosity. After application of dilation-erosion filter (closing
Fig. 3. (a) Optical microscopic image of a foam structure, (b) description of ellipsoid cell parameters, (c) cut of a strut on an optical microscopic image.
Fig. 4. iMorph 2D reconstruction of a b-SiC foam (a) reconstructed data and choice of a ROI, (b) untreated ROI, (c) after dilatation and erosion, (d) after dilatation and erosion + removal of the unconnected porosity.
Table 1
parameters about reconstructed samples.
Sample dimensions (voxels) Number of images Filter Voxel size Number of
full cells SiC foam after reconstruction with
Datosx software
1976 × 1944 876 – 14.17 mm –
SiC foam after reconstruction with iMorph program
988 × 972 876 – 28.34 mm 147
ROI in reconstructed images 438 × 378 225 Dilatation-erosion, keep the
biggest poral phase
28.34 mm 26
voids, Fig. 4c), the size distribution is smoothed (Fig. 6b), after elimination of unconnected porosity (Fig. 4d), the three orientation parameters can be thus determined (Fig. 6c).
The mean value of a, b and c parameters defining the cells shape are reported inTable 2. Vectors, respectively associated to these axes, have particular orientations characterized by the
elevation ϕ and the azimuth θ (Figs. 3b and 7). a vector ele-vation is constant (about 30◦,Fig. 7a) whereas b vector have a bimodal distribution: almost horizontal (13◦) and close to 60◦. c vector follow the same tendency with a bimodal dis-tribution but values are different between b and c showing that the O, b, c plane is not parallel to the O, x, y plane.14
Fig. 5. (a) Segmentation of each cell on a 2D view, (b) segmentation of each throat and connectivity calculation on a 3D view, (c) strut size calculations on a 3D view. (For interpretation of the references to color in the text, the reader is referred to the web version of this article.)
Fig. 6. (a–c) Size distributions of cells (a) with original images, (b) after application of a dilatation-erosion filter, (c) after application of a dilatation-erosion filter and elimination of unconnected porosity.
Fig. 7. (a) Elevation ϕ of a, b, c vectors; (b) azimuth θ of a, b, c vectors.
The bimodal characteristic of b and c elevation values can be related to the closed values of b and c dimensions (respec-tively 1.10 and 1.00 mm) meaning that b and c can be mixed up. Fig. 7b shows azimuth values, each of the 3 vectors is oriented through a main direction (270◦, 180◦, 45◦ respec-tively) signifying to an ordered organization of cells into the SiC foams.
SiC foam throats are characterized by 2 parameters a′ and b′. Mean values of a′and b′are reported inTable 2. Struts are described by inner and outer circles (seeTable 2).
The threshold used to separate the pore from the solid phase is obviously crucial to determine accurate porosity. Due to the relative good absorption difference between a void and the SiC material the threshold choice for the binarization process only
impact a few voxels near the interface. We can then afford that the porosity error is depending on the apparent surface of the sample. The total porosity determined by iMorph calculation is about 81%. Nevertheless a 91% porosity was also determined by the weight on volume ratio and compared to the theoretical density. The difference between tomographic and macroscopic values is also related to the detection limit of the device. Micro-porosity under voxel resolution (28.34 mm) cannot be detected. For other macroscopic parameters such as strut, cell or throat size the error is also dependent on the interface position but is finally bellow about 2 voxel sizes (<60 mm).
Also different connectivities between cells were evidenced (Table 3). SiC foams can be associated to a tetrakaidecahedron structure corresponding to a connectivity of 14 but some throats
Table 2
results of SiC foam characterization (mean values and standard deviations).
Sample Cell dimensions a, b, c
(equivalent ellipsoid)
Throats dimensions a′, b′ Distance between
2 cells
Porosity [%] Struts diameters
SiC foam ROI 1.40 ± 0.25 mm
× 1.10 ± 0.18 mm × 1.00 ± 0.17 mm 0.75 ± 0.25 mm × 0.50 ± 0.17 mm 2.20 mm 81 Outer: 0.33 ± 0.09 mm Inner: 0.28 ± 0.10 mm
Table 3
connectivity values between cells.
Connectivity value 0 1 2 3 4 5 6 7 8 9 10 11 12 13 14
Frequency (%) 0 2 1 3 2 5 7 7 16 15 15 15 7 5 1
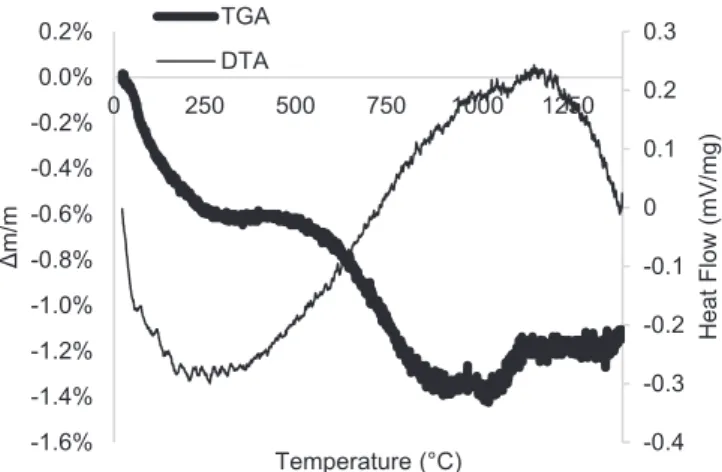
Fig. 8. TG-DT analyzes curves of SiC foams from room temperature to 1400◦C
under air (heating rate 300◦C/h).
are totally obstructed forming a membrane of SiC and isolating the cells from its nearest cells.1699% of the cells have at least one obstructed throat, making a new difficulty to coat homogenously these foams. Membranes can then create a concentrated area of sols during the impregnation of the precursor sol.
X-ray microtomography analysis is very well suited to char-acterize SiC foams. It is obvious that these samples have a very complex morphology (oriented cells, closed porosity, closed throat etc.) that can vary from one sample to another. So, coating of these materials via liquid route (compared to directional dry routes) seems thus the best method in this case.
3.1.4. Thermal behavior of uncoated foams
The first step is to evaluate the thermal resistance of these ceramic foams because of their further application. Thermo-gravimetric (TG) and differential thermal (TD) analyzes (Fig. 8) show a first weight loss (9%) associated to an exothermic phe-nomenon between 485◦C and 700◦C corresponding to the
removal of carbon excess (also found by ICP analyzes). From this result a thermal treatment at 600◦C was carried out on
samples in order to eliminate carbon excess.
From 700◦C to 1400◦C, a weight gain of 30% was observed, associated to a second exothermic phenomenon. SiC is known to possess a thin protective layer of an amorphous SiOxCyoxide
on its surface17; this layer grows and evolves into SiO2during
the passive oxidation of SiC.18 XRD analysis of ground SiC foam after different heat treatments enables to identify the dif-ferent steps of oxidation (Fig. 9). After 800◦C an amorphous layer of SiO2is forming (at 22◦in 2-Theta a bump and a main
peak appear upon heating corresponding to an amorphous phase) which is totally crystallized into cristobalite at 1400◦C. The
XRD pattern was indexed in the tetragonal structure with a P41212 space group (JCPDS n◦01-082-0512). To upgrade the
thermal properties, a protective layer can be deposited to slow down oxidation kinetics of SiC foams acting like a thermal diffusion barrier.
3.2. Preparation and characterization of coated foams 3.2.1. Synthesis of sols and impregnation of foams
To check the feasibility of oxide impregnation into these foams, the Cr2O3oxide has been chosen. Indeed, it presents
sev-eral potential applications such as optical, thermal or mechanical applications. In order to facilitate characterization of the syn-thesized oxide, oxide powders issued from the sol calcination were characterized using the XRD technique (Fig. 10). The phase corresponds to the eskolaite Cr2O3phase indexed in the
rhomboedral structure with a R-3c space group (JCPDS n◦
01-072-3533).
Three concentrations of nitrates (Cr(NO3), 9H2O, 0.5 M;
1.0 M; 1.5 M) were used in order to determine the most favorable
Fig. 10. room temperature XRD pattern of the powder obtained from the calci-nation sol (800◦C in air) and corresponding to Cr
2O3phase.
Table 4
viscosity and angle contact values of Cr2O3precursor sols.
Nitrates concentrations 0.5 M 1.0 M 1.5 M
Viscosity (mPa s) 15 65 80
Contact angle 17◦ 30◦ 50◦
to cover the foam. The ratio “organic compounds concentration [HMTA + acac]”/”metallic nitrate salt concentration” was kept equal to 3.1 according to previous optimized conditions.11
After 5 min of heat treatment at 60◦C the viscosity increased from 15 to 80 mPa s (Table 4). The contact angle of each sol was measured (Table 4) and this angle is always lower than 90◦ meaning that the sol has a good wettability on this sub-strate. Wettability increases when the viscosity of sols decreases.
Surface energy increases with the organic concentration increase leading to the increase of the contact angle value. A compromise between wettability and viscosity has to be chosen because a too fluid sol cannot bring enough inorganic matter in the coating but a high wettability is necessary to obtain a homogenous coating.
Fig. 11shows coatings made on SiC foams after the impregna-tion and calcinaimpregna-tion of the precursor sols at 800◦C during 2 h. These are not totally covering the surface and exhibit a sheet structure which is not totally adhering. This can be due to the uneven surface of SiC foams. So, a plasticizer was added to the sol to improve this coating (polyethylene glycol, PEG 35000). Its long carbon chains are expected to accommodate topographic stresses during impregnation and thermal treatment, bringing flexibility to the coating.
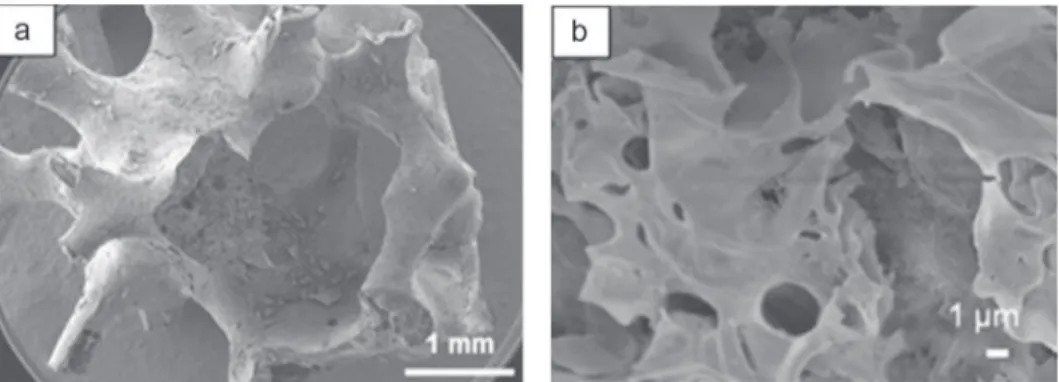
To promote a better coverage, polyethylene glycol (PEG) was used as a plasticizer. Covering coatings were achieved with a minimal concentration of nitrates equal to 1.5 M (Fig. 12a and b) despite of a high contact angle of 87◦ and a high viscos-ity of 220 mPa s of the sol. When concentrations are lower, the amount of synthesized oxide is not enough to cover the whole foam surface. This can be due to the lower viscosity of the sol and also to the lower concentration in nitrates. Fig. 12c shows a coating thickness of 800 nm and spherical grains are obtained with a monodisperse size distribution (about 100 nm). This method of synthesis and impregnation is very well suited to obtain a homogenous and adhering coating of Cr2O3in spite
of the complex topography of such porous SiC substrates. 3.2.2. Thermal behavior of the coated foam
The influence of the protective effect of the coating onto SiC substrates was determined by thermogravimetric (TG) and
Fig. 11. Cr2O3coatings made with a nitrate concentration of 1.0 M (a) view of the coated foam, (b) sheet structure of the coating.
Fig. 12. Cr2O3coatings made with a nitrate concentration of 1.5 M and a plasticizer (PEG 35000) (a) view of the coated foam, (b) view of the homogenous coating,
Fig. 13. uncoated and coated SiC after (a) TG and (b) DT analyzes.
differential thermal (DT) analyzes. The oxidation resistance of coated samples was compared to uncoated ones (Fig. 13). The TG analyzes curves show a lower weight gain after 900◦C for coated SiC (Fig. 13a), at 1200◦C the difference reaches about 3.50 ± 0.02% between the uncoated and the coated SiC. This decrease of gain weight means a decrease of SiC oxidation. In order to ensure that Cr2O3does not volatilize into gaseous
CrO3, TG and DT analyzes were performed to 1400◦C under air
(Fig. 14). Results show that the Cr2O3is stable at high
tempera-ture meaning the 3% decrease is due to the oxidation protection. The exothermic phenomenon observed on the differential thermal analysis between 600◦C and 1200◦C can be separated
in two oxidation phenomena (Fig. 13b): a first one at 950◦C
corresponding to the formation of a reaction intermediate (SiOxCy)17 and a second one at 1065◦C corresponding to the
formation of crystallized SiO2. When SiC is coated (Fig. 13b),
Cr2O3acts as a barrier to the oxygen diffusion annihilating the
formation of the intermediate reaction. Crystallized SiO2is thus
directly formed. Moreover, area surface of these exothermic peaks are directly linked to the oxidation enthalpy. When SiC is coated, the enthalpy decreases by 12%, associated with a decrease in SiC oxidation. So, even if Cr2O3 coating is very
Fig. 14. TG-DT analyzes curves of Cr2O3powder from room temperature to
1400◦C under air (heating rate 300◦C/h).
thin, it slows down the SiC oxidation and acts as a protective layer against oxidation of SiC foam by blocking the oxygen diffusion. Moreover, if the heating rate is sped up (10◦C/min instead of 1◦C/min as presented here), the same phenomena are observed. Compared to other works5,6which use coatings of a few microns thick, Cr2O3coatings made via this sol gel route are
thinner (below 1 mm). These coatings are thus very promising and efficient and thicker coatings might even be more effective.
4. Conclusions
The first characteristic to point out is the complex shape of the foams at both levels: macroscopic and microscopic. That is why, SiC foams microstructure was characterized in details in particular the sample morphology was highlighted through X-ray microtomography analysis. Foams consist of cells connected by throats and separated by struts. Cells have an ellipsoidal shape which can be oriented depending on the manufacturing process. In our case they are manufactured by impregnating a polyurethane template with a slurry precursor that leads to a SiC foam after thermal treatment. This process is also responsible for the closed and the intergranular porosities and the closed throats observed. This typical morphology was the main difficulty to consider for the implementation of the coating process.
Another aspect is the SiC behavior at high temperature. In air, it was shown that SiC oxidation starts at 700◦C and a layer
of SiOxCygrows upon heating and a crystallized phase of SiO2
appeared at 1400◦C.
Furthermore, the key point here is that we proved the fea-sibility of the functionalization of such foams by a “model” oxide using sol–gel route. One of the main interests of this route is its ability to process various oxides according to the targeted application. Considering the morphology of the sub-strate and the uneven surface, the main result was to succeed in the cover of the whole foam without blocking pores. The Pechini method enabled to realize a promising coating which exhibited the protective properties of a thermal barrier. This method is fast, versatile and cost effective. The next step of this work will be to process thicker Cr2O3 coatings using loaded sols (with
various powder charges) in order to determine the best com-promise between barrier efficiency and preservation of the open porosity.
Acknowledgement
The French National Research Agency is gratefully acknowl-edged for its financial support in the framework of “Optisol” national project.
References
1. Fend T, Hoffschmidt B, Pitz-Paal R, Reutter O, Rietbrock P. Porous materials as open volumetric solar receivers: experimental determination of thermo-physical and heat transfer properties. Energy 2004;29:823–33.
2. Wu Z, Caliot C, Bai F, Flamant G, Wang Z, Zhang J, et al. Experimental and numerical studies of the pressure drop in ceramic foams for volumetric solar receiver applications. Appl Energy 2010;87:504–13.
3. Rousseau B, Thovert J-F, Echegut P, De Sousa Meneses D. Textural param-eters influencing the radiative properties of a semitransparent porous media.
Int J Therm Sci2011;50:178–86.
4. Pardo-Alonso S, Solórzano E, Brabant L, Vanderniepen P, Dierick M, Van Hoorebeke L, et al. 3D Analysis of the progressive modification of the cellular architecture in polyurethane nanocomposite foams via X-ray micro-tomography. Eur Polym J 2013;49:999–1006.
5. Hampikian JM, Carter WB. The combustion chemical vapor deposition of high temperature materials. Mater Sci Eng A 1999;267:7–18.
6. ˇCern´y F, Pitter J, Konviˇcková S, Jech V. High temperature oxidation pro-tective chromium-based coatings prepared by IBAD and PACVD methods.
Surf Coatings Technol2009;203:2566–70.
7. Pechini M. Method of preparing lead and alkaline earth titanates and niobates and coating method using the same to form a capacitor. Patent US 3,330, 697, 1967.
8. Gaudon M, Laberty-Robert C, Ansart F, Stevens P. Thick YSZ films prepared via a modified sol–gel route: thickness control (8–80 mm). J Eur Ceram Soc 2006;26:3153–60.
9. Vargová M, Plesch G, Vogt UF, Zahoran M, Gorbár M, Jesenák K. TiO2
thick films supported on reticulated macroporous Al2O3foams and their
photoactivity in phenol mineralization. Appl Surf Sci 2011;257:4678–84. 10. Amrousse R, Choklati A, Lizoul B, Bachar A, Follet-Houttemane C, Hori
K. Deposition of mesoporous activated powder alumina on SiC ceramic foam substrates by an in-situ hydrothermal technique. Powder Technol 2013;247:231–4.
11. Lenormand P, Castillo S, Gonzalez J, Laberty-robert C, Ansart F. Lan-thanum ferromanganites thin films by sol–gel process. Influence of the organic/inorganic R ratio on the microstructural properties. Solid State Sci 2005;7:159–63.
12. Fontaine M, Laberty-robert C, Barnabé A, Ansart F, Tailhades P. Synthesis of La(2−x)NiO(4+δ)oxides by polymeric route: non-stoichoimetry control. Ceram Int2004;30:2087–98.
13. Edouard D, Schweich D, Huu TT, Pham Huu C, Lacroix M. Towards a more realistic modeling of solid foam: use of the pentagonal dodecahedron geometry. Chem Eng Sci 2009;64:5131–42.
14. Vicente J, Topin F, Daurelle J. Open celled material structural proper-ties measurement: from morphology to transport properproper-ties. Mater Trans 2006;47:2195–202.
15. Nguyen P, Pham C. Innovative porous SiC-based materials: from nanoscopic understandings to tunable carriers serving catalytic needs. Appl Catal A Gen 2011;391:443–54.
16. Zeiser T, Schwieger W, Freund H, Inayat A. Determining the specific surface area of ceramic foams: the tetrakaidecahedra model revisited. Chem Eng Sci 2011;66:1179–88.
17. Kouame NA, Robert D, Keller V, Keller N, Pham C, Nguyen P. Preliminary study of the use of beta-SiC foam as a photocatalytic support for water treatment. Catal Today 2011;161:3–7.
18. Honstein G, Chatillon C, Baillet F. Thermodynamic approach to the vapor-ization and growth phenomena of SiC ceramics. II. The SiC surface under oxidative conditions. J Eur Ceram Soc 2012;32:1137–47.