Evaluation of the Effectiveness of a Cover with Capillary Barrier Effect to Control Percolation into a Waste Disposal Facility
Amir M. Abdolahzadeh1, Benoit Lacroix Vachon1 and Alexandre R. Cabral1,*
Paper submitted to the Canadian Geotechnical Journal
1 Department of Civil Engineering, Université de Sherbrooke, QC, Canada
* Corresponding Author:
Department of Civil Engineering, Faculty of Engineering, Université de Sherbrooke. 2500, boul. de l’Université, Sherbrooke, QC, Canada, J1K 2R1
Tel.: 819-821-7906
Abdolahzadeh, A.M., Lacroix Vachon, B. and Cabral, A.R. (2011). Evaluation of the Effectiveness of a Cover with Capillary Barrier Effect to Control Infiltration into a Waste Disposal Facility. Canadian Geot. J., 48 (7): 996-1009. doi:10.1139/T11-017
Evaluation of the Effectiveness of a Cover with Capillary Barrier Effect to Control Percolation into a Waste Disposal Facility
Amir M. Abdolahzadeh,Benoit Lacroix Vachon and Alexandre R. Cabral
Abstract: The goal of an instrumented experimental plot constructed on the Saint-Tite-des-Caps landfill site was to evaluate the field behaviour and the performance of a cover with capillary barrier effect (CCBE) to control water percolation. The CCBE consists of a layer of deinking by-products (DBP) on top of layer of sand overlying a gravel layer. The DBP layer acts as a hydraulic barrier to control the rate of seepage that can reach the top of the capillary barrier. Analysis of the field data shows that the hydraulic barrier consisting of DBP remained nearly saturated and controlled percolation to the desired level. In addition, for the first year of monitoring, the diversion length determined from field data was very similar to that estimated by the analytical solution that was used for the design of the experimental plot. Afterwards, the diversion length increased due to a decrease in the rate of seepage caused by settlement of the hydraulic barrier, which caused a decrease in its saturated hydraulic conductivity. At all times, the flows that reached the gravel layer at the toe of the experimental CCBE were, for all practical purposes, lower than the maximum seepage rates required by the most restrictive landfill regulations.
Évaluation de l’efficacité d’une couverture avec effet de barrière capillaire comme moyen de contrôler les infiltrations dans un site d’enfouissement
Amir M. Abdolahzadeh,Benoit Lacroix Vachon and Alexandre R. Cabral
Résumé : Une parcelle expérimentale instrumentée construite sur le site d’enfouissement de Saint-Tite-des-Caps avait pour but d’évaluer le comportement et l’efficacité d’une couverture avec effet de barrière capillaire (CEBC) pour contrôler les infiltrations. La CEBC est constituée d’une couche de gravier au dessus de laquelle se trouve une couche de sable. Au dessus de cette barrière capillaire, on a installé une couche de sous-produits de désencrage (DBP), qui agit comme barrière hydraulique pour le contrôle des infiltrations atteignant le sommet de la CEBC. L’analyse des données de terrain montre que la barrière hydraulique demeure près de la saturation et contrôle les infiltrations, tel que prévu. De plus, pendant la première année de suivi, la longueur de transfert était très semblable à celle estimée par solution analytique, qui a été utilisé pour la conception du recouvrement alternatif. Par la suite, la longueur de transfert a augmenté en raison d’une baisse du taux de percolation causé par la consolidation de la couche de DBP, ce qui a entrainé la diminution de sa conductivité hydraulique. En tout temps, le débit qui atteint le gravier à l’extrémité aval de la CCBE est inférieur aux limites les plus restrictives pour les sites d’enfouissement.
INTRODUCTION
In order to limit water seepage, thereby excess leachate generation, a final cover system including a low hydraulic conductivity layer must be installed. In several regulatory texts throughout the world, a door is left open for the use of alternative covers, with the condition that they perform as well as or better than the systems imposed.
One possible alternative system consists of the installation of a cover with capillary barrier effect, CCBE (Kämpf and Montenegro 1997; von Der Hude and Huppert 1998; Barth and Wohnlich 1999; von Der Hude et al. 1999; Aubertin and Bussiere 2001; Bussière et al. 2003a; Wawra and Holfelder 2003; Berger et al. 2005). A capillary barrier effect can be formed when a fine-grained material, such as sand, overlies a layer of coarser material, such as gravel. The textural contrast between the Moisture Retaining Layer (MRL; the upper layer) and the Capillary Break Layer (CBL; the bottom layer) controls vertical percolation through the capillary barrier interface by capillary forces. The technical literature shows that the superposition of relatively coarse materials may also form efficient capillary barriers (e.g. Stormont 1996; Kämpf et al. 1999; Stormont and Anderson 1999; von Der Hude et al. 1999; Yang et al. 2004; Parent 2006). However, such capillary barriers formed by the superposition of two relatively coarse materials cannot remain effective if the percolation levels are not maintained low. In other words, the capillary barrier effect may be lost easily, particularly during intense and/or continual periods of precipitation. In such cases, the quantities percolated may not meet performance criteria, or – at a minimum – typical equivalence criteria, where applicable.
To ensure the technical viability of the use of an inclined CCBE made up of coarse materials, a percolation control barrier (hydraulic barrier) may be added on top of the layers
low seepage rate must be used so that the capillary barrier is always able to drain percolation laterally in an effective manner. In addition, this material must be available close to the site or imported at a competitive cost.
Deinking by-product (DBP) is one example of material that can be used for this purpose. DBP is a by-product from the first step of paper recycling that can have low saturated hydraulic conductivity when properly installed (Robart 1998; Burnotte et al. 2000; Planchet 2001; Bédard 2005; Parent 2006). DBP has already been used as alternative cover material for municipal landfill sites (e.g. Moo-Young and Zimmie 1996; Burnotte et al. 2000; Kamon et al. 2001) and as an oxygen barrier for acid mine drainage prevention (Cabral et al. 2000; Cabral et al. 2004a).
The goal of this paper is to evaluate the effectiveness and field behaviour of the alternative cover of Saint-Tite-des-Caps, Quebec, Canada, to control water percolation into the waste mass. This cover with capillary barrier effect (CCBE) consists of a 0.6-m thick DBP layer acting as a hydraulic barrier, combined with a capillary barrier consisting of a 0.4-m thick sand layer overlying a 0.2-m thick gravel layer. This paper deals with the main effectiveness parameter of this CCBE, i.e. the diversion length (DL). The latter is the distance that the CCBE is capable of laterally diverting water, thereby reducing the amount of seepage that reaches the waste mass.
The experimental plot was constructed using the design procedure proposed by Parent and Cabral (2006). This procedure is based on the Ross analytical solution, which requires a constant infiltration rate. The scenario considered steady-state flow under constant infiltration applied at the top of the capillary barrier. The rate chosen for the design was the saturated hydraulic conductivity of the DBP layer. This is the maximum percolation rate possible, thus the worst-case scenario. In the present case, all design parameters and materials were selected in
such a way that the DL would be less than 30.0 meters, i.e. the length of the experimental plot. The design DL was 24.0 m. This study verified the reliability of the design procedure proposed by Parent and Cabral (2006). The analysis of the large-scale field data showed that despite the transient behaviour of the CCBE, steady state analytical solutions may constitute a powerful engineering design tool, when adequately applied.
BACKGROUND
Cover with capillary barrier effect (CCBE)
The hydraulic conductivity contrast between the MRL and the CBL creates a capillary break that is only lost when suction at the interface approaches the water entry value (WEV) of the CBL. On the water retention curve, the WEV is the suction at which the CBL approaches the residual water content θr (e.g. Nicholson et al. 1989; Morel-Seytoux 1993; e.g. Warrick et al.
1997; Morris and Stormont 1999; Khire et al. 2000; etc.). When a sloping capillary barrier is subjected to seepage, the MRL will tend to drain water downstream. At a certain location (or rather zone - due to the progressive water breakthrough), when the WEV of the coarser material is attained, vertical drainage into the CBL starts to be significant (e.g. Morel-Seytoux 1994; Bussière et al. 2003a; Parent and Cabral 2006). The horizontal distance between the top of the capillary barrier and this location (or zone) is called the diversion length (DL).
Evaluation of the diversion length (DL)
Various equations can be used to evaluate DL, such as those proposed by Ross (1990), Steenhuis et al. (1991), Morel-Seytoux (1994), Warrick et al. (1997), and Walter et al. (2000). The Ross model (1990) can be described by equation [1]:
[1]
q d k k q Q DL MRL CBL r sat
tan maxwhere the term ksat represents the saturated hydraulic conductivity of the soil, kr is the relative
hydraulic conductivity (k/ksat), is the slope, q is the seepage flow rate, ψMRL and ψCBL
respectively are the suction values corresponding to q in the fine-grained and coarse-grained materials. The hypotheses considered for the application of the DL calculated according to Eq. 1 are that the upper and lower boundaries of the model must be assumed to be far from each other, the bottom of the slope must be assumed to be well-drained and quite far from the top of the slope and, there is no horizontal flow at the top of the slope.
The Saint-Tite-des-Caps experimental plot was designed based on the Ross analytical solution. The scenario considered in the design procedure was steady-state flow during constant infiltration applied uniformly at the top of the sand-gravel capillary barrier system. This scenario is admittedly simple yet reasonable because of the placement of the hydraulic barrier (e.g. the DBP layer shown in Fig.1) on the top of a capillary barrier (e.g. the sand-gravel layers shown in Fig.1). The hydraulic barrier is expected to control and regulate the water percolation reaching the capillary barrier system. As far as control is concerned, the maximum seepage rate into the MRL layer (e.g. sand in Fig.1) is limited by the ksat of the hydraulic barrier. This constitutes the
worst-case upper boundary condition applied to the top of the capillary barrier system. As far as regulated seepage rate is concerned, most of the time, the degree of saturation of the hydraulic barrier layer is expected to be very high along its interface with the MRL. Parent and Cabral (2006) performed numerical simulations to calculate the diversion length for the capillary barrier between the DBP layer and the sand layer. Their results led to a relatively short DL, indicating that the DBP layer acts more as a hydraulic barrier.
According to Bussière et al. (2007), the Morel-Seytoux equation (1994) is more general and representative of realistic conditions than the Ross model (1990). To arrive at these conclusions, numerical simulations of capillary barriers with variable contour conditions were performed (Bussière et al. 1995; Aubertin et al. 1996; Bussière et al. 2000; Bussière et al. 2003b; Bussière et al. 2003a; Aubertin et al. 2006; Cifuentes et al. 2006; Zhan et al. 2006), as well as laboratory experiments (e.g. Bussière et al. 1998) and field work (Bussière 1999; Zhan et al. 2001; Zhan et al. 2006). These studies showed that the properties of the sloped CCBEs are intrinsically dynamic, i.e. DL is not a constant, but varies over time (Bussière et al. 2007), according to local climatic conditions, geometry, configuration and properties of the materials (Bussière et al. 2003b; Cifuentes et al. 2006). According to Bussière et al. (2007), monitoring percolation through the sloped cover over a long period of time, or over a very short period of time with extreme climatic events, is necessary.
However, based on data presented by Bussière et al. (2007), for gentle slopes such as the slope analyzed in this study (5%), the differences between the DL values obtained by Ross (1990) and by Morel-Seytoux (1994) are not significant. In addition, the DL values given by Ross (1990) are conservative compared to those obtained with Morel-Seytoux’s (1994) solution. Despite the concerns expressed by Bussière et al. (2007) about the risk of oversimplifying the design of CCBEs by using analytical solutions for actual designs, the application of steady state conditions, combined with conservative boundary conditions, allow practising engineers to make reasonable predictions based on simple tools. For all practical purposes, the Ross (1990) solution can constitute a practical design tool for the preliminary design stage of a capillary barrier, when a hydraulic barrier overlies a capillary barrier system.
The Ross (1990) model is binary, i.e. assumes that percolation into the CBL occurs only once the DL is reached; before this point the MRL drains all the water. This is not a realistic representation; in fact, percolation into the CBL progressively increases along the MRL/CBL interface, to asymptotically reach the percolation rate value at the top of the MRL (Bussière 1999; Parent and Cabral 2006). Parent and Cabral (2006) have proposed an empirical equation to quantify percolation into the CBL that can be used as a substitute for the Ross (1990) model.
THE ALTERNATIVE COVER Location and composition of the cover
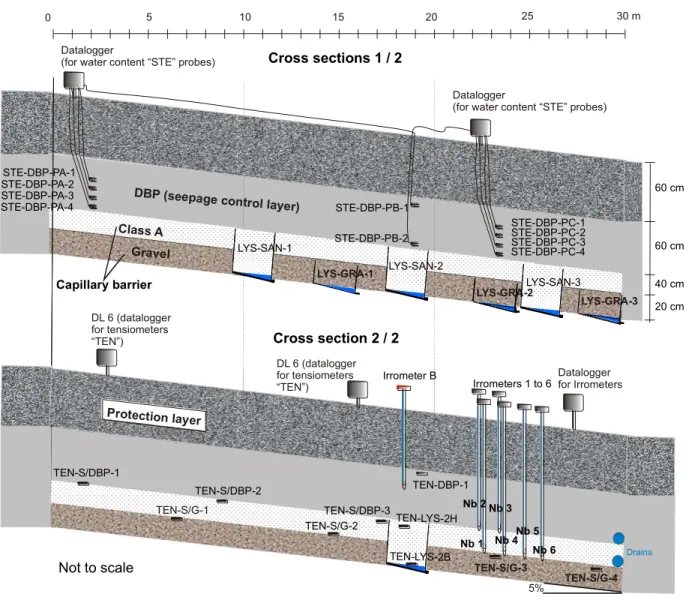
Fig. 1 shows the longitudinal profile of the experimental cover installed at the Saint-Tite-des-Caps site, which is 10 m wide and 30 m long. The upper layer, made up of random-fill, protects the lower layers and is required by Quebec landfill regulations. The underlying layer consists of DBP (0.6 m) and forms the hydraulic barrier (or seepage control barrier). The capillary barrier is made up of a layer of sand (0.4 m) superposed on a layer of gravel (0.2 m).
One might be tempted to consider that the system is composed of a double CCBE, with a capillary break being formed at the interface between the DBP and sand layers. However, as previously explained, Parent and Cabral (2006) showed that the value of the DL of such a system is approximately 2.5 m for a seepage rate similar to the one considered in this study. This is due to the poor drainage capacity of DBP.
Hydraulic properties of the materials studied
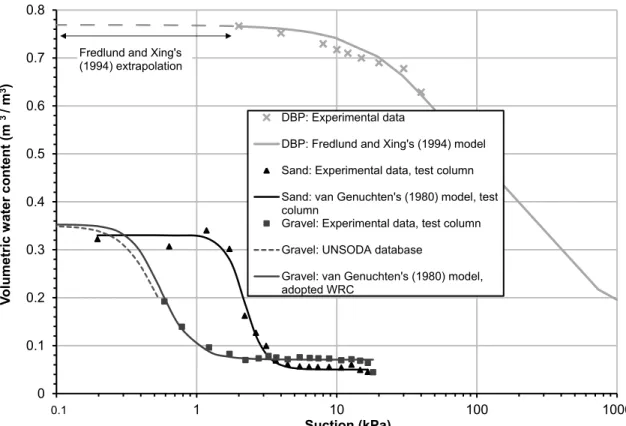
The water retention curve (WRC) of DBP (whose Gs = 2.0) was obtained using a pressure
et al. 2004; Parent et al. 2007). The experimental results and a fitting curve using the Fredlund and Xing (1994) model are presented in Fig. 2. The corresponding Fredlund and Xing (1994) parameters and the saturated volumetric water content (s) value for DBP are presented in Table
1. As indicated in Fig. 2, since the material is highly compressible, the initial portion of the WRC (suction between 0.1~10 kPa) should not be flat, because, when the soil is fully saturated, the volumetric water content changes as suction changes. However, in the present case, the Fredlund and Xing (1994) model was adopted; when extrapolated to low suction ranges (<0.1 kPa), this model yielded the flattened shape observed (see Fredlund and Xing’s extrapolation zone in Fig. 2).
The WRCs of the sand (Gs=2.65) and gravel (Gs=2.65) were obtained by means of
drainage columns (Lacroix Vachon 2008). The van Genuchten model (1980) was selected as the regression model for the sand and gravel (Fig. 2). The corresponding van Genuchten parameters and the saturated volumetric water content (s) and residual volumetric water content (r) values
are presented in Table 1. The saturated volumetric water content values (s) were considered
equal to the porosities (n) of the materials. Two tests were conducted for sand and provided very similar results. Only one of the results is presented in Fig. 2. The sample underwent 72-hour drainage. Only one drainage column test was carried out for the gravel; the material was left to drain for 48 h (Fig. 2). In the case of the gravel, with the selected test methodologies, obtaining values for very low suction levels was not possible. The UNSODA (USDA 1999) databank was therefore consulted for the low suction value range. Fig. 2 shows that these values fit well with the WRC derived from experimental results. Table 1 also presents the air entry values (AEV) and water entry values (WEV) of the different materials employed. These values were determined using the Brooks and Corey (1964) graphical method.
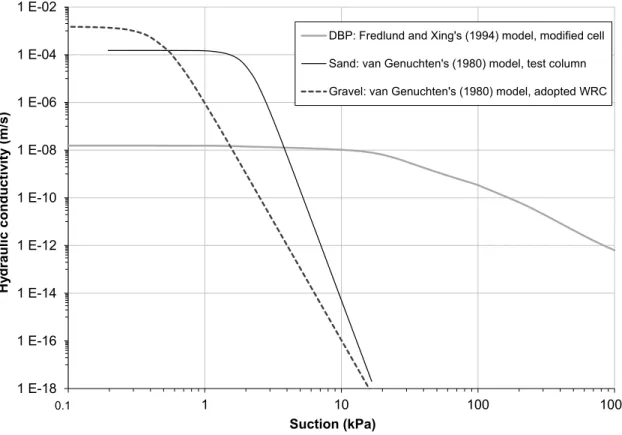
Using the WRCs obtained experimentally, the unsaturated hydraulic conductivity functions (k-fct) were obtained using the Mualem (1976) formulation, based on the model proposed by van Genuchten (1980). The k-fcts of materials are presented in Fig. 3 with the van Genuchten corresponding parameters.
In the present study, the effect of hysteresis of the WRC was not considered; only the drying curve was used. While it can be important for fine sands, an investigation performed by Maqsoud et al. (2004) showed that for coarse-grained materials, this effect can be considered much less important. Zhang et al. (2009) showed that pore water pressure distributions in modeled capillary barriers, as well as the modeled timing of diversion length (DL) occurrences are influenced by whether or not hysteresis of WRC is considered.
The saturated hydraulic conductivity (ksat) of DBP is equal to 1.0 x 10⁻⁸ m/s, as obtained
by Bédard (2005), Burnotte et al. (2000) and Planchet (2001). The saturated hydraulic conductivity of the sand, 1.5 x 10⁻⁴ m/s, was estimated using the Hazen (1911) formula, with a
cross-check using the neural network in the RETC code (van Genuchten et al. 1991). For the gravel, the ksat (1.5 x 10⁻³ m/s) was also estimated with the Hazen (1911) formula, with a
cross-check using the Chapuis (2004) method. The ksat values are presented in Table 1.
Alternative cover instrumentation
Fig. 1 shows the instrumentation installed in the Saint-Tite-des-Caps alternative cover. Six lysimeters with a horizontal surface of 0.85 m² were placed in the cover system making it possible to confirm if the DL of the capillary barrier was reached as designed. The first three lysimeters were placed in the sand layer (LYS-SAB-1 to LYS-SAB-3) to quantify the flows reaching the sand-gravel capillary barrier. To evaluate percolation reaching the waste mass, the other three lysimeters (LYS-GRA-1 to LYS-GRA-3) were installed in the gravel layer. Water
accumulated in each of the lysimeters drained by gravity towards a reservoir that was frequently emptied. The lysimeters were filled with the same material as the surrounding soil; and the placement density was the same outside and inside.
In order to verify the reliability of the lysimeters, two tensiometers (TEN-LYS-2H and TEN S-DBP/3 as shown in Fig. 1) were installed at LYS-SAB-2, at the same level; one at the top-center of the lysimeter, and the other just outside of its rim. According to Lacroix Vachon et al. (2007), who analyzed data for 2006 and 2007, the lysimeters can be considered reliable for measuring percolation, because no lateral hydraulic gradient was observed, which could have caused water to be diverted from or drained into the lysimeters. Abdolahzadeh et al. (2008) conducted an additional analysis of various parameters that could affect proper functioning of the lysimeters and also concluded that, according to the initial conditions considered for their design, they are functional and respond according to design.
Tensiometers were installed along the DBP-sand interface and along the sand-gravel interface (Fig. 1) to study the hydraulic behaviour of the hydraulic barrier and capillary barrier. T4 (UMS GmbH) and Irrometer (Irrometer Co.) tensiometers were used. Except for one of the Irrometer tensiometers, the instruments were connected to dataloggers. To follow the evolution of the suction values of the hydraulic barrier, two tensiometers (DBP-1 and Irrometer B) were installed in the DBP layer (Fig. 1).
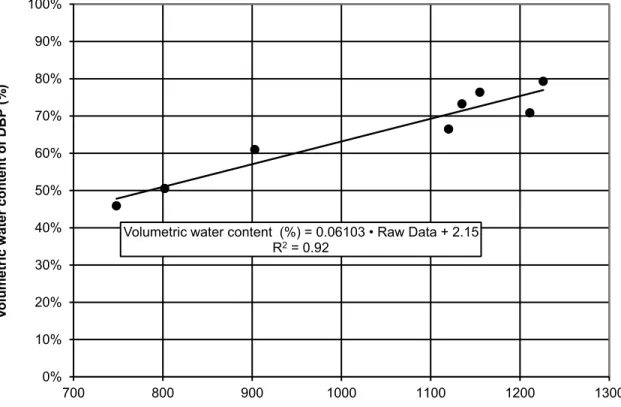
ECH2O EC-5 (Decagon Devices Inc.) water content probes, connected to EM-50 (Decagon Devices Inc.) dataloggers, were installed on three profiles and completed the monitoring of the hydraulic behaviour of the DBP layer (Fig. 1). Prior to installation in the field, the EC-5 probes were calibrated in the laboratory. Fig. 4 shows their calibration curve (Lacroix Vachon 2008). A Vantage Pro (Davis Instruments) weather station completed the site’s
instrumentation. Climatic data consisted of precipitation, temperature, humidity and wind speed. Data were recorded every 30 minutes. Further details about the St-Tite-des-Caps experimental plot are presented in Lacroix Vachon (2008).
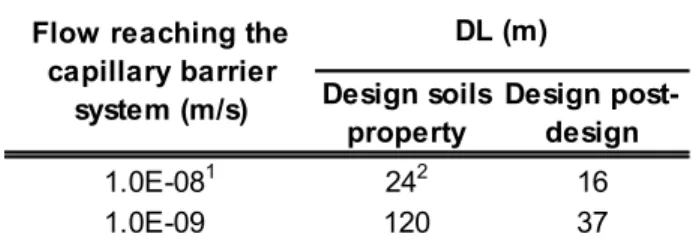
Behaviour of the proposed cover system according to the analytical solution by Ross (1990) In order to obtain the DL values, the Ross (1990) model was applied using the design and post-design unsaturated hydraulic parameters. The former were estimated during the post-design phase, whereas the post-design evaluation parameters were obtained in the laboratory (Table 1 and Fig. 2). Table 2 presents the DL values obtained using the Ross (1990) model for the following situations: 1) using design hydraulic parameters and the pre-consolidation ksat of DBP; 2) using
design hydraulic parameters and the post-consolidation ksat of DBP; 3) using post-design
hydraulic parameters and the pre-consolidation ksat of DBP; and 4) using post-design hydraulic
parameters and the post-consolidation ksat of DBP. Before consolidation of the DBP, its
laboratory-determined ksat was 1x10⁻⁸ m/s, whereas the post-consolidation ksat was 1x10⁻⁹ m/s
(Abdolahzadeh et al. 2008). In all cases, ksat represents the maximum value of percolation
reaching the top of the capillary barrier. RESULTS
Climatic data
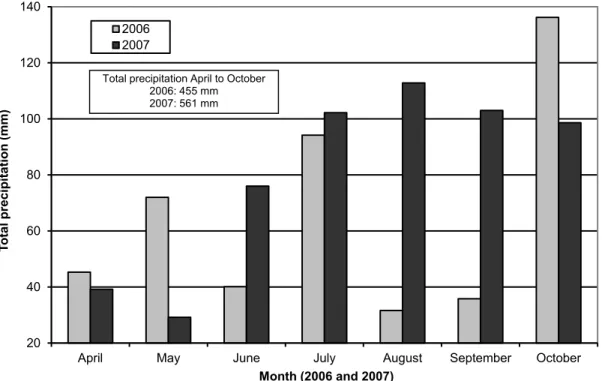
The distribution of precipitation during the monitoring period is presented in Fig. 5. The cumulative monthly precipitation from June to September was much higher in 2007 than in 2006, whereas early in the spring and during the last month of the monitoring period (October,
2007), the cumulative monthly precipitation was higher in 2006. The total annual precipitation for 2007 was 23% higher than in 2006.
Monitoring of the hydraulic barrier
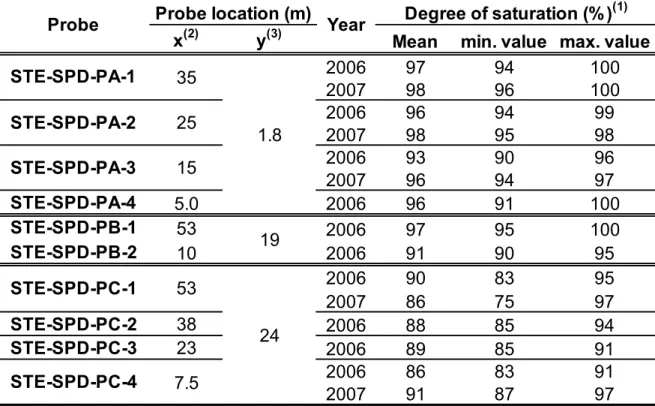
As shown in Table 3, the calculated degrees of saturation for 2006 and 2007 at the base of the DBP varied between 83% and 100%. These degrees of saturation (Sr) were calculated using
volumetric water content data recorded for probes installed just above the interface between the DBP and the sand layer, i.e. probes PA-4, PB-2 and PC-4 (indicated in Fig. 1) and considering ntot = sat, where ntot is the total porosity. In addition, data from probes installed within the DBP
layer (PA-1 to PA-3, PB1 and PC-1 to PC-3) were used to calculate degrees of saturation very close to 100%. For all practical purposes, the DBP layer could thus be considered saturated most of the time.
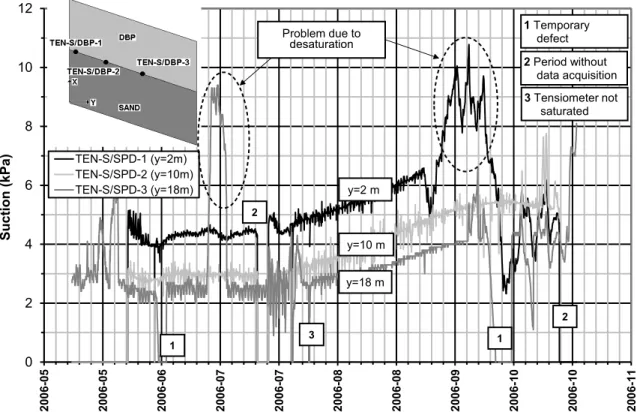
The evolution of suction at the DBP/sand interface in 2006 is presented in Fig. 6. Suction decreased by 2.3 ± 0.7 kPa between the upstream part of the experimental cell (where TEN-S/DBP-1 is located) and the middle (where TEN-S/DBP-3 is located). In addition, the variations of suction over time recorded for these two tensiometers were very similar throughout 2006 (Fig. 6).
The low suction values measured with the tensiometers placed inside the DBP layer (Irrometer B, Fig. 1) and at the interface between the DBP and sand layers, together with the high degree of saturation recorded, indicate that the degree of saturation at the base of the DBP layer remains quite high throughout the entire length of the interface with the sand layer. As a consequence, the maximum seepage rate into the sand-gravel capillary barrier is limited by the ksat of the DBP.
In 2007, two tensiometers (Irrometers 2 and 3) were installed at the Sand-DBP interface (Fig. 1), downstream from the S/DBP-3 tensiometer, to measure the behaviour of this interface in the downstream area of the experimental cell more accurately. Irrometer 3 and S/DBP-2 experienced stability problems, forcing discontinuation of their monitoring. Fig. 7 shows that the suctions recorded in 2007 varied less than in 2006, although greater variations were recorded over short periods of time. The average suction in 2007 for the SDBP-1 tensiometer (top of the slope) was 5.6 kPa, with a standard deviation of 1.0 kPa, and that of SDBP-3 (middle of the slope) was 4.9 kPa, with a standard deviation of 1.6 kPa. This is equivalent to a 0.7 kPa drop in suction, which confirms the trend observed in 2006. The average suction measured by the tensiometer further downstream (Irrometer 2; installed at the 22.4 m mark) was 3.8 kPa ± 0.4 kPa, indicating that between the 18.0 and 22.4 m marks, there was a decrease in suction. Throughout almost all of summer 2007, the decreases in suction between S/DBP-1 and Irrometer 2 varied between 1.5 kPa and 2.0 kPa. Given these low suctions and the associated high degrees of saturation, the interface between the DBP and the capillary barrier also remained saturated in 2007; similar to the trend observed in 2006.
Monitoring of the capillary barrier Suction within the capillary barrier
Given the facts that suction values at the DBP-Sand interface varied between approximately 2 and 6 kPa (Fig. 6 and Fig. 7) and that the AEV of the sand is approximately 1.4 kPa (Table 1), the upper part of the sand layer probably remained unsaturated in 2006 and 2007.
The evolution of suction over time, as measured with tensiometers TEN-S/G-1 to 4 (placed at the sand-gravel interface, as illustrated in Fig. 1) is presented in Fig. 8. In 2006 suction
values decreased from upstream to downstream. In fact, only 6 m away from the top, suction measurements varied between 4.0 and 7.5 kPa (TEN-S/G-1), whereas at the bottom of the slope (29 m mark; TEN-S/G-4) they varied between 1.2 kPa and 2.4 kPa. These data show that the sand remained close to saturated at the bottom of the slope and that water was being transferred towards the gravel, and eventually towards the waste mass. The spatial variation of suction from upstream to downstream is presented in Fig. 9. In 2006 the drop in suction was more pronounced
up to the 22.0 m mark. Between the 23.0 and 29.0 m marks (where TEN-S/G-3 and TEN-S/G-4 are located), suction stabilized, suggesting that the flow laterally drained by the sand must have reached maximum transfer capacity. Therefore, the diversion length in 2006 was reached at approximately the 23 m mark.
For 2007, the average suction values for tensiometers TEN-S/G-1 to TEN-S/G-4 were 4.8 kPa, 5.5 kPa, 3.2 kPa, and 2.0 kPa (Fig. 8), respectively. Stabilization of the drop in suction in 2007 occurred in a slightly different manner than in 2006. Throughout the summer of 2007, the suction values measured by tensiometer TEN-S/G-3 were much higher than those measured in 2006. On the other hand, the suction values measured in 2006 and 2007 by TEN-S/G-4 (Fig. 8) remained stable (average for the period was ≤ 2 kPa). Taking into account the locations of TEN-S/G-3 (23 m from top) and TEN-S/G-4 (29 m from top) these data indicate that in 2007 the DL was greater than 23 m and shorter than 29 m. Around mid-September 2007, the DL seemed to have returned to the DL estimated for 2006 (23 m), since the suction values measured at TEN-S/G-3 were similar to those obtained with TEN-S/G-4. This decrease in DL at the end of the season can be explained by the increase in precipitation in the beginning of fall (Fig. 5).
To more accurately define the distribution of suction values at the sand-gravel interface at the bottom of the slope as well as determine the DL, 4 tensiometers (Irrometers 1, 4, 5 and 6;
Fig. 1) were installed in 2007 precisely in the area where the diversion length had been estimated in 2006, i.e. close to tensiometer TEN-S/G-3. Irrometer 1 also experienced stability problems, and was abandoned. Data from the new tensiometers (Fig. 9), placed at the 23.5, 24.5 and 25.5 m marks, corroborated those obtained by the other tensiometers during the summer of 2007 (Fig. 8). In fact, the suction measurements at the 23.5 m mark by tensiometer Irrometer 4 were greater than those measured further downstream by the other tensiometers (Irrometer 5 and 6 at 24.5 m and 25.5 m respectively), where the suction measurements were similar. According to these observations, the DL during the summer of 2007 would be between 24.0 and 25.0 m, i.e. similar to the design DL (24.0 m). Most importantly, the DL estimated from field data is similar to the design DL (Table 2).
The above DLs could also be attained using the method presented by Steenhuis et al. (1991). According to the latter, the DL is attained when the suction at the interface of the capillary barrier reaches the WEV of the coarse material. In the present case, the WEV of the CBL is approximately 1.4 kPa (Table 1). As presented in Fig. 9, this suction value was attained, in 2006, in the vicinity of the 23.0-m mark. In 2007, consolidation of DBP led to a decrease of the percolation rate reaching the sand/gravel capillary barrier (Abdolahzadeh et al. 2008). Accordingly, suction at this interface increased and, consequently, the WEV was only reached at a greater distance than that observed in 2006. In other words, the DL in 2007 was greater than in 2006.
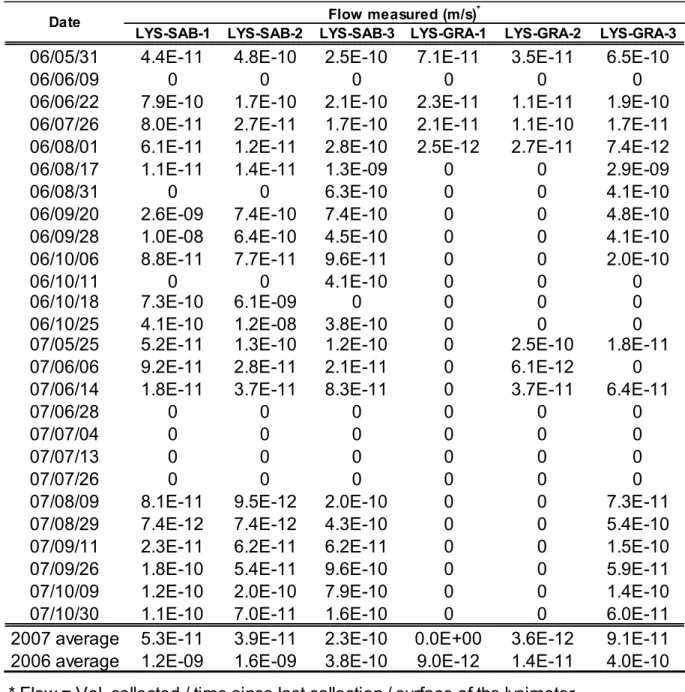
Evaluation of the percolation using lysimeters
The volumes collected in the lysimeters are presented in Table 4. Given the low drainage capacity of the DBP, the volume of water collected in the lysimeters installed in the sand were
relatively similar, i.e. the percolation rates that reached the sand layer were relatively uniform. No water was collected in these lysimeters during dry periods (for example the period ending June 9, 2006). During an abundant precipitation period (for example, during autumn rains), the three lysimeters collected water at a rate close to the ksat value for the DBP.
For 2006, the average flow reaching the top of the sand layer was in the order of 1x10⁻⁹
m/s (32 mm/yr), whereas in 2007 it was 1.1x10⁻¹⁰ m/s (3.5 mm/yr), despite the higher annual
precipitation in 2007 (Fig. 5). In fact, this one order of magnitude decrease is due to the decrease in the saturated hydraulic conductivity of the DBP (Abdolahzadeh et al. 2008).
The DL could be approximately estimated using the quantities of water collected in the lysimeters installed in the gravel layer (LYS-GRA-1 to LYS-GRA-3). Although significant quantities of water were collected in the sand layer during the summers of 2006 and 2007 (especially during periods of intense precipitation), Fig. 10 shows that practically no water was collected in lysimeters LYS-GRA-1 and LYS-GRA-2, in 2006. Significant quantities of water were collected only in LYS-GRA 3. This indicates that the DL was attained between lysimeters LYS-GRA 2 and LYS-GRA 3; i.e. between the 23.0 and 29.0 m marks. In 2007, the quantity of water collected at LYS-GRA-2 was nil, except during the Spring. This was also the case for LYS-GRA-3, where water collection rates were nil, or very low. From mid-June 2007, the DL was greater than 24.0 m and could possibly have been greater than the length of the experimental plot (30.0 m). These conclusions corroborate those of the suction data analysis. In addition, the value of the average plus standard deviation (AVG+) percolation into the gravel layer in 2006 (1.15 x 10⁻⁹ m/s, 36 mm/yr) was one order of magnitude lower than the average 7-month (April
to October) precipitation rate recorded in 2006 (2.5 x 10⁻⁸ m/s, 790 mm/yr) (Fig. 10). In 2007,
the gravel layer was 2.3 x 10⁻¹⁰ m/s (7.3 mm/yr.) whereas the average 7 month (April to October)
precipitation rate recorded in 2007 was 3 x 10⁻⁸ m/s (950 mm/yr).
During all the monitoring periods, lysimeter LYS-GRA-3 never collected water at rates greater than 3x10⁻⁹ m/s (95 mm/yr). In fact, with minimum changes, the performance of the
proposed cover system would comply with several regulations in the world, which often require a barrier system with a hydraulic conductivity less than 1 x 10⁻⁹ m/s, that is to say the "typical
equivalence criteria" (Benson et al. 2001).
CONCLUSION
The objective of this study was to evaluate the effectiveness in controlling percolation into the waste mass of a 30.0-m-long, 10.0-m-wide experimental cover with capillary barrier effect (CCBE) constructed on the Saint-Tite-des-Caps landfill site, Quebec, Canada. This cover system consists of a hydraulic barrier where a layer of DBP was compacted on top of a capillary barrier consisting of a layer of sand overlying a layer of gravel.
Drainage columns and a pressure plate were used to determine the water retention curve of these materials. This characterization of the materials made it possible to evaluate the theoretical diversion length (DL) of the capillary barrier. The theoretical analysis showed that the proposed cover system may reach high DL values.
Analysis of the large-scale field data shows that in 2006 and 2007 the DBP layer remained close to saturation and that this material adequately controlled percolation reaching the capillary barrier. According to the suction values measured by the tensiometers and the amounts of water collected by the lysimeters, the DL in 2006, varied between 23 m and 29 m and was very similar to that estimated by the Ross analytical solution. The latter was applied to design the
experimental plot, giving a DL equal to ~ 24.0 m. In 2007, there were times when the DL surpassed the total length of the experimental cell (30 m) due to a decrease in the seepage rate reaching the sand-gravel capillary barrier system. This change was caused by a decrease in the hydraulic conductivity of the hydraulic barrier (DBP layer). The results indicate that, in the pre-feasibility studies and under worst-case scenario boundary conditions, the DL can be reasonably estimated using the Ross analytical solution. The steady-state scenario is admittedly simple but its prediction performance may be improved when a hydraulic barrier is placed over a capillary barrier system.
At all times, the flow percolating vertically in the gravel downstream from the CCBE is inferior to 3 x 10⁻⁹ m/s (95 mm/yr), i.e. the same order of magnitude as common performance
criteria for allowable percolation into landfills (1 x 10⁻⁹ m/s). The objective of the proposed
cover was, therefore, reached with the proposed design.
The effect of hysteresis was not taken into account in the present study. Nonetheless, the diversion length, calculated using the Ross (1990) model and considering the drying curve, was close to the field-observed DL, which was estimated from suction and data collected from lysimeters. This may have happened because hysteresis was less critical for the materials constituting this particular capillary barrier.
ACKNOWLEDGEMENTS
Funding for this study was provided by Cascades Inc. and NSERC (Canada) under the University-Industry Partnership grant number CRD 192179 and by NSCRC under the Second Author’s Discovery Grant. The authors also acknowledge help provided by Jean-Guy Lemelin, in the design of the experimental cells, installation of the measuring system and with actual
testing. The second Author completed this manuscript while at the Federal University of Santa Catarina, Brazil, where he was Visiting Professor with a grant from CAPES/Brazil.
REFERENCES
Abdolahzadeh, A.M., Vachon, B.L., and Cabral, A.R. 2008. Hydraulic barrier and its impact on the performance of cover with double capillary barrier effect In 61e Conférence géotechnique canadienne. Edmonton. 21-24 Sept.
Aubertin, M., and Bussiere, B. 2001. Water flow through cover soils using modeling and experimental methods. Journal of Geotechnical & Geoenvironmental Engineering,
127(9): 810-811.
Aubertin, M., Bussière, B., Aachib, M., and Chapuis, R.P. 1996. Une modélisation numérique des écoulements non saturés dans des couvertures multicouces en sols. Hydrogéologie, 1:
3-13.
Aubertin, M., Cifuentes, E., Martin, V., Apithy, S., Bussiere, B., Molson, J., Chapuis, R.P., and Maqsoud, A. 2006. An investigation of factors that influence the water diversion capacity of inclined covers with capillary barrier effects. Carefree, AZ, United States. American Society of Civil Engineers, Reston, VA 20191-4400, United States, pp. 613-624.
Barth, C., and Wohnlich, S. 1999. Proof of effectiveness of a capillary barrier as surface sealing of sanitary landfill. In 7th international waste management and landfill symposium. Edited by R. Cossu, R. Stegman, and T.H. Christensen. Sant Margarita di Pula, Italy, pp. 389-392.
Bédard, D. 2005. Effet du fluage à long terme des sous-produits de désencrage dû à la perte de masse et son effet sur la compression et la conductivité hydraulique. M.Sc.A. Thesis, Université de Sherbrooke, 166 p.
Benson, C., Abichou, T., Albright, W.H., Gee, G., and Roesler, A. 2001. Field evaluation of alternative earthen final covers. Int. J. of Phytoremediation, 3(1): 1-21.
Berger, J., Fornes, L.V., Ott, C., Jager, J., Wawra, B., and Zanke, U. 2005. Methane oxidation in a landfill cover with capillary barrier. Waste Management, 25(4 SPEC ISS): 369-373.
Brooks, R.H., and Corey, A.T. 1964. Hydraulic properties of porous media. Hydrology paper no. 3, Colorado State University, Fort Collins, Colorado.
Burnotte, F., Lefebvre, G., Cabral, A., Audet, C., and Veilleux, A. 2000. Use of deinking residues for the final cover of a MSW landfill. In 53rd Canadian Geotechnical Conference. Montreal. October 15-18, 2000, Vol.1, pp. 585-591.
Bussière, B. 1999. Étude du comportement hydrique de couvertures avec effets de barrière capillaire inclinées à l'aide de modélisations physiques et numériques. Ph.D. Thesis, École Polytechnique de Montréal, 354 p.
Bussière, B., Aubertin, M., and Chapuis, R.P. 2000. The Use of Hydraulic Breaks to Limit Desaturation of Inclined Capillary Barriers. In 53th Canadian Geotechnical Conference, pp. 465-472.
Bussière, B., Aubertin, M., and Chapuis, R.P. 2003a. The behaviour of inclined covers used as oxygen barriers. Canadian Geotechnical Journal, 40(3): 512-535.
Bussière, B., M., A., and Zhan, G. 2007. Design of inclined covers with capillary barrier effect. Discussion to Parent and Cabral (2006). Submitted to Geotechnical and Geological Engineering.
Bussière, B., Aubertin, M., Morel-Seytoux, H.J., and Chapuis, R.P. 1998. A laboratory investigation of slope influence on the behaviour of capillary barriers. In 51th Canadian Geotechnical Conference. Edmonton, Canada, Vol.2, pp. 831-836.
Bussière, B., Apithy, S., Aubertin, M., and Chapuis, R.P. 2003b. Diversion capacity of sloping covers with capillary barrier effect. In 56th Annual Canadian Geotechnical Conf., 4th Joint
IAH-CNC and CGS Groundwater Specialty Conf. & 2003 NAGS Conference, Winnipeg, Canada, p. 8.
Bussière, B., Aubertin, M., Aachib, M., Chapuis, R.P., and Crespo, J.R. 1995. Unsaturated flow modelling of covers for reactive tailings. In 3rd Canadian Conference on Computer Applications in the Mining Industry CAMI'95. Edited by H. Mitri. Montréal. 22-25 October, pp. 853-862.
Cabral, A.R., Tremblay, P., and Lefebvre, G. 2004a. Determination of the diffusion coefficient of oxygen for a cover system composed of pulp and paper residues. Geot. Testing J.,
27(2): 184-197.
Cabral, A.R., Racine, I., Burnotte, F., and Lefebvre, G. 2000. Diffusion of oxygen through a pulp and paper residue barrier. Canadian Geotechnical Journal, 37: 201-217.
Cabral, A.R., Planchet, L., Marinho, F.A., and Lefebvre, G. 2004b. Determination of the soil water characteristic curve of highly compressible materials: case study of pulp and paper by-product. Geot. Testing Journal, 27(2): 154-162.
Chapuis, R.P. 2004. Predicting the saturated hydraulic conductivity of sand and gravel using effective diameter and void ratio. Canadian Geotechnical Journal, 41(5): 787-795.
Cifuentes, E., Aubertin, M., Chapuis, R.P., Molson, J., and Bussière, B. 2006. Analyses of the water diversion length of inclined, layered soil covers. In 59th Canadian Geotechnical Conference and the 7th Joint CGS/IAH-CNC Groundwater Specialty Conference, Sea to Sky Geotechnique. Vancouvert, Canada. 1-4 October, pp. 1744-1749.
Fredlund, D.G., and Xing, A.Q. 1994. Equations for the soil-water characteristic curve. Canadian Geotechnical Journal, 31(4): 521-532.
Hazen, A. 1911. Discussion of « Dams on Sand Foundations » from A.C. Koening. ASCE, 73.
Kamon, M., Inazumi, S., Takashi, T., and Inui, T. 2001. Waste sludge applicability and waste balance analysis of landfill cover system. In Proceedings of the First Korea-Japan Joint Seminar on Geoenvironmental Engineering. Seoul, Korea. April 6-7, 2001, pp. 31-38. Kämpf, M., and Montenegro, H. 1997. On the performance of capillary barriers as landfill cover.
Hydrology and Earth Systems Sciences, 4: 925-929.
Kämpf, M., Holfelder, T., and Montenegro, H. 1999. Designing capillary barriers. In 7th international waste management and landfill symposium. Edited by T.H. Christensen, R. Cossu, and R. Stegman. Sardina, pp. 381-388.
Khire, M.V., Benson, C.H., and Bosscher, P.J. 2000. Capillary barriers: Design variables and water balance. Journal of Geotechnical & Geoenvironmental Engineering, 126(8):
695-708.
Lacroix Vachon, B. 2008. Les écoulements dans les milieux non saturés et leurs applications aux couvertures avec effet de barrière capillaire installées dans un site d'enfouissement sanitaire M.Sc.A. Thesis, Université de Sherbrooke, 138 p.
Lacroix Vachon, B., El-Ghabi, B., and Cabral, A.R. 2007. Évaluation préliminaire de l’efficacité du recouvrement avec double effet de barrière capillaire installé au site de St-Tite-des-Caps, Qc. In 60e Conférence géotechnique canadienne. Ottawa. 21-24 Oct.
Maqsoud, A., Bussière, B., and Aubertin, M. 2004. Hysteresis effects on the water retention curve: a comparison between laboratory results and predictive models. In 57th Canadian Geotechnical Conference and the 5th joint CGS-IAH Conference. Quebec City, Canada. CGS, Vol.Session 3A, pp. 8-15.
Moo-Young, H.K., and Zimmie, T.F. 1996. Geotechnical properties of paper mill sludges for use in landfill covers. Journal of Geotechnical Engineering, 122(9): 768-775.
Morel-Seytoux, H.J. 1993. Dynamic perspective on the capillary barrier effect at the interface of an upper fine layer with a lower coarse layer. In Engineering Hydrology. Edited by C.Y. Kuo. San Francisco. July 25-30. ASCE, pp. 467-472.
Morel-Seytoux, H.J. 1994. Steady-state effectiveness of a capillary barrier on a sloping interface. In 14th Hydrology Days. Edited by H.J. Morel-Seytoux. Atherton, CA. Hydrology Days Publications, pp. 335-346.
Morris, C.E., and Stormont, J.C. 1999. Parametric study of unsaturated drainage layers in a capillary barrier. Journal of Geotechnical & Geoenvironmental Engineering, 125(12):
1057-1065.
Mualem, Y. 1976. A new model for predicting the hydraulic conductivity of unsaturated porous media. Water Resources Research, 12: 513-522.
Nicholson, R.V., Gillham, R.W., Cherry, J.A., and Reardon, E.J. 1989. Reduction of acid generation in mine tailings through the use of moisture-retaining cover layers as oxygen barriers, 26(1-8).
Parent, S.-É. 2006. Aspects hydrauliques et géotechniques de la conception de barrières capillaires incluant des matériaux recyclés hautement compressibles. Ph.D. Thesis, Université de Sherbrooke, 114 p.
Parent, S.-É., and Cabral, A.R. 2006. Design of inclined covers with capillary barrier effect. Geotechnical and Geological Engineering Journal, 24: 689-710.
Parent, S.-É., Cabral, A.R., and Zornberg, J.G. 2007. Water retention curves and hydraulic conductivity functions of highly compressible materials. Canadian Geotechnical Journal,
44(10): 1200-1214.
Parent, S.-É., Cabral, A.R., Dell' Avanzi, E., and Zornberg, J.G. 2004. Determination of the hydraulic conductivity function of a highly compressible material based on tests with saturated samples. Geot. Testing Journal, 27(6): 1-5.
Planchet, L. 2001. Utilisation des résidus de désencrage comme barrière capillaire et évapotranspirative (ET) pour les parcs à résidus miniers producteurs de DMA. M.Sc.A. Thesis, Université de Sherbrooke, 114 p.
Robart, G. 1998. Étude de la perméabilité de la compressibilité des résidus de désencrage. Thesis, Université de Sherbrooke, 140 p.
Ross, B. 1990. Diversion capacity of capillary barriers. Water Resources Research, 26(10):
2625-2629.
Steenhuis, T.S., Parlange, J.Y., and Kung, K.J.S. 1991. Comment on 'the diversion capacity of capillary barriers' by Benjamin Ross (paper 91WR01366). Water Resources Research,
27(8): 2155.
Stormont, J.C. 1996. The effectiveness of two capillary barriers on a 10% slope. Geotech Geol Eng, 14: 243-267.
Stormont, J.C., and Anderson, C.E. 1999. Capillary barrier effect from underlying coarser soil layer. Journal of Geotechnical and Geoenvironmental Engineering, 125(8): 641-648.
United States Department of Agriculture, A.R.S. 1999. UNsaturated SOil hydraulic properties DAtabase (UNSODA).
van Genuchten, M.T. 1980. A closed-form equation for predicting the hydraulic conductivity of unsaturated soils. Soil Science Society of America Journal, 44: 892-898.
van Genuchten, M.T., Leij, F.J., and Yates, S.R. 1991. The RETC code for quantifying the hydraulic functions of unsaturated soils, Report EPA/600/2-91/065, U.S. Department of Agriculture, Agriculture Research Service.
von Der Hude, N., and Huppert, F. 1998. Capillary barriers for the surface sealings of landfills. Water-Rock Interaction, pp.1005-1008.
von Der Hude, N., Melchior, S., and Möckel, S. 1999. Construction of a capillary barrier in the cover of the Breinermoor landfill. In Seventh International Waste Management and Landfill Symposium. Edited by T.H. Christensen, R. Cossu, and R. Stegman. Sta Margarita di Pula, Italy. CISA, pp. 393-402.
Walter, M.T., Kim, J.S., Steenhuis, T.S., Parlange, J.Y., Heilig, A., Braddock, R.D., Selker, J.S., and Boll, J. 2000. Funneled flow mechanisms in a sloping layered soil: Laboratory investigation. Water Resources Research, 36(4): 841-849.
Warrick, A.W., Wierenga, P.J., and Pan, L. 1997. Downward water flow through sloping layers in the vadose zone: Analytical solutions for diversions. Journal of Hydrology, 192(1-4):
321-337.
Wawra, B., and Holfelder, T. 2003. Development of a landfill cover with capillary barrier for methane oxidation - the capillary barrier as gas distribution layer. In 9th Int. Waste Mgmt and Landfill Symp. Italy. October 6-10, 2003, p. Paper 348.
Yang, H., Rahardjo, H., Leong, E.C., and Fredlund, D.G. 2004. A study of infiltration on three sand capillary barriers Canadian Geotechnical Journal, 41(4).
Zhan, G., Mayer, A., McMullen, J., and Aubertin, M. 2001. Slope effect study on the capillary cover design for a spent leach pad. In 8th International Conference Tailings and Mine Waste'01. Colorado State University, Forth Collins, Co. Balkema, Rotterdam, The Netherlands, pp. 179-187.
Zhan, G., Schafer, W., Milczarek, M., Myers, K., Giraudo, J., and Espell, R. 2006. The evolution of evapotranspiration cover system at Barrick Goldstrike Mines. In 7th International
Conference on Acid Rock Drainage, ICARD 06. Edited by R.I. Barnhisel. St. Louis, MO. March 26-30, pp. 2585-2603.
Zhang, Q., Werner, A., Aviyanto, R. and Hutson, J. 2009. Influence of soil moisture hysteresis on the functioning of capillary barriers. Hydrological Processes, 23: 1369-1375.
List of Tables
Table 1. Hydraulic properties of the materials used in the St-Tite-des-Caps CCBE.
Table 2. DL calculated using Ross (1990) for different percolation rates reaching the top of the capillary barrier.
Table 3. Degree of saturation of DBP for 2006 and 2007 – Profiles A, B, and C
Table 4. Flow collected in the lysimeters installed in the MRL and CBL, 2006 and 2007.
List of Figures
Fig. 1. Cross-sectional views of the Saint-Tite-des-Caps experimental cell.
Fig. 2. WRC of DBP, of sand and gravel used in the experimental alternative cover of St-Tite-des-Caps.
Fig. 3. k-fct of DBP, of gravel and sand obtained using the WRC and Mulem (1976) - van Genuchten (1980) model.
Fig. 4. Water content probe calibration for DBP.
Fig. 5. Distribution of total monthly precipitation during the monitoring periods for 2006 and 2007.
Fig. 6. Evolution of suction over time at the interface between the DBP layer and the CB, 2006. Fig. 7. Evolution of suction over time at the interface between the DBP layer and the CB, 2007. Fig. 8. Evolution of suction over time at the sand-gravel interface (2006 and 2007).
Fig. 9. Spatial analysis of suction at the CRC-CBC interface.
Fig. 10. Average annual flows collected in the lysimeters placed in the gravel layer for 2006 and 2007.
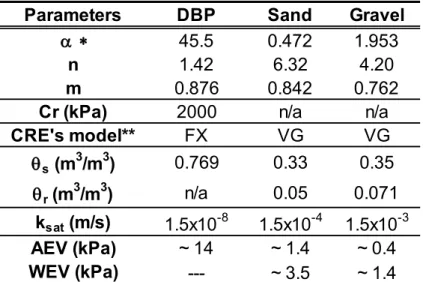
Table 1. Hydraulic properties of the materials used in the St-Tite-des-Caps CCBE.
Parameters DBP Sand Gravel
a * 45.5 0.472 1.953
n 1.42 6.32 4.20
m 0.876 0.842 0.762
Cr (kPa) 2000 n/a n/a
CRE's model** FX VG VG s (m3/m3) 0.769 0.33 0.35 r (m3/m3) n/a 0.05 0.071 ksat (m/s) 1.5x10⁻⁸ 1.5x10⁻⁴ 1.5x10⁻³ AEV (kPa) ~ 14 ~ 1.4 ~ 0.4 WEV (kPa) --- ~ 3.5 ~ 1.4
* 1/kPa for van Genuchten (1980), kPa for Fredlund and Xing (1994) ** FX: Fredlund and Xing (1994) VG: van Genuchten (1980)
Table 2. DL calculated using Ross (1990) for different percolation rates reaching the top of the capillary barrier.
Design soils
property Design post-design
1.0E-081 242 16
1.0E-091 120 37
Flow reaching the capillary barrier
system (m/s)
DL (m)
1Percolation rate retained in the design 2Design DL
Table 3. Degree of saturation of DBP for 2006 and 2007 – Profiles A, B, and C.
x(2) y(3) Mean min. value max. value
2006 97 94 100 2007 98 96 100 2006 96 94 99 2007 98 95 98 2006 93 90 96 2007 96 94 97 STE-SPD-PA-4 5.0 2006 96 91 100 STE-SPD-PB-1 53 2006 97 95 100 STE-SPD-PB-2 10 2006 91 90 95 2006 90 83 95 2007 86 75 97 STE-SPD-PC-2 38 2006 88 85 94 STE-SPD-PC-3 23 2006 89 85 91 2006 86 83 91 2007 91 87 97
N.B.: Some data are missing in 2007 due to defective probes
(3) Vertical distance between the elevation of the DBP-sand interface and the center of the probe.
(1) Degree of saturation = /sat, where ntot=sat=80% for 2006 and sat=77% for
Probe location (m) Degree of saturation (%)(1)
Probe Year STE-SPD-PC-1 STE-SPD-PC-4 53 7.5 24
2007. The decrease in sat was attributed to consolidation of the DBP layer.
(2) Horizontal distance from top of the experimental plot to location of the probe. 19 1.8 35 25 15 STE-SPD-PA-1 STE-SPD-PA-2 STE-SPD-PA-3
Table 4. Flow collected in the lysimeters installed in the MRL and CBL, 2006 and 2007. LYS-SAB-1 LYS-SAB-2 LYS-SAB-3 LYS-GRA-1 LYS-GRA-2 LYS-GRA-3
06/05/31 4.4E-11 4.8E-10 2.5E-10 7.1E-11 3.5E-11 6.5E-10
06/06/09 0 0 0 0 0 0
06/06/22 7.9E-10 1.7E-10 2.1E-10 2.3E-11 1.1E-11 1.9E-10
06/07/26 8.0E-11 2.7E-11 1.7E-10 2.1E-11 1.1E-10 1.7E-11
06/08/01 6.1E-11 1.2E-11 2.8E-10 2.5E-12 2.7E-11 7.4E-12
06/08/17 1.1E-11 1.4E-11 1.3E-09 0 0 2.9E-09
06/08/31 0 0 6.3E-10 0 0 4.1E-10
06/09/20 2.6E-09 7.4E-10 7.4E-10 0 0 4.8E-10
06/09/28 1.0E-08 6.4E-10 4.5E-10 0 0 4.1E-10
06/10/06 8.8E-11 7.7E-11 9.6E-11 0 0 2.0E-10
06/10/11 0 0 4.1E-10 0 0 0
06/10/18 7.3E-10 6.1E-09 0 0 0 0
06/10/25 4.1E-10 1.2E-08 3.8E-10 0 0 0
07/05/25 5.2E-11 1.3E-10 1.2E-10 0 2.5E-10 1.8E-11
07/06/06 9.2E-11 2.8E-11 2.1E-11 0 6.1E-12 0
07/06/14 1.8E-11 3.7E-11 8.3E-11 0 3.7E-11 6.4E-11
07/06/28 0 0 0 0 0 0
07/07/04 0 0 0 0 0 0
07/07/13 0 0 0 0 0 0
07/07/26 0 0 0 0 0 0
07/08/09 8.1E-11 9.5E-12 2.0E-10 0 0 7.3E-11
07/08/29 7.4E-12 7.4E-12 4.3E-10 0 0 5.4E-10
07/09/11 2.3E-11 6.2E-11 6.2E-11 0 0 1.5E-10
07/09/26 1.8E-10 5.4E-11 9.6E-10 0 0 5.9E-11
07/10/09 1.2E-10 2.0E-10 7.9E-10 0 0 1.4E-10
07/10/30 1.1E-10 7.0E-11 1.6E-10 0 0 6.0E-11
2007 average 5.3E-11 3.9E-11 2.3E-10 0.0E+00 3.6E-12 9.1E-11
2006 average 1.2E-09 1.6E-09 3.8E-10 9.0E-12 1.4E-11 4.0E-10
Date Flow measured (m/s)*
0 5 10 15 20 25 30 m STE-DBP-PA-1 STE-DBP-PC-1 STE-DBP-PA-2 STE-DBP-PB-1 STE-DBP-PC-2 STE-DBP-PA-3 STE-DBP-PC-3 STE-DBP-PA-4 STE-DBP-PB-2 STE-DBP-PC-4 LYS-SAN-1 LYS-GRA-1 LYS-GRA-2 LYS-GRA-3 LYS-SAN-2 LYS-SAN-3 Nb 1 TEN-S/DBP-3 TEN-S/G-2 TEN-DBP-1 TEN-S/G-3 TEN-LYS-2B TEN-LYS-2H Datalogger
(for water content “STE” probes)
TEN-S/G-4 Drains DL 6 (datalogger for tensiometers “TEN”) DL 6 (datalogger for tensiometers
“TEN”) Irrometers 1 to 6 Dataloggerfor Irrometers
Nb 2 Nb 3 Nb 4Nb 5 Nb 6 Irrometer B 5% TEN-S/DBP-2 TEN-S/G-1 Cross sections 1 / 2 Cross section 2 / 2 20 cm 40 cm 60 cm 60 cm Class A Gravel
DBP (seepage control layer)
Protection layer
Not to scale
Limits of the experimental plot
Capillary barrier
Datalogger
(for water content “STE” probes)
TEN-S/DBP-1
0 0.1 0.2 0.3 0.4 0.5 0.6 0.7 0.8 0 1 10 100 1000 Vo lu metr ic w ater co nten t (m 3 / m 3) Suction (kPa) DBP: Experimental data
DBP: Fredlund and Xing's (1994) model Sand: Experimental data, test column Sand: van Genuchten's (1980) model, test column
Gravel: Experimental data, test column Gravel: UNSODA database
Gravel: van Genuchten's (1980) model, adopted WRC
0.1
Fredlund and Xing's (1994) extrapolation
Fig. 2. WRC of DBP, of sand and gravel used in the experimental alternative cover of St-Tite-des-Caps
1 E-18 1 E-16 1 E-14 1 E-12 1 E-10 1 E-08 1 E-06 1 E-04 1 E-02 0 1 10 100 1000 H yd rau lic co nd ucti vi ty (m/ s) ' ' Suction (kPa)
DBP: Fredlund and Xing's (1994) model, modified cell Sand: van Genuchten's (1980) model, test column Gravel: van Genuchten's (1980) model, adopted WRC
0.1
Fig. 3. k-fct of DBP, of gravel and sand obtained using the WRC and Mulem (1976) - van Genuchten (1980) model
Volumetric water content (%) = 0.06103 • Raw Data + 2.15 R2= 0.92 0% 10% 20% 30% 40% 50% 60% 70% 80% 90% 100% 700 800 900 1000 1100 1200 1300 Vo lu metr ic w ater co nten t o f D B P (% ) '
Raw data - ECH2O EC-5 (Decagon Devices Inc.)
20 40 60 80 100 120 140
April May June July August September October
To tal pr ecip itatio n (mm ) ' Month (2006 and 2007) 2006 2007
Total precipitation April to October 2006: 455 mm 2007: 561 mm
Fig. 5. Distribution of total monthly precipitation during the monitoring periods for 2006 and 2007
0 2 4 6 8 10 12 20 06 -0 5 20 06 -0 5 20 06 -0 6 20 06 -0 7 20 06 -0 7 20 06 -0 8 20 06 -0 8 20 06 -0 9 20 06 -1 0 20 06 -1 0 20 06 -1 1 Su cti on (kPa) ' TEN-S/SPD-1 (y=2m) TEN-S/SPD-2 (y=10m) TEN-S/SPD-3 (y=18m) Problem due to desaturation 2 2 1 1 3 y=2 m. y=10 m y=18 m 3 Tensiometer not saturated 2 Period without data acquisition 1 Temporary defect
Fig. 6. Evolution of suction over time at the interface between the DBP layer and the CB, 2006
0 2 4 6 8 10 12 2007-05 2007-06 2007-06 2007-07 2007-08 200 7-08 200 7-09 2007-10 2007-10 2007-11 Su cti on (kPa) TEN-S/DBP 1 (y=2m) TEN-S/DBP 3 (y=18 m) Irrometer 2 (y=22.4 m) y=2 m y=18 m y=22.4m 2 1
1 Tensiometer not saturated 2 Infiltration into the sand,
measured by lysimeters
Fig. 7. Evolution of suction over time at the interface between the DBP layer and the CB, 2007
0 2 4 6 8 20 06 -0 5 20 06 -0 6 20 06 -0 8 20 06 -0 9 20 06 -1 0 20 06 -1 1 20 07 -0 1 20 07 -0 2 20 07 -0 3 20 07 -0 5 20 07 -0 6 20 07 -0 7 20 07 -0 9 20 07 -1 0 Su cti on (kPa) ''
72 Moy. mobile sur pér. (TEN-S/G-1) 72 Moy. mobile sur pér. (TEN-S/G-2) 72 Moy. mobile sur pér. (TEN-S/G-3) 72 Moy. mobile sur pér. (TEN-S/G-4)
Moving average over 72 periods (TEN-S/G-1, y=6 m)
Moving average over 72 periods (TEN-S/G-2, y=14m)
Moving average over 72 periods (TEN-S/G-3, y=23m)
Moving average over 72 periods (TEN-S/G-4, y=29m)
(No data was recorded during winter)
0 1 2 3 4 5 6 7 8 0 10 20 30 Su cti on (kPa)
Horizontal length, from the top ( m ) 15-Jun-06 15-Jul-06 15-Aug-06 15-Sep-06 15-Oct-06 15-Jul-07 15-Aug-07 15-Sep-07 ~DL 2006 ~DL 2007
TEN-S/G-1 TEN-S/G-2 TEN-S/G-3 TEN-S/G-4 Irrometer no
4 5 6
WEV (gravel)
0.E+00 1.E-10 2.E-10 3.E-10 4.E-10 5.E-10 0 10 20 30
Horizontal distance from top of the experimental cell (m) LYS GRA-1 2006 LYS GRA-1 2007 LYS GRA-2 2006 LYS GRA-2 2007 LYS GRA-3 2006 LYS GRA-3 2007 Maximum value of data distribution in 2006 is 1.15 x 10⁻⁹m/s Data distribution, 2006 (average standard deviation) Data distribution, 2007 (average standard deviation) Total precipitation April to October
2006: 455 mm / equivalent to 2.5 x10⁻⁸m/s for 7 month
2007: 561 mm /equivalent to 3.0 x10⁻⁸m/s for 7 month
Av er ag e flo w p er co lati ng in th e gr av el (A pr il to Octo ber )
Fig. 10. Average annual flows collected in the lysimeters placed in the gravel layer for 2006 and 2007