DOI: 10.2478/bpasts-2013-0006
A surface engineering approach applicable
to concrete repair engineering
A. GARBACZ
1∗, L. COURARD
2, and B. BISSONNETTE
3 1Department of Building Materials Engineering, Institute of Building Engineering, Warsaw University of Technology, 16 Armii Ludowej Ave., 00-637 Warsaw, Poland
2
ArGEnCO Department, University of Liege, Chemin des Chevreuils, 1 (Bat. B.52), 4000 Liege, Belgium
3
Research Center on Concrete Infrastructure, Civil Engineering Department, Laval University, Qu´ebec, Canada, G1K 7P4
Abstract.The objective of the paper is to analyze the effect of substrate roughness and superficial microcraking upon adhesion of repair systems using concrete surface engineering approach. The results presented in this paper have been obtained within the framework of research projects performed to develop a better understanding of the factors affecting the adhesion of repair materials through a surface engineering approach. Based on the results of investigations, the authors showed that the durability and quality of concrete repairs depend to a large degree on the characteristics of the substrate. Mechanical preparation and profiling of the concrete surface to be repaired has to be balanced with potential co-lateral effects such as superficial cracking, too often induced as a result of inappropriate concrete removal method selection, and the loss of benefits due to better mechanical anchorage. The results obtained confirm also that Concrete Surface Engineering, as a scientific concept, will definitely contribute to shed more light on how to optimize repair bond, taking into account interactions between the materials at different observation scales.
Key words:durability of concrete structure, repair, adhesion, surface roughness, microcracking, surface engineering.
1. Introduction
The deterioration of concrete structures is a major problem in many countries throughout the world. Durability of the structures, maintenance and conservation, repairs and mod-ernization are also important research areas for sustainable development in construction [1–3]. To reach a desired dura-bility of new concrete structures as well as existing struc-tures (repair), three main types of surface concrete quality improvement are considered (formalized also in the European Standard EN 1504) [4]:
• improvement of near-to-surface layer quality by hydropho-bic treatment or impregnation;
• removal of deteriorated concrete and repair with fresh mor-tar;
• application of adhesive coating to improve barrier proper-ties.
Therefore mentioned approach emphasises that the prop-erties of the near-surface layer influence barrier propprop-erties of concrete and in consequence its durability [5, 6]. Such ap-proach shares characteristics with surface engineering com-monly applied to many construction materials like metal al-loys, including nanomaterials, eg. [7, 8]. Surface engineering is defined [7] as a scientific and technological approach relat-ed to the design, the production and the application of surface layers to improve some properties of the substrate, particularly the resistance to corrosion and abrasion, as well as aesthetic properties. Surface engineering covers all phenomena involv-ing a modification of the near-to-surface layer and/or
applica-tion of a coating suitable for a given applicaapplica-tion. In all cases, suitable scientific tools are necessary to characterize proper-ties of layer, quality of substrate and adhesion of coating to substrate.
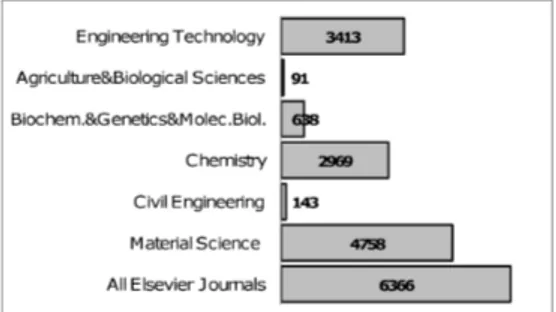
The surface engineering approach is still rarely applied in civil engineering, especially for concrete-like composites in concrete repair engineering (Fig. 1). However, according to the authors, this scientific approach allows to explain phe-nomena underlying durability of repair and anticorrosion pro-tection of concrete structures [9, 10], which directly depend on the adhesion quality. Favorable conditions during the phase of creation of the bond between the substrate and the new lay-er will guarantee the longevity of adhesion and, consequently, of the repair. The high adhesion level creates higher tolerance to some incompatibility between the bonded materials, partic-ularly in the case of concrete-polymer composite repairs on concrete substrate [11, 12].
Fig. 1. Number of papers related to “surface engineering” for differ-ent categories in the ScienceDirect database of all Elsevier journals
2. Definitions of adhesion
The ability of two bodies to associate in order to form an assembly or a composite material, is due to the creation of an interface between these two materials [13]: from a thermody-namic point of view, this means that the work of adhesion is greater than the work of cohesion. In order to find the link between cause and effect, one has to define and to measure exactly the electrical, molecular and atomic forces existing between the materials (Fig. 2) and to evaluate the topogra-phy of the surface. The measured adhesion, eg. by pull-off test, is a quantitative interpretation of the force or the energy necessary to separate the bodies [13]. This lead Sasse [14] to formulate two interpretations of adhesion definitions:
Definition 1. “Forces in the boundary surface, which result in the mutual adhesion of two materials in contact”. This is a qualitative equilibrium problem, which leads to the question: “What is the reason for the attraction between the two ma-terials in contact?” The objective under consideration is the formation of the adhesive bond.
Definition 2. “The fracture stress or another quantified me-chanical characteristic for the resistance against separation of two materials in contact”. This is a quantitative, not equilibrium-related problem, which leads to the question: “Which magnitude has the resistance against separation?” The objective under consideration is the separation of the adhesive bond.
Most theoretical considerations are based upon definition 1 and most experimental investigations use definition 2. Be-sides the “mechanical adhesion” theory (interlocking mechan-ical effects) there are three main “specific adhesion” theories (Fig. 2).
Fig. 2. Principles of adhesion after Ref. 14
In the case of a system created through repair, adhesion depends on many phenomena taking place in the interfacial zone [15, 16]: presence of bond-detrimental layers or inclu-sions (including bleeding), wettability of the substrate by re-pair materials, secondary physical attraction forces (van der Waal forces) induced in the system, surface roughness (in-terlocking mechanism), respective moisture contents in the concrete substrate and repair system (e.g. cement concrete or polymer composite), microcracks left or induced by the sur-face treatment. This implies that there can be very significant
differences between theoretical and experimental strengths ev-idencing about the limits of the classical theories – if defini-tion 2 is considered (Table 1).
Table 1
Theoretical and experimental adhesion strength values compiled from different authors [14]
van der Waal forces Adhesion strength (N/mm 2
) Theoretical technical, experimental permanent dipoles 200–1800
5–20 induced dipoles 40–300
dispersion forces 60–360 hydrogen bonds about 500
According to Silfwerbrand (Table 2), the creation and durability of bond depend on several factors having different degrees of influence, which can be divided into three main groups [17].
Table 2
Factors affecting bond between concrete substrate and repair material (acc. [17]) Factors Importance 1 2 3 Substrate characteristics Substrate properties X Microcracking X Laitance X Roughness X Cleanliness X
Overlay characteristics & application technique
Pre-wetting X Bonding agents X Overlay properties X Placement X Compaction X Curing X Environmental conditions Time X Early traffic X Fatigue X Environment X
The objective of this paper is to analyze the effect of sub-strate roughness and superficial microcraking upon adhesion of repair systems. The results presented in this paper were obtained in the framework of research projects performed at University of Li`ege in Belgium, Laval University in Canada and Warsaw University of Technology in Poland intending to develop a better understanding of the factors affecting the adhesion of repair materials through a surface engineering approach.
3. Surface roughness
3.1. Roughness characterization. The surface treatment of a concrete substrate is important in order to promote me-chanical adhesion [18]. The methods for measuring rough-ness and surface texture can be classified into three types
[19]: contact methods, non-contact (optical) methods, and the taper sectioning method. Among the contact methods there are mechanical profilometers (extensometer-mounted), tactile tests, kinetic friction measuring device, static friction mea-surement, rolling-ball measurements, and measurement of the compliance of a metal sphere with a rough surface. Opti-cal (non-contact) methods include optiOpti-cal reflecting instru-ments, light microscopy, electron microscopy, speckle metrol-ogy, opto-morphology (interferometry) and laser profilometry. Taper sectioning is used in metallurgy and basically consists in cutting across a surface at a low angleα to physically amplify the height of asperities (ctg α). In this paper, the effective-ness, accuracy and field applicability of selected techniques [20–32], which are listed in Table 3, are analyzed.
3.2. Profile description. After treatment, concrete surfaces present fractal topography. As for any fractal object, it is
pos-sible to break up this surface or profile into a sum of sub-profiles [9]. Each sub-profile can be differentiated in terms of wavelengths; there is however no limit or precise criteri-on to validate the decompositicriteri-on process (Fig. 3). It is al-so possible to filter the result mathematically [23]. Using methods with different resolutions, complementary topogra-phy scales can be characterized. The mechanical profilometry method, which has high resolution, reaches surface roughness scales referred to as roughness (R) and waviness (W). The opto-morphological method, with a resolution of 0.2µm, al-lows characterization of roughness scales referred to as meso-waviness (M) and form (F). In mechanical profilometry a dif-ferentiation filtering process based upon the stylus diameter is often used. Then, the vertical and horizontal amplitude de-composition parameters – the most common according to EN ISO 4287 (Table 4) – are calculated. Another useful parameter
Table 3
General characteristics of techniques of roughness evaluation
Technique/reference data Example General characteristics
ICRI Concrete Surface Profiles
[20–22]
Visual evaluation of concrete surface morphology with concrete surface profiles (CSP plaques 03732)
Sand patchtest EN 13036-1 (ASTM E965)
EN 1766
Calculation of surface roughness ratio using diame-ter of sand circle spreading on the surface: SRI=
VSRI d2 SRI · 1272 [mm] Mechanical profilometry [22–24]
A high-precision extensometer is moved all over the surface to obtain a 3-D mapping (x, y, z coordinates); morphological parameters are computed for selected profiles in accordance with EN ISO 4287
Laser profilometry
[25–27]
The elevation (distance from the laser beam source) of each sampling point is calculated on the basis of the laser beam transit time; morphological parame-ters are computed for selected profiles in accordance with EN ISO 4287
Opto-morphometry technique
[28–30]
The observation and analysis of the shadow produced by the superficial roughness of the surface (Moir´e’s fringe pattern principle); morphological parameters are computed for selected profiles in accordance with EN ISO 4287
Microscopic metod [29-32]
The profile parameters are determined with vertical sectioning methods for the profile images registered with a light microscope at given magnification
Fig. 3. Scale effect on profile decomposition after Ref. 22
from surface analysis is the bearing ratio (Fig. 4a), defined as the percentage of profile intercepted by a reference line with a given length. If the bearing ratio is determined on the total height of the profile in a number of interception planes as large as possible, and represented on a graph, the Abbott’s curve is obtained (Fig. 4b). The shape of Abbott’s curve is character-ized by three parameters: relative height of the peaks (Cr),
depth of the profile (Cf), excluding high peaks and holes, and
relative depth of the holes (Cl).
Fig. 4. Illustration of the Abbot’s curve parameters after Ref. 9
Table 4
The vertical and horizontal amplitude parameters most often used for characterization of surface profile acc. to EN ISO 4287 (X = P, W, R for
total, waviness and roughness profiles, respectively) Symbol Parameter Definition
mx mean value and line line whose height (mean val-ue) is determined by minimal sum square deviation of the pro-file defined as follows: X = minP
y2 (x)
Xp max peak height distance between the highest point of the profile and the mean line
Xv max valley depth distance between the lowest point of the profile and the mean line Xt max height maximum distance between the
lowest and the highest point of the profile and it is equal Xt = max (Xp+ Xv)
XaX′a arithmetic mean devi-ation
mean departure of the profile from the refer-ence mean line as follows: Xa = 1 l l Z 0 |y(x)| dx, approxi-mated by X′ a≈ 1 n n P i=1 |yi| Sm mean period of profile roughness
mean value of mean line includ-ing consecutively a peak and a valley Smi, as follows: Sm =
1 n n P i=1 Smi
3.3. Mechanical and laser profilometry. The surfaces of C20/25 concrete slabs were submitted to several surface treatments and evaluated with mechanical (ULg) and laser (WUT) profilometers [33, 34]. The following types of me-chanical treatments were used to prepare the concrete test slabs: grinding (GR), sandblasting (SB), shotblasting (SHB35 and SHB45, with treatment time of 35 and 45 s, respective-ly), hand milling (HMIL) and mechanical (MMIL) milling.
Test slabs without treatment were used as a reference. Sur-face roughness was characterized with the Sand Patch Test and mechanical profilometry using specimens that were saw cut from the plate (Table 5).
Table 5
Concrete surface geometry parameters determined after surface treatment with mechanical and laser profilometers (acc. to [34]) (“s” suffix is corresponding to laser profilometry and “p” is corresponding to mechanical
profilometry)
Method Parameter Surface treatment
GR SB SH35 SH45 HMIL MMIL Laser profilometer (parameters related to surface) Wts[µm] 933 1 130 2 730 3 110 1 300 3 400 Was[µm] 134 156 444 515 127 384 Wvs[µm] 530 571 1 140 1 680 985 2 340 CRS[µm] 234 161 509 960 68 341 CF S[µm] 404 505 1590 3330 409 1460 CLS [µm] 391 218 175 670 340 1112 Ds[–] 2.400 2.370 2.420 2.360 2.340 2.380 Mechanical profilometer (parameters related to profile) Wtp[µm] 219 1 036 1 086 2 165 473 867 Wap[µm] 32 180 215 386 70 179 Wvp[µm] 108 317 516 1009 269 419 CRP [µm] 57 50 289 698 116 188 CF P [µm] 55 77 406 619 107 351 CLP [µm] 69 144 291 669 196 248 Sand Patch SRI [mm] 0.72 1.40 1.59 1.85 0.79 1.05
The results of surface geometry characterization [33, 34] obtained with the two methods can be summarized as follows: • the geometrical parameters determined at microscopic level generally indicate that the highest roughness was obtained after shotblasting for 45 s, and the lowest roughness was obtained by grinding;
• the mean microroughness values are close to each other for the treatment types and the both mechanical and laser pro-filometry methods (Rap= 17±2 µm and Ras= 19±7 µm,
respectively). However, the total height of the roughness profile determined with laser profilometry was 2.8 to 5.5 times longer than the one obtained with mechanical pro-filometry with the same filtering process; this indicates that roughness parameters cannot be used alone to appraise sur-face quality after treatment;
• both the total height and the mean value of the waviness profile measured with the laser profilometer are higher (1.3–4.3 times) than those deduced from the mechanical method. In the case of the Abbott’s curve parameters, the ratio even reached a value of 7 times. Nevertheless, values of these ratios do not correspond to the waviness level. The statistical analysis of the results revealed a high correla-tion coefficient (r > 0.94) of the relacorrela-tionship between the cor-responding mean values of waviness profile,Wa (Fig. 5a) as
well as the Abbott’s parametersCR andCF determined with
laser and mechanical profilometry (Fig. 5b). A higher scat-ter in the results for both profilometry methods is observed in the case of other amplitude parameters. Lower statistical significance (Fig. 5c) is obtained for the total heights of the waviness profile (Wts vs.Wtp) and the maximum depth of
the valleys (Wvs vs. Wvp) as well as the relative depth of
holes,CL (see Fig. 5b). This could be caused by the fact that
different surface areas were scanned with the laser and the mechanical profilometer. However, Figs. 5b and 5c indicate that the low correlation is due to the low values of ampli-tude parameters obtained with mechanical profilometry for the surface after mechanical milling. This surface has high ir-regularities and a significant number of deep and wide cracks. It seems that these cracks might be more easily detected by the laser profilometer than by the mechanical profilometer stylus.
a)
b)
c)
Fig. 5. Relationships between waviness parameters: Wa(a) Abbott’s
(b) and Wt and Wv (c) determined with laser and mechanical
pro-filometry; suffixes “p” and “s” for mechanical and laser profilometers respectively (acc. to Ref. 34)
3.4. Microscopic method. Concrete surface geometry can be characterized using a scientific approach referred to as quantitative fractography [35, 36]. Although its use is more
advanced in the case of metals and ceramics than in cement-based composites, geometrical and stereological parameters are also of significant importance in the latter [37–40]. These parameters can be determined from the image of a concrete sample cross-section (formed or taken on site) obtained with a microscope, usually a light microscope. In addition to the profile parameters determined in accordance with EN ISO 4287, the three following stereological parameters could be considered for characterization of concrete profiles after sur-face treatment [33, 34]:
• profile (linear) roughness ratio, RL = L/LO: length of
the profile line, L, divided by the projected length of the profile line,LO;
• surface roughness ratio, RS = S/SO: true fracture surface
area,S, divided by the apparent projected area, SO;
• fractal dimension, D: a measure of the self-similarity of rough objects. The basic requirement for the fractal bound-ary is that some structural feature or unit is sequentially repeated at different levels.
The stereological parameters: surface roughness ratio,RS,
and profile roughness ratio,RL were calculated using a
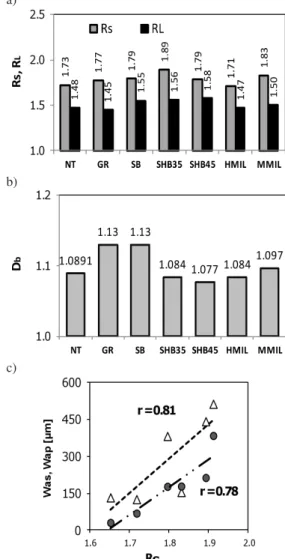
com-puter program (Profile 1.1) developed at Warsaw Universi-ty of Technology for automatic profile image analysis [30]. The fractal dimension was calculated with the same program using box-counting method (Db). The histograms indicate
that shotblasting and mechanical milling produced surface with high irregularity (Fig. 6a,b). The values of fractal di-mension,Db determined with the microscopic method were
highest for grinding and sandblasting and in general close to values for typical for concrete surfaces: D = 1.03–1.25 [30, 37–40]. Range of changes of Db values is higher in
comparison with the surface fractal dimension,DS, obtained
with laser profilometry. The low scattering of DS value is
caused by measurements for surface area with relatively low irregularity. However, the values obtained ofDS are higher
than the values that have been determined for fracture sur-faces (DS = 2.02–2.3) of various types of concretes [31,
38, 39] and close to those determined for, e.g. steel after surface treatment by grinding [25]. On the basis of the re-sults of fractal measurements with mechanical and laser pro-filometer, it can be concluded that fractal dimension is not an adequate parameter for appraisal of concrete surface geo-metry.
Relationship betweenRs andWas andWap had
relative-ly low correlation coefficient –r close to 0.8. This can be explained by the fact that stereological parameterRswas
cal-culated for longer profile length compared to profile length of sample tested with laser profilometer. The relationship be-tweenRS andRL for concrete substrates after various
treat-ments can be described by the equation:RS ≈ 1.46RL−0.42,
with a high correlation coefficient (r > 0.998). This equation is close to the estimation provided by Wright and Karlsson [40] for non-planar localized surfaces:RS ≈ 1.57RL− 0.57,
often used in the fracture analysis of cement concrete (e.g. Brandt and Prokopski [37], Stroeven [41]).
a)
b)
c)
Fig. 6. The stereological parameters of tested concrete substrates: a) RS and RL, b) Db for concrete substrates after various surface
treatments and c) the relationships RS= vs. arithmetic mean
devia-tion of waviness profile determined with laser (Was) and mechanical
(Wap) profilometer
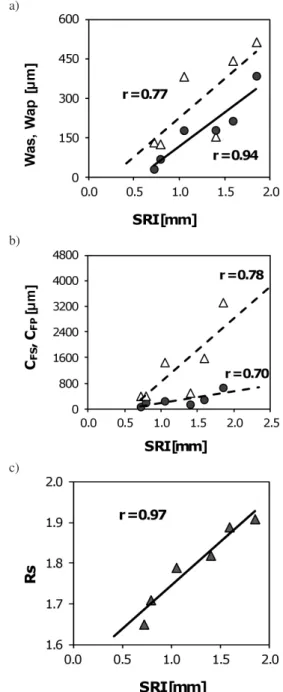
3.5. Sand patch test. The sand patch tests described in EN 13036-1:2002 (very similar to ASTM E965) is one of the most commonly used method for evaluation of concrete macrotex-ture surfaces and it is generally used on roadway and airfield pavements. The main advantages of the sand patch method are its speed, non-destructive character, and field applicabil-ity. However it is necessarry to provided that the surface is protected from wind and rain. The biggest limitations are the range of validity (from 0,25 to 5,00 mm) and applicability to horizontal surfaces only. Figures 7a and b present a com-parison between SRI (Surface Roughness Index) values and parameters determined using more sophisticated profilome-try techniques: an equivalent correlation exists between the mean waviness obtained by means of the two profilometry techniques and SRI, respectively. Similar conclusions may be given for Abbott’s curve parameters (Fig. 7b). The relationship between Rs and SRI exhibits a very high correlation coeffi-cient r = 0.97 (Fig. 7c). This confirms that SRI is a good estimation of the mean deviation of a concrete surface
pro-file and that it can be used for practical evaluation of surface roughness.
a)
b)
c)
Fig. 7. Surface Rough Index vs.: a) arithmetic mean of waviness, b) Abbott’s parameters and c) RS ratio; (p,∆) and (s, •) for
me-chanical and laser profilometers
3.6. Optical profilometry. Optical profilometry based on Moir´e’s fringe pattern is an interferometric method used to obtain 3D profile information based on the interference be-tween light and shade stripes [22]. A so-called Moir´e pattern occurs when two similar repeating patterns are almost but not quite superimposed. The basic advantage of this method is its non-destructive character and field measurement capabilities. The operating principle of the method is based on the com-parison between two images having different Moir´e’s patterns: the first serves as the reference (image of the pattern with non-deformed parallel fringes), while the second is the projected
pattern deformed in accordance with the surface profile. The reference and deformed grids are compared and analyzed us-ing an algorithm that computes the actual 3D surface profile. Research programs were conducted recently to analyze on a comparative basis the profile characteristics yielded with this method together with those obtained with optical profilome-try, visual method (with concrete surface profile plates) and mechanical profilometry.
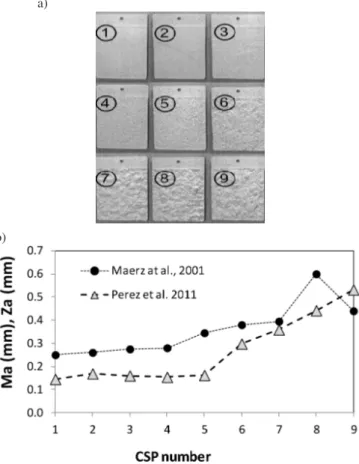
Comparison with a visual method. The nine concrete surface profile rubber templates (CSP), used as a reference for surface preparation before the installation of protective systems, were developed by the International Concrete Repair Institute (ICRI) for rapid on-site visual assessment of rough-ness [20]. Right now, for most field applications, the CSP templates are likely to be the only accessible tool to evalu-ate the concrete surface profile after preparation. The surface geometry characteristics of these templates were determined with the optometric method using a 512 × 512-pixel CDD camera. The optical device used in this study could reach a resolution of 200µm in Z dimension, for a scanning surface area of 350 × 350 mm. The measurement path was equal to 500µm; the depth of field is 450 µm. Because of the verti-cal resolution of the device, it is not possible in this case, to separate roughness from waviness. A profile obtained through this approach will consequently give the description of meso-waviness and global form.
Figure 8 shows that the optometric device is not able to detect any change in terms of roughness level under a thresh-old CSP (no. 5) value corresponding to the optometric de-vice vertical resolution. Nevertheless, above that value, the optometric method accurately reproduces the surface rough-ness level in accordance with the CSP scale. Based on the relationship observed in Fig. 8 between the CSP index and the arithmetic deviation of meso-waviness profile,Ma
(with-in the resolution range of the device), it seems possible to significantly improve the CSP replicate system through a real quantitative approach. In addition, the actual CSP templates are rather narrow with regards to the spectrum of concrete surface profiles that can be obtained depending on the sur-face preparation technique that is used. The identification of
referencecurves similar to that plotted on the graph of Fig. 8, but on a wider scale of surface roughness, help widening the range of application of the method to much coarser profiles such as those obtained eg. with jack hammering and water jetting.
A similar investigation was conducted by Maerz et al. 2001, using this time a laser device [21]. Using laser striping, a rough concrete surface was illuminated with thin slits of red laser light at an angle of 45˚, and the surface is observed at angle of 90˚. The projected slit of light appears as a straight line if the surface is flat, and then as a progressively more ondulating line as the degree of roughness of the surface in-creases. Lasers with one, five or eleven stripes were studied and a high-resolution CCD camera with a 7.5-mm lens was used for recording the line images. A bandpass filter was in-stalled over the camera lens to discard both high frequency
and low frequency light and to allow only the laser light to get through to the camera. Using a specially developed comput-er program, they calculated the root mean square of the first derivative of the profile as a single parameter characterizing a profile based on its average slope:
Za = v u u t 1 n(dx)2 n X i=1 (dy)2
wheren – number of evenly spaced sampling points; dx – dis-tance between points along the sampling line;dy – distance between points normal to the sampling line.
a)
b)
Fig. 8. View of ICRI CSP plaques for evaluation of concrete surface roughness (a) and (b) relationship: arithmetic mean deviation Ma
calculated by Perez et al. (Ref. 22) and root mean square of the first derivative of the profile Za calculated by Maerz et al. (Ref. 21) for
CSP plaques
The results showed the same trend as that found by Perez et al. – i.e. the device could not detect any changes in rough-ness level under a threshold CSP (in this case no. 4). For the high-range CSP values, the trend was not as clear. Howev-er, as CSP number increased the value ofZa increased too
[34–45].
Comparison with a mechanical profilometer.The con-crete mixture selected to cast the test specimens (substrate) for the purpose of this study is a 0.40 w/c concrete (10-mm max-imum size aggregate) used as a reference material in many on-going research projects conducted at Laval University in
relation with repair and rehabilitation [42]. Three types of surface preparation techniques were investigated: scarifying, high pressure water jetting (1240 bar pressure and 23 l/h water flow) and polishing (obtained with two abrasive and rotative wearing plates). There were tested with the device described in p.3.6.1. The sample were also tested at University of Liege with mechanical profilometer using the same device and pro-cedure like in the case of tests presented in p.3.3. On the basis of the results obtained the following conclusions could be drawn:
a) the use of such mechanical technique to evaluate the pro-files of concrete has some important limitations:
– stylus (extensometer tip): because of the lenght of the stylus, it is impossible to make measurements on very rough surfaces eg. prepared by hydro-jetting; – air bubbles: some of the entrapped air voids in
con-crete are so large that the stylus gets stuck into it and the automatic measuring procedure is suddenly inter-rupted; the selection of the zone to be mapped is very important;
– dimensions: accurate evaluation of roughness para-meters is quite time-consuming and it is the reason why the surface of investigation is limited; moreover, this system is not usable on site.
b) with regards to optical profilometry techniques, it can be stated that:
– vertical resolution: with the device used in the study reported by Perez et al., it was impossible to evaluate micro-roughness and waviness; nevertheless, recent developments enable to characterize roughness down to that level;
– air bubbles: future version of algorithm, based on im-age analysis, will be able to remove air or water bub-ble in order to obtain real roughness;
– this method presents a lot of practical advantages. It is very handy: it is not necessary to core the surface, it is possible to perform field measurement with great precision.
It can be pointed out that value of the microroughnessRa
after treatment of approximately 15µm was recorded. This is close to the values determined with the same procedure for previously tested concrete (see Table 5) This tends to confirm that the surface treatment technique has no major influence on micro-roughness (“high frequency waves”) of the profile and that waviness parameters are more effective for appraisal of concrete surface texture.
3.7. Pull-off strength vs. surface roughness. Pull-off strength was determined for specific repair systems placed on substrates with different surface roughness characteristics, with and without a bonding agent. The pull-off test results were analyzed statistically as a function of the surface rough-ness parameters to identify possible relationships. The rela-tionships between the pull-off strength and SRI (describing
surface roughness at the “macroscopic” level), waviness pa-rameterWap, and surface roughness ratioRS, describing the
surface roughness at “microscopic” level were not statistically significant for both types of overlay systems, i.e. with (∆) and without (O) bonding agent (Fig. 9). Some trends could howev-er be obshowev-erved: for systems placed with a bonding agent, the pull-off strength slightly increases as the surface roughness in-creases. An opposite trend for systems without bonding agent was observed. This can be explained by the fact that the repair mortar that was used had relatively low workability (partially due to fibre content) and could not wet adequately the sub-strate (Fig. 9). Given its much better workability, the bonding agent could penetrate the surface irregularities and really wet the substrate surface. This indicates that, besides the surface roughness, the ability of the repair material to adequately wet the substrate is a very important factor with regard to adhesion in repair systems.
a)
b)
c)
Fig. 9. Relationships between the pull-off strength vs. the mean val-ue of waviness profiles determined with a) laser and b) mechanical profilometry and c) the surface roughness ratio Rs; repair systems
with (∆) and without (•) bond coat
As mechanical interlocking is one of the basic mecha-nisms of adhesion between hardening mortar and concrete and existing hardened concrete, it is fundamental to be able to characterize the substrate “roughness”. Depending on the structure configuration and size, the nature of the work to be performed and the local construction / repair customs, a vari-ety of surface treatments can be used and, as a consequence, a rather wide spectrum of surface roughness can be induced [34]. However, the statistic parameters cannot be univocally related to adhesion of the overlay. It seems that there is a threshold value, over which an increase in roughness of the profile does not necessarily translate into an increase in ad-hesion [10, 33]. Moreover, an increase in roughness may be obtained with some techniques at the expense of superficial cohesion or integrity (Fig. 10).
Fig. 10. Pull-off strength versus Surface Roughness Index (SRI) de-termined with sand patch test for concrete substrate after different surface treatments repaired with polymer-cement mortar after Ref. 10
4. Microcracking and adhesion
The main problems arise from co-lateral effects of the treat-ment, especially due to micro-cracks parallel to the surface [43]. Superficial cracking, often referred to as “bruising”, is considered as one of the most important parameters influenc-ing adhesion in repair system. The respective influence of the various surface preparation techniques can be evaluated by microscopic observation of the prepared surface (Table 6).
Using light microscope the number and length of mi-crocracks have been systematically recorded for a range of substrate concrete strengths and surface preparation methods. Analysis of the results shows that low pressure water jetting does not generate microcracks. Scabbling may induce a big amount of microcracking in very near-to-surface area. The number of cracks and the total crack length resulting from the preparation with jack-hammer are significantly higher than with any other of the investigated techniques. It is also clear that increasing the jackhammer weight – and thus, its impact energy – causes both the length and the number of cracks to increase significantly (Fig. 11).
Application of polymer primer or polymer modified ce-ment bonding agents usually improve the interface quality due to strengthening of concrete substrate by gluing microcracks and to some degree, loose substrate concrete particles [33, 44, 45]. However, in field conditions, it is not easy to guar-antee adequate and reproducible conditions for the placement of repair materials on the coated substrate.
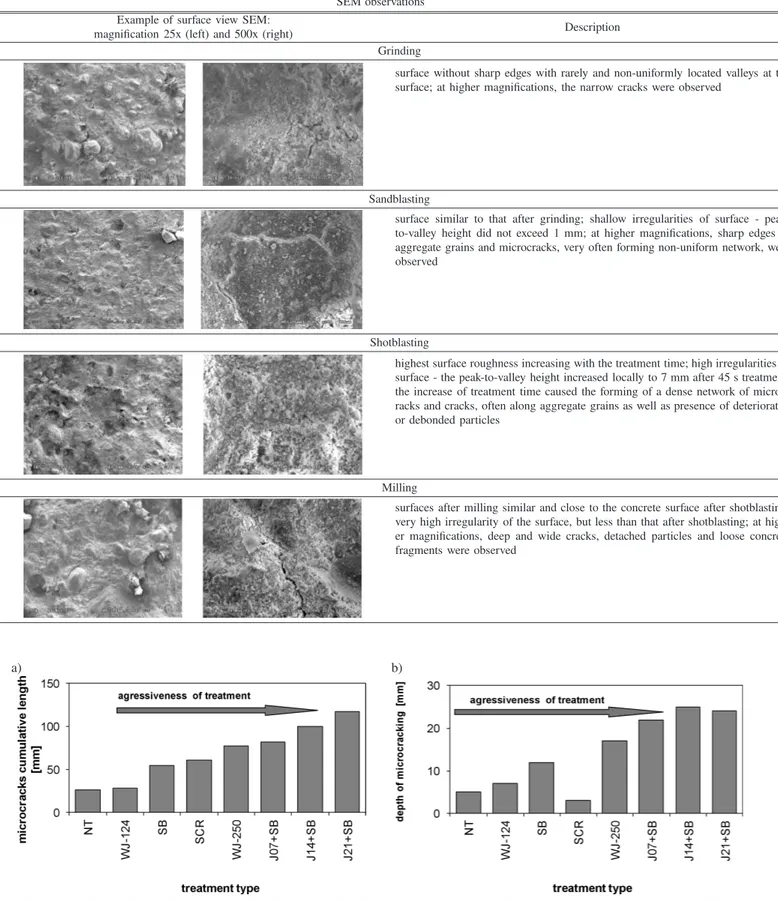
Table 6 SEM observations Example of surface view SEM:
magnification 25x (left) and 500x (right) Description
Grinding
surface without sharp edges with rarely and non-uniformly located valleys at the surface; at higher magnifications, the narrow cracks were observed
Sandblasting
surface similar to that after grinding; shallow irregularities of surface - peak-to-valley height did not exceed 1 mm; at higher magnifications, sharp edges of aggregate grains and microcracks, very often forming non-uniform network, were observed
Shotblasting
highest surface roughness increasing with the treatment time; high irregularities of surface - the peak-to-valley height increased locally to 7 mm after 45 s treatment; the increase of treatment time caused the forming of a dense network of microc-racks and cmicroc-racks, often along aggregate grains as well as presence of deteriorated or debonded particles
Milling
surfaces after milling similar and close to the concrete surface after shotblasting; very high irregularity of the surface, but less than that after shotblasting; at high-er magnifications, deep and wide cracks, detached particles and loose concrete fragments were observed
a) b)
Fig. 11. Length (Li) of the cracks (a) and depth of microcracking (b) vs type of concrete surface treatment: NT – no treatment; WJ – water jetting – pressure 124 psi/250MPa; SB – sandblasting; SCR – scabbling; J+SB – jack hammering of weight 7,14,21 kg + sandblasting after
5. Conclusions
The investigations reported in the recent years, have shown that the durability and quality of concrete repairs depend to a large degree on the characteristics of the substrate. Mechan-ical preparation and profiling of the concrete surface to be repaired has to be balanced with potential co-lateral effects such as superficial cracking, too often induced as a results of inappropriate concrete removal method selection, and the loss of benefits due to better mechanical anchorage.
Recently, various techniques have become available for the characterization of concrete surface texture. The combi-nation of different methods enable to have a very good de-scription of “roughness” at various scales. Depending on what has to be analysed, mechanical and laser profilometers are more accurate for “micro”, while optical method seems to give a better description of the shape of the profile. However, investigations with very precise laboratory laser and mechan-ical profilometers of concretes surfaces after various treat-ments in terms of their aggressiveness clearly indicated that the surface treatment technique has no major influence on the micro-roughness (“high frequencies waves”). This allow to conclude that waviness parameters are enough for the as-sessment of concrete surface prior to repair. This shows the usefulness of recently developed optical method eg. based on Moir´e pattern. The main advantages are the rapidity of the procedure and the large area that can be observed in one op-eration.
Very little is known about the potentially synergetic ef-fects between the various concrete surface parameters (surface roughness, microcracking, wettability) affecting the ability of the surface to be bonded with a repair material. Concrete sur-face engineering, as a scientific concept including all sursur-face properties of materials and their influence on adhesion, will definitely contribute to shed more light on how to optimize repair bond, taking into account interactions between the ma-terials at different observation scales.
Acknowledgements.The research projects were supported by the scientific cooperation program between foreign agencies of Wallonia-Brussels International (Belgium), Qu´ebec (Cana-da) and (MNiSW) Poland. The paper was elaborated within the framework of ACI, the ICRI grant Development of Spec-ifications and Performance Criteria for Surface Preparation Based on Issues Related to Bond Strength. In the case of A. Garbacz the work has been supported by the European Union within the framework of European Social Fund trough War-saw University of Technology Development Programme.
The authors are thankful to Professor L.Czarnecki, Sci-entific Secretary of Building Research Institute (ITB) for his valuable discussion and remarks.
REFERENCES
[1] L. Czarnecki and M. Kaproń, “Sustainable construction as a research area”, Int. J. Society of Materials Eng. for Resources, 17 (2), 99–106 (2010).
[2] L. Czarnecki, A.M. Vaysburd, N.P. Mailvaganam, P.H. Em-mons, and J.E. McDonald, “Repair and rehabilitation of struc-tures – some random thoughts”, Indian Concr. J. 74, 13–20 (2000).
[3] D. Van Gemert and A.-S. Poupeleer, “Actual research and im-plementation of sustainable construction materials and tech-niques”, Proc. 4th Int. Conf. on Materials for Resources 1, 77–81 (2001).
[4] L. Czarnecki and P. Łukowski, “Polymers in concrete repairing according to EN 1504”, CD Proc. ESPSC 2011 – Czarnecki
Symposium1, 242–249 (2011).
[5] A.E. Long, G.D. Henderson, and F.R. Montgomery, “Why as-sess the properties of near-surface concrete”, Constr. Build
Mater.15, 65–79 (2001).
[6] L. Courard and A. Garbacz, “Failure of concrete repair: how to avoid it?”, RILEM PRO 51: Proc. 2nd Int. Symp.on
Ad-vances in Concrete through Science and Eng. 1, 167–191
(2006).
[7] T. Burakowski and T. Wierzchoń, “Surface engineering of metals. Principles. Equipment. Technology”, CRC Press, New York, (1999).
[8] H. Garbacz, P. Wiecinski, and M. Ossowski, “Surface engineer-ing techniques used for improvengineer-ing the mechanical and tribo-logical properties of the Ti6A14V alloy”, Surface & Coatings
Technology202 (11), 2453–2457 (2008).
[9] L. Courard, F. Michel, D. Schwall, A. Van der Wielen, A. Gar-bacz, T. Piotrowski, F. Perez, and B. Bissonnette, “Surfolo-gy: concrete substrate ev aluation prior to repair”, Materials
Characterization: Computational Methods and Experiments
IV, 407–416 (2009).
[10] L. Czarnecki, L. Courard, and A. Garbacz, “Application of surface engineering methods towards evaluation of concrete repair efficiency”, Eng. and Construction 12, 630–634 (2007), (in Polish).
[11] L. Czarnecki, A. Garbacz, P. Łukowski, and J.R. Clifton, “Poly-mer composites for repairing of portland cement concrete: compatibility project”, NISTIR 6394, CD-ROM (1999). [12] L. Courard and B. Bissonnette, “Compatibility performance
as a fundamental requirement for the repair of concrete struc-tures with self-compacting repair mortars”, RILEM PRO 54:
Proc. 5th Int. Symp. on Self-Compacting Concrete1, 667–675
(2008).
[13] A.J. Kinloch, “Adhesion and adhesives”, in Science and
Tech-nology, Chapman and Hall, London, 1987.
[14] R.H. Sasse, “Polymer adhesion to concrete – theories and en-gineering aspects”, in Adhesion in Interfaces of Building
Ma-terials: a Multi-Scale Approach,pp. 7–20, AMSR, Aedificio
Publishers, New York, 2007.
[15] L. Courard, “Parametric study for the creation of the inter-face between concrete and repair products”, Mater. Struct. 33, 65–72 (2000).
[16] L. Czarnecki and B. Chmielewska, “Factors affecting adhe-sion in building joints”, Cement. Lime. Concrete. 2, 74–85 (2005).
[17] J. Silfwerbrand, “Improving concrete bond in repaired bridge decks”, Concrete Int. 12 (9), 61–66 (1990).
[18] U. Trende and O. B¨uy¨uk¨ozt¨urk, “Size effect and influence of aggregate roughness in interface fracture of concrete compos-ites”, ACI Materials J. 95 (4), 331–338 (1998).
[19] ASME American National Standard, Surface Texture,
Wavi-ness and Lay, ASME, New York, 1978.
[21] H. Maerz, P. Chepur, J. Myers, and J. Linz, “Concrete rough-ness characterization using laser profilometry for fiber- rein-forced polymer sheet application”, TRB 80th Annual Meeting 01-0139, CD-ROM (2001).
[22] F. Perez, B. Bissonnette, and L. Courard, “Combination of me-chanical and optical profilometry techniques for concrete sur-face roughness characterization”, Mag. Concrete Res. 61 (6), 389–400 (2009).
[23] L. Courard and M. N´elis, “Surface analysis of mineral sub-strates for repair works: roughness evaluation by profilometry and surfometry analysis”, Mag. Concrete Res. 55 (4), 355–366 (2003).
[24] L. Courard, A. Garbacz, and M. Gorka, “Concrete surface treatments quantification by means of mechanical profilom-etry”, Proc. 11th ICPIC 1, 125–132 (2004).
[25] V. Liubimov and K. Oczoś, Geometrical Structure of Surface, Rzeszow University of Technology, Rzeszów 2003, (in Po-lish).
[26] A. Garbacz and K. Kostana, “Characterization of concrete sur-face geometry by laser profilometry”, in Adhesion in Intersur-faces
of Building Materials – a Multi-scale Approach, pp. 147–157,
AMSR, Aedificio Publishers, New York, 2007.
[27] K. Fukuzawa, M. Mitsui, and T. Numao, “Surface roughness indexes for evaluation of bond strengths between CRFP sheet and concrete”, Proc. 10th ICPIC 12, CD-ROM (2001). [28] L. Courard, D. Schwall, and T. Piotrowski, “Concrete surface
roughness characterization by means of opto-morphology tech-nique”, in Adhesion in Interfaces of Building Materials – a
Multi-scale Approach, pp. 107–116, AMSR Aedificio
Publish-ers, New York, 2007.
[29] M. Siewczyńska, “Effect of selected properties of concrete on adhesion of protective coating”, Ph.D. Thesis, Poznań Univer-sity of Technology, Poznań, 2008.
[30] L. Czarnecki, A. Garbacz, and J. Kurach, “On the characteri-zation of polymer concrete fracture surface”, Cement Concrete
Comp.23, 399–409 (2001).
[31] M.A. Issa and A.M. Hammad, “Assessment and evaluation of fractal dimension of concrete fracture surface digitized image”,
Cement Concrete Res. 24, 325–334 (1994).
[32] M.D.S. Santos and E.N.B.S. J´ulio, “Comparison of methods for texture assessment of concrete surfaces”, ACI Materials J. 107 (5), 434–440 (2010).
[33] A. Garbacz, M. Gorka, and L. Courard, “On the effect of con-crete surface treatment on adhesion in repair systems”, Mag.
Concrete Res. 57, 49–60 (2005).
[34] A. Garbacz, L. Courard, and K. Kostana, “Characterization of concrete surface roughness and its relation to adhesion in repair systems”, Mater. Charact. 56, 281–289 (2006). [35] V.E. Saouma and C.C. Barton, “Fractals, fractures, and size
effects in concrete”, J. Eng. Mech. 120, 835–854 (1994). [36] A. Yan, K-R. Wu, D. Zhang, and W. Yao, “Influence of
con-crete composition on the characterization of fracture surface”,
Cement Concrete Res.25, 153–157 (2003).
[37] K.J. Kurzydłowski and B. Ralph, Quantitative Description of
Microstructure, CRC, New York, 2003.
[38] E.E. Underwood, “Stereological analysis of fracture roughness parameters”, Acta Stereol. 6, 170–178 (1987).
[39] A.M. Brandt and G. Prokopski, “On the fractal dimension of fracture surfaces of concrete elements”, J. Mater. Sci. 28, 4762–4766 (1993).
[40] K. Wright and B. Karlsson, “Topographic quantification of non-planar localized surfaces”, J. Micros. 130 (1), 37–51 (1983).
[41] P. Stroeven, “A stereological approach to roughness of fracture surface and tortuosity of transport paths in concrete”, Cement.
Concrete. Comp.22, 331–341 (2000).
[42] L. Courard, F. Perez, B. Bissonnette, M. Górka, and A. Gar-bacz, “Two different techniques for the evaluation of concrete surface”, CD Proc. ICCRRR 2005 1, CD-ROM (2005). [43] B. Bissonnette, L. Courard, A. Vaysburd, and N. B´elair,
“Con-crete removal techniques: influence on residual cracking and bond strength”, Concrete Int. 28 (12), 49–55 (2006).
[44] S.N. Pareek, Y. Ohama, and K. Demura, “Adhesion mechanism of ordinary cement mortar to mortar substrates by polymer dis-persion coatings”, Proc. 6th ICPIC 1990 1, 442–449 (1990). [45] J. Pretorius and D. Kruger, “The influence of surface roughness
on the bond strength of concrete repairs”, Proc. 10th ICPIC