Contents lists available atScienceDirect
Urban Forestry & Urban Greening
journal homepage:www.elsevier.com/locate/ufugTree diversity and structure on green space of urban and peri-urban zones:
The case of Lubumbashi City in the Democratic Republic of Congo
Yannick Useni Sikuzani
a,b,⁎, François Malaisse
c, Sylvestre Cabala Kaleba
a,
Augustin Kalumba Mwanke
a, Amisi Mwana Yamba
d, César Nkuku Khonde
e, Jan Bogaert
c,
François Munyemba Kankumbi
a,baEcology, Ecological Restoration and Landscape Unit, Faculty of Agricultural Sciences, University of Lubumbashi, Lubumbashi, Democratic Republic of Congo bCenter of Competence in Planning and Urban Management, University of Lubumbashi, Lubumbashi, Democratic Republic of Congo
cBiodiversity and Landscape Unit, Gembloux Agro-BioTech, University of Liège, Gembloux Belgium dFaculty of Sciences, University of Lubumbashi, Lubumbashi, Democratic Republic of Congo
eFaculty of Arts and Human Sciences, University of Lubumbashi, Lubumbashi, Democratic Republic of Congo
A R T I C L E I N F O
Handling Editor: Peter Duinker Keywords:
Floristic inventory Woody green spaces Urban-rural gradient Plant diversity Lubumbashi
Democratic Republic of Congo
A B S T R A C T
Urbanisation generally causes a number of ecological problems, mostly associated with loss or degradation of green spaces. In the city of Lubumbashi (Democratic Republic of Congo), not only the health of the local ve-getation has been profoundly affected due to an accelerated and uncontrolled spatial dynamics, but decision-makers and planners are also short of data likely to maximise the environmental benefits provided by woody green spaces. Hence, this study was designed to characterize the plant diversity and structure of woody green spaces in Lubumbashi. The study area was divided into urban and peri-urban zones, with respect to the urba-nisation level, and data were collected utilising a circular plots-based inventory. Sixty species of trees and shrubs, belonging to 22 families, were recorded. The considered woody green spaces are dominated by miombo woodland species, but Acacia auriculiformis remained the most common species. This study suggest the existence of tree and shrub species that are typical of the urban zone and the peri-urban zone. Comparatively however, the average diameter and the basal area of trees were significantly higher in the urban woody green spaces, which seems to suggest more old trees in urban zone. Both urban and peri-urban zones had a reverse-J-shaped size class profile, with a slight jump in the largest size class. The peri-urban woody green space had more small stems, but not markedly so, and recruitment was observed in both zones. Current results are important as they may in formulating guidelines and technical tools in assessing and monitoring the degradation of woody green spaces in the city of Lubumbashi.
1. Introduction
Built-up areas and associated impervious areas cover only 1% of the world’s terrestrial surface (Liu et al., 2014). Surprisingly, they are in-habited by 54% of the world’s population, which is projected to reach 60% in 2030 due to economic and political progress (United Nations, 2016). In the cities of certain developed countries, the urban population might stabilise, or even slightly decrease, the rate of growth being faster in developing countries (Kestemont et al., 2011), which are expected to support 95% of the urban population growth by 2050. These increasing
urban populations rely on vegetation to provide ecosystem services (Millenium Ecosystem Assessment, 2005), contributing not only to ecological functioning, but also to the quality of the life and health of the urban residents (Bolund and Hunhammar, 1999; Tzoulas et al., 2007). Indeed, in urbanised areas, green spaces can moderate the urban heat island effect (Kong et al., 2014), ensure energyflow (McPherson and Rowntree, 1993), clean the air and water (Nowak and Heisler, 2010;Gromke and Blocken, 2015), offer recreational opportunities to the urban dwellers, economic benefits (Song et al., 2017), physical and psychological well-being (Maas et al., 2006).
https://doi.org/10.1016/j.ufug.2019.03.008
Received 27 August 2018; Received in revised form 11 March 2019; Accepted 11 March 2019
⁎Corresponding author at: Ecology, Ecological Restoration and Landscape Unit, Faculty of Agricultural Sciences, University of Lubumbashi, Lubumbashi,
Democratic Republic of Congo.
E-mail addresses:[email protected],[email protected](Y. Useni Sikuzani),[email protected](F. Malaisse), [email protected](S. Cabala Kaleba),[email protected](A. Kalumba Mwanke),[email protected](A.M. Yamba), [email protected](C. Nkuku Khonde),[email protected](J. Bogaert),[email protected](F. Munyemba Kankumbi).
Available online 12 March 2019
1618-8667/ © 2019 Elsevier GmbH. All rights reserved.
Unfortunately, urbanisation has transformed the world’s landscapes, resulting in a series of ecological and environmental problems (Liu et al., 2014). Most of the environmental impacts of urbanisation are associated with loss or degradation of green space (Zhou and Wang, 2011). In the developed world, large-scale urban agglomerations and extended peri-urban settlements have fragmented the green spaces to a point where various ecosystem processes are being seriously threa-tened; although, in peri-urban areas, such ecosystem fragmentation may be offset by urban-led demands for conservation and recreational land use (Lambin et al., 2001;Bogaert et al., 2015). In addition, the rapid and unplanned expansion of cities in developing countries en-croaches on and degrades the vegetation in peri-urban zones, which are considered to be the exogenous edge zones of urban areas (Bogaert et al., 2015). This consequently raises issues concerning the sustainable provision of ecosystem services, such as recreation and fruits provision (Shackleton et al., 2014;Etshekape et al., 2018). Areas of (public) green spaces are often very rare in the cities of developing countries, parti-cularly in sub-Saharan Africa, estimated as occupying less than 11% of the total urbanised areas in several cities (Fanan et al., 2011;Mensah, 2014), though exceptions could be mentioned for some South African cities where more than half of the urban areas would be considered as green if all green spaces were included (not just public) (Shakleton et al., 2018). The increasing replacement of green spaces by anthro-pogenic structures in cities not only leads to biodiversity loss, but also hinders contact with nature (Mensah, 2014;Sampaio et al., 2018;Song et al., 2017). Green spaces, comprising plants in parks/squares, gar-dens, nurseries, green buffer zones, roadside green spaces, attached green spaces, informal green spaces, playgrounds, wetlands, pastures, cemeteries andfields, have important ecological and socioeconomical functions (Kong and Nakagoshi, 2005; LaRosa and Privitera, 2013; Useni et al., 2018a). In particular, woody green spaces are valuable for their multiple ecosystem services, encompassing regulation of water flows and urban climates, reduction of noise levels, and provision of nutritional services (Bolund and Hunhammar, 1999; Nagendra and Gopal, 2010; Ortega-Alvarez et al., 2010; Shakleton et al., 2015; Etshekape et al., 2018).
Although studies on shrubs and trees in urbanised areas are emer-ging in developing countries, the literature generally highlights the need for more insights into woody green spaces (Nagendra and Gopal, 2011; Mensah, 2014;Useni et al., 2018a), notably aspects related to their better management (du Toit et al., 2018). However, woody green spaces are present in peri-urban zones, and also in urban zones, de-pendent on the ecological context of the region and the history of the urban planning process (Shackleton et al., 2014) as is the case of Lu-bumbashi, the second largest demographic and economic city in the Democratic Republic of Congo (DRC).
Since the creation of Lubumbashi in 1910, its population has in-creased steadily due to strong natural growth and rural exodus (Nkuku and Rémon, 2006). According to theUnited Nations (2016), the size of its population increased from 6000 in 1910 to more than two million in 2015. Past and recent urbanisation trends in Lubumbashi have high-lighted the existence of different types of green spaces (Leblanc and Malaisse, 1978;Useni et al., 2018a), some of which have trees occu-pying one-third or more of the area and are consequently called woody green spaces herein. Lubumbashi, due to an accelerated and unplanned spatial urban growth (Useni et al., 2018b), generated adverse effects on these woody green spaces (Useni et al., 2018a, 2018c) that are de-stroyed when built-up widening takes place (Munyemba and Bogaert, 2014). Although small projects have emerged, in the form of refor-estation of arterial tree plantations in some municipalities of Lu-bumbashi (Useni et al., 2018c), they have not been properly integrated into a city-wide plan. Consequently, other types of woody green spaces are at risk of disappearance (Leblanc and Malaisse, 1978;Bruneau and Pain, 1990; Nkuku and Rémon, 2006). The management of woody green spaces in the city of Lubumbashi remains neglected, with docu-ments and information scattered among both public services and the
private owners (Useni et al., 2018a).
Despite evidence of the critical role played by trees in Lubumbashi city, urban planners and decision-makers have often undervalued the role played by street trees. This deficiency in understanding of plant diversity and structure in (peri-)urban parks makes it very challenging to plan strategies for urban conservation. This study made an inventory of tree diversity and structure on woody green spaces in order to evaluate their ecological potential at the urban landscape scale. The working hypothesis was that thefloristic and sylvicultural character-istics of woody green spaces, in the urban zone would be different from those in the peri-urban zone. This hypothesis was subdivided into three sub-hypotheses: (i) the density and basal area of the trees and shrubs in urban green spaces are greater than those in peri-urban green spaces as a result of marked fragmentation (Useni et al., 2017b); (ii) an increase in the number of tree species is expected to increase from urban to peri-urban zones according to the intermediate distperi-urbance hypothesis (Rija et al., 2014); (iii) the greater understory abundance, that is a response to opening of the canopy in peri-urban woody green spaces particularly, would enhance the process of plant recruitment (Rakotandrasoa et al., 2013).
2. Materials and methods
2.1. Study area: urban and peri-urban zone of Lubumbashi city
Lubumbashi is located in the south-east of the DRC (11°27′ to 11°47′S and 27°19′ to 27°40′E; Fig. 1). The urbanised areas of Lu-bumbashi are characterised by an urban zone (high proportion of continuous built-up areas) in the centre of the city, connected to a peri-urban zone (discontinuous and small proportion of built-up areas) re-sulting from the expansion of built-up areas into the rural area. The climate is of Cw type (Köppen classification system;Assani, 1999), with a warm temperate climate, which is hot and humid, and characterised by rainy (November to March) and dry (May to September) seasons. The city experiences two transitional months between these seasons (April and October). Based on phenological observations on vegetation (Malaisse, 1974), the city has been suggested as experiencing five seasons: (i) a cold dry season (May-July); (ii) a hot dry season (August-September); (iii) an early rainy season (October-November); (iv) a rainy season (December-February); and (v) a late rainy season (March-April). With the late onset of rains, the average annual rainfall measured over the period 1970-2005 has been estimated at 1047 mm (Kalombo, 2015). The average annual temperature has been recorded as 20.1 °C, following the recorded data for the second half of the last century (Malaisse, 2010), which could be revisited in relation to the ongoing issue of global warming (Kalombo, 2016). The dominant soil type is ferralsol, mainly represented by yellow and red soils (Malaisse, 2010). The miombo woodland, dense dry forest and gallery forest, re-presenting remnant forest patches, persist only in inaccessible locations and private concessions close to the city (Mwitwa et al., 2012;Useni et al., 2017b). The city is surrounded by a savanna halo, known as the deforestation radius of the city, which is constantly nibbled due to the continuous expansion of the city (Useni et al., 2017b). The reforestation forests of Eucalyptus and Acacia, intended to compensate for the losses of natural vegetation, constitute another feature of woody vegetation cover in the city (Leblanc and Malaisse, 1978; Nkuku and Rémon, 2006).
Agriculture, livestock breeding, administrative services, mining and trade are the main activities of the population in and around the city (Nkuku and Rémon, 2006;Vranken and André, 2014). As the second largest city in the DRC, Lubumbashi has experienced rapid economic development since the beginning of the 2000s due to liberalisation of the mining sector. The total area of the city is estimated to 747km² with an exploding population as reflected by its growth rate jumping from 1 million in 2001 to 2 millions in 2015 (United Nations, 2016). There is no sign that the rapid urbanisation in Lubumbashi will slow down in the
near future. The average density of the population amount at 2300 inhabitant/km², with variations in the range of 600–27600 inhabitants/ km² (Useni et al., 2017a). The literacy is believed to be over 65% while more than half of the population used less than 1.25$ per day (Programme des Nations Unies pour le Développement, 2013).
2.2. Data collection and analysis
The city limits were used to circumscribe the area wherein woody green spaces were to be studied. Representative woody green space were selected as study sites. The gradients of varying land use and functional characteristics of Lubumbashi city provided the basis to identify woody green space samples. Thereafter, a random sampling of woody green spaces was applied starting from the main roads that go from the city centre to the periphery (Useni et al., 2018a). Two criteria were used in woody green space selection: the shrub/tree cover and the dimension of any side. Accordingly, were considered for the study all woody green spaces where at least one-third of the total area is covered by shrub or trees, and wherein the dimension of any side is more than 50 m. Subsequently, the retained woody green spaces were subjected to a decision tree (seeAndré et al., 2014;Bogaert et al., 2015) for their localisation along the urban-rural gradient. Two zones of interest were selected – namely, urban and peri-urban zones (Table 1). The total number of woody green space samples was 20, of which 9 in urban zone and 11 in peri-urban zone. Field studies of biodiversity in these woody
green spaces were carried out between April and June 2016. Since they appeared to be overrepresented in the urban zone (Leblanc and Malaisse, 1978), trees in roadside green spaces were not considered in the data collection. Sampling was carried out using circular plots (Rondeux, 1999) of 25 m radius, a number (per green space) of which varied with respect to the total area of a given woody green space. For all woody green spaces, a number of plots were randomly located in proportion to the total area, taking care to ensure that a minimum distance of 20 m was maintained between sample plots. Most green spaces were sampled using between 1 and 15 plots according to their total area and tree/shrub cover, and a total of 146 plots were surveyed across the city (Table 1).
The identification of plant species by means of local and scientific names was achieved through scientific knowledge (determination keys). The origin of the tree species, whether indigenous from the miombo woodland or exotic, was assessed with reference to a pub-lication on theflora of Upper Katanga (Malaisse, 2010;Meerts, 2016). A number of measures of density, distribution and diversity were also calculated. The number of trees was used as an indication of density. Tree distributions were assessed using their average diameter at breast height (Rakotondrasoa et al., 2013) assigned to 10 size classes: 5–10, 10–15, 15–20, 20–25, 25–30, 30–35, 35–40, 40–45, 45–50 and > 50 cm. It is worth mentioning that multi-stemmed individuals/species were not present on selected woody green spaces. Trees and shrubs with diameter below 50 cm at 1.30 m height were not considered for the Fig. 1. Geographic location of the study area in the Upper Katanga province, South-eastern DRC. The hatched area corresponds to the plain of Lubumbashi, a particular ecological area, in which the city (black spot) is located.
study. For stems with multiple branches insertion below 1.30 m height, the mean diameter was deduced from the quadratic sum of measure-ments recorded on corresponding branches. To account for the popu-lation structure of the woody stands, distribution histograms by dia-meter class (Rakotondrasoa et al., 2013) were constructed for the two zones under study. The basal area, a notion used for the management of irregular stands and for natural regeneration (Malaisse et al., 2013), was calculated as a function of diameter or circumference. For each site, the density of the trees was obtained by the ratio of the number of individuals from the count per unit area (Havyarimana et al., 2013). In addition, the Mann-Whitney U test was applied to compare average values of non-parametric density, basal area, stem diameter as well as the mean of tree species per plot between urban and peri-urban woody green spaces.
Diversity was assessed based on species richness (the number of tree species per zone), and the Shannon index (H) and Simpson index (D) of diversity (Havyarimana et al., 2013) between the woody green spaces of the two studied zones. These indices are most popularly used in community ecology to quantify biodiversity (Nagendra and Gopal, 2010), the latter being more sensitive regarding the importance of rare species (Ngueguim et al., 2010). A comparison between the species richness frequencies of the urban and peri-urban woody green spaces was performed using the Jaccard index.
3. Results
3.1. Floristic inventory
Sixty species of trees and shrubs (38 in the urban zone and 52 in the peri-urban zone), belonging to 22 different families, were recorded. Although the number of sample plots was approximately double on the urban woody green space compared to the peri-urban woody green space, the total number of tree species recorded in the peri-urban zone was almost double than that recorded in the urban zone according to the U test of Mann-Whitney (4.8 species per plot in peri-urban zone vs 2.9 species per plot in urban zone; P = 0.0004). Thirty-seven species were characteristic of the miombo woodland, the Fabaceae family
being the most represented, with a total of 22 species. Other well re-presented families included the Phyllanthaceae (five species;Table 2). As shown inTable 2, in both urban and peri-urban woody green spaces, Acacia auriculiformis remained the most common species, as it was found in 14 woody green spaces. Leucena leucocephala (Fabaceae), Bauhinia thonningii (Fabaceae) and Mangifera indica (Anacardiaceae) occurred relatively commonly, with a frequency of observation of≥ 10. Acacia auriculiformis and L. leucocephala are exotics species char-acterized by a rapid growth that explains their increasing use as orna-mental plant in the city. Bauhinia thoningii is an indigenous species made popular as an ornamental because of its attractive whiteflowers. Mangifera indica, an introduced species, is becoming increasingly pop-ular because of its fruit production and for the shade it provides. The least common species were Brachystegia wangermeeana, Elaeis guineensis, Phyllantus muelleranus, Phyllocosmus lemaireanus, Securidaca long-ipedunculata and Spathodea campanulata, which were observed only in two woody green spaces.
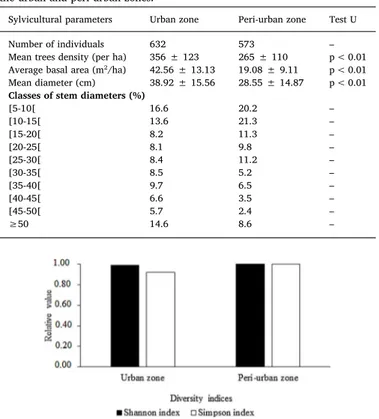
About 15% of the species found in the urban zone were absent from the peri-urban zone. In the same way, and even more noticeable, more than half the species recorded in the peri-urban zone were not identi-fied from the urban zone. Consequently, the similarity rate of species richness in the woody green spaces of the two zones was estimated at nearly 52%. There were 632 individuals in the total woody green spaces of the urban zone, compared to 573 in the peri-urban zone (Table 3). The Shannon and Simpson diversity indices appeared to be similar in the two zones in the studied area; however, the Simpson index was slightly higher in the woody green spaces of the peri-urban zone (Fig. 2), seeming to suggest that there was a significant proportion of rare species in the peri-urban woody green spaces.
3.2. Sylvicultural parameters
As shown inTable 3, the density of the trees in the urban zone was significantly higher than in the peri-urban zone. With low density, the competition for light would not be very high in the peri-urban woody green spaces compared to those in the urban zone. In addition, the basal area was significantly higher in the urban woody green spaces com-pared to the peri-urban woody green spaces (Table 3). Overall, these observations demonstrate that, although the density was lower in the peri-urban zone, the trees and shrubs found in this zone were smaller in diameter than those in the urban zone. In addition, the average dia-meter of the trees was significantly higher on the urban woody green spaces (38.9 cm in the urban zone, 28.6 cm in the peri-urban zone). This difference is related to the distribution pattern of the trees by diameter class, and seems to suggest that there are more old trees in the urban woody green spaces. The most abundant diameter classes in the urban and peri-urban woody green space were those between 5 and 30 cm, giving rise to an inverted J-shape reminiscent of a structure of natural forests in full regeneration. However, the urban woody green spaces dominated lightly in terms of classes of diameter greater than 30 cm (Table 3).
4. Discussion
With current concerns regarding climate change, tree demand is expected to become a pressing issue in southern cities (Clergeau, 2007) where the shift from functionalist urbanism to ecological urbanism is not yet obvious. In the context of Lubumbashi, most of the urban trees that were cultivated to add greenery and protect the urban environment have been destroyed or degraded due to the rapid growth of the city’s population (Nkuku and Rémon, 2006). Despite this,Gong et al. (2013) believed that changes in the surface area, shape and complexity of green spaces alter the composition and configuration of the landscape, which leads to changes in species richness, as confirmed by our results. Bourne and Conway (2014)also indicated that differences in diversity metrics and species composition are greater between urban land uses. Table 1
Location of sampled woody green spaces within the built-up area of Lubumbashi city. Green space code Zone along the urban-rural gradient Geographical coordinates Area (m²) Number of plot Longitude (East) Latitude (South) GS1 Peri-urban 27°29′42.8ʺ 11°36'08.4” 76000 11 GS2 Peri-urban 27°29′29.3ʺ 11°36'31.5” 40000 8 GS3 Peri-urban 27°28′13.7ʺ 11°43'20.1” 4000 1 GS4 Peri-urban 27°28′19.1ʺ 11°43'56.3” 17000 3 GS5 Peri-urban 27°29′24.2ʺ 11°43'02.0'’ 25000 4 GS6 Peri-urban 27°29′40.9ʺ 11°42'07.0” 14,000 2 GS7 Peri-urban 27°28′38.5ʺ 11°36'43.8'’ 36000 6 GS8 Peri-urban 27°29′09.1ʺ 11°36'57.0” 53000 11 GS9 Peri-urban 27°28′38.6ʺ 11°36'36.0” 35000 7 GS10 Peri-urban 27°28′55.8ʺ 11°37'04.0” 15000 3 GS11 Peri-urban 27°28′27.5ʺ 11°39'56.5'’ 65000 11 GS12 Urban 27°28′50.8ʺ 11°40'31.6” 64000 11 GS13 Urban 27°28′54.4ʺ 11°39'06.9” 39000 9 GS14 Urban 27°29′04.4ʺ 11°40'46.8” 64000 12 GS15 Urban 27°32′09.4ʺ 11°38'10.9” 24000 6 GS16 Urban 27°29′43.0ʺ 11°39'09.9” 18000 4 GS17 Urban 27°28′47.5ʺ 11°39'38.4” 17000 3 GS18 Urban 27°27′14.5ʺ 11°39'12.4” 148000 15 GS19 Urban 27°29′00.5ʺ 11°42'12.0” 20000 6 GS20 Urban 27°24′43.3ʺ 11°34'50.4” 80000 13
AlthoughUseni et al. (2018a) delineated that exotic species dom-inate all green spaces types of Lubumbashi city, little was known about woody green spaces. Here, we found that woody green spaces in Lu-bumbashi have a high species richness, with 60 species recorded from 146 plots, containing 1205 shrubs and trees. Yet, the distribution of trees is dominated by few species. The percentage of indigenous species is very high (more than 60% of the total treeflora;Photos 1 and 2). This is especially high when compared with cities such as Bangalore (India),
where the proportion of indigenous species in parks is almost 35% (Nagendra and Gopal, 2010). The proportion of indigenous trees found in our study is comparable to cities like Chonju (South Korea), where indigenous species were found to account for more than 70% of the population (Zerbe et al., 2004). Further, higher indigenous tree species richness was presumably attributed to the low level of woody green spaces management (Shanahan et al., 2015). Indeed, in over-managed woody vegetation, people prefer to install exotic species, which are Table 2
List of tree and shrub species observed in urban (n = 9) and peri-urban (n = 11) zones of Lubumbashi city. "x" indicates the presence of plant species. Species preceded by * are characteristic of the miombo woodland (Malaisse, 2010;Meerts, 2016), while observations frequency refer to the number of green spaces surveyed.
Scientific name Family
(Subfamily)
Urban zone Peri-urban zone Observations frequency Urban Peri-urban Acacia auriculiformis Benth. Fabaceae (Mimosoideae) x x 6 8 *Acacia polyacantha Willd. Willd. subsp. campylacantha (Hochst. ex A.Rich.) Brenan Fabaceae (Mimosoideae) x 3
*Albizia adianthifolia (Schum.) W. Wight Fabaceae (Mimosoideae) x x 6 2 *Albizia antunesiana Harms Fabaceae (Mimosoideae) x x 5 2 Albizia lebbeck (L.) Benth. Fabaceae (Mimosoideae) x x 4 1 Albizia versicolor Oliv. Fabaceae (Mimosoideae) x 4 *Anisophyllea boehmii Engl. Anisophylleaceae x x 2 6
*Annona senegalensis Pers. Annonaceae x 3
*Baphia bequaertii De Wild. Fabaceae (Faboideae) x x 2 5 *Bauhinia corniculata Benth. Fabaceae (Caesalpinioideae) x 3 *Bauhinia thonningii Schum. Fabaceae (Caesalpinioideae) x x 5 6 *Bobgunnia madagascariensis (Desv) J.H. Kirkbr. & Wiersema Fabaceae (Faboideae) x 3
*Brachystegia boehmii Taub. Fabaceae (Caesalpinioideae) x x 3 6 *Brachystegia spiciformis Benth. Fabaceae (Caesalpinioideae) x x 2 6 *Brachystegia wangermeeana De Wild. Fabaceae (Caesalpinioideae) x 2
Cassia spectabilis DC. Fabaceae (Caesalpinioideae) x x 6 3
Citrus sinensis (L.) Osbeck. Rutaceae x 3
*Combretum acutifolium Excel Combretaceae x x 2 6
*Combretum collinum Fresen. Combretaceae x x 2 5
*Combretum molle R.Br. ex G.Don Combretaceae x x 2 6 *Dalbergia boehmii Taub. Fabaceae (Faboideae) x x 1 4 Delonix regia (Hook.) Raf. Fabaceae (Caesalpinioideae) x x 4 2 *Dichrostachys cinerea (L.) Wight. & Arn. Fabaceae (Mimosoideae) x 3
*Diospyros kirkii Hiern Ebenaceae x 5
*Diplorhynchus condylocarpon (Müll.Arg.) Pichon Apocynaceae x 6
Elaeis guineensis Jacq. Arecaceae x 2
Eucalyptus camaldulensis Dehnh. Myrtaceae x x 4 2
Eucalyptus robusta Sm. Myrtaceae x x 3 1
Ficus brachypoda (Miq.) Miq. Moraceae x x 4 2
*Ficus sycomorus L. Moraceae x x 3 2
Gmelina arborea Roxb. Verbenaceae x 4
*Hymenocardia acida Tul. Phyllanthaceae x 5
Jacaranda mimosifolia D.Don Bignoniaceae x x 6 2
*Julbernardia paniculata (Benth.) Troupin Fabaceae (Caesalpinioideae) x x 2 7 Leucaena leucocephala (Lam.) De Wit. Fabaceae (Mimosoideae) x x 7 6
Mangifera indica L. Anacardiaceae x x 3 7
*Markhamia obtusifolia (Baker) Sprague Bignoniaceae x 3
*Marquesia macroura Gilg. Dipterocarpaceae x 6
*Monotes katangensis (De Wild.) De Wild Dipterocarpaceae x 3
Ochna schweinfurthiana F. Hoffm. Ochnaceae x x 2 4
*Parinari curatellifolia Planch. ex Benth. Chrysobolanaceae x x 1 6
Parkiafilicoidea Oliv. Fabaceae (Mimosoideae) x 3
Persea americana Mill. Lauraceae x 6
*Pericopsis angolensis (Baker) Meeuwen Fabaceae (Faboideae) x x 2 6 *Phyllanthus muelleranus (Kuntze) Exell Phyllanthaceae x 2 *Phyllocosmus lemaireanus (De Wild. & T. Durand) T. Durand & H.Durand Ixonanthaceae x 2
Pinus caribaea Morelet Pinaceae x 4
Pinus kesiya Royle ex Gordon Pinaceae x x 3 2
Pinus patula Schiede ex Schltdl. & Cham. Pinaceae x 4
Plumeria arborea Noronha Apocynaceae x x 5 3
*Pseudolachnostylis maprouneifolia Pax Phyllanthaceae x x 1 4
Psidium guajava L. Myrtaceae x 3
*Pterocarpus angolensis DC. Fabaceae (Faboideae) x 5 *Securidaca longipedunculata Fresen Polygalaceae x 2
Spathodea campanulata P. Beauv. Bignoniaceae x 2
*Syzygium guineense (Willd.) DC. Myrtaceae x x 2 6
*Uapaca pilosa Hutch. Phyllanthaceae x 5
*Uapaca sansibarica Pax Phyllanthaceae x 4
*Uvariastrum hexaloboides (R.E.Fr.) R.E.Fr. Annonaceae x 3
believed to reach maturity at a relatively lower age compared to in-digenous tree species. However, exotic species may show a better ability at colonising the diversity of fragmented habitats in urban areas (McKinney, 2002). The presence of exotic species, such as A. aur-iculiformis, M. indica, L. leucocephala, etc. in this study, is due to de-liberate and accidental introductions for various purposes (Photo 3). In line with the literature, L. leucocephala is considered as one of the
world’s worst invasive alien species (Lowe et al., 2000). Yet, invasive alien species have the ability to transform microhabitats, including soil quality, which can affect the survival of indigenous species (Dassonville et al., 2007). Thus, owing to the absence of any spatial planning policy (Vranken et al., 2013), if the introduction of exotic species is sustained, there is a risk of disqualifying indigenous species characteristic of the miombo woodland in Lubumbashi city where the threat is real (Useni et al., 2018a). Although the ground and its management are acknowl-edged to be under the authority of the state, a range of issues have been evidenced regarding land management in the city. And the most fla-grant cases is related on one side, to an uncontrolled extension of the city through housing development, which endangers the existence of woody green spaces as well as associated infrastructures; and on the other side, to a lack of coordinated actions regarding urban manage-ment in the city (GroupeHuit, 2009). The dysfunctional nature of the urban planning regulations in Lubumbashi city, linked to the outdated nature of some of these regulations, in relation to addressing the current development trends in urbanised areas have been reported byMensah (2014)as a key issue for green space preservation in African cities. Conversely, total and indigenous tree species are generally highest in land uses with intermediate levels of urban development (Ortega-Al-varez et al., 2011), as confirmed by the current results. Indeed, an in-crease in the number of tree species was observed along the urbanisa-tion gradient, confirming our hypothesis.Bogaert et al. (2015)argued that peri-urban zones and their vegetation present hybrid ecological conditions of both undisturbed (rural) and disturbed (urban) habitats which favours an increase in plant diversity in both zones. Overall data from this study suggest the existence of tree and shrub species that are typical of the urban zone and the peri-urban zone. Indeed, the process of urbanisation has greatly transformed the landscape of Lubumbashi, creating heterogeneous urban vegetated lands with new environmental conditions (Useni et al., 2018a) that maybe used as a filter to select adapted trees and shrubs (Williams et al., 2009). This could thus ex-plain the existence of species characteristic of either studied zones. In the peri-urban zone notably, such trees and shrubs could be rapidly degraded; indeed, these zones are relatively dynamic, characterized by rapid changes as a result of an extension of the city and associated infrastructures (Shakleton et al., 2015).
For the miombo woodland, in the local context of Lubumbashi, the density of trees and shrubs can reach up to 6000 plants/ha, depending on the type of dominant species (Wimana, 2012). From the results of this study, the 356 and 265 plants/ha for urban and peri-urban woody green spaces, respectively, deviate from the values reported byWimana (2012)in the rural zone of Lubumbashi. Unbuilt lands in urban and peri-urban zones are matter of less rigorous governance and manage-ment, mostly driven by various sociopolitical reasons (Shakleton et al., 2015). The various anthropogenic activities that have developed, such as land transformation (i.e. clearing of land to build roads, houses, in-frastructure), cutting trees for charcoal manufacturing (Trefon et al., 2010;Barima et al., 2011) and felling old trees to prevent accidents associated with their imminent fall, are likely the cause of the con-siderable decrease in the density of trees and shrubs in woody green spaces. The hypothesis that the density and basal area of the trees and shrubs of urban green spaces are greater than basal area founded on peri-urban green spaces, as a result of marked fragmentation was confirmed. At low density, the competition for light is not very high (Rakotondrasoa et al., 2013) in (peri-)urban woody green spaces, compared to miombo forest. The increased light resulting from the cutting of certain tree stands (Leblanc and Malaisse, 1978) has favoured the development of seedlings and undergrowth (Rakotondrasoa et al., 2013) on urban and peri-urban woody green spaces. This could explain the tendency towards regeneration observed in this study. Both sites had a reverse-J-shaped size class profile; and importantly, the largest size class showed a lower jump in the proportion of individuals. Like-wise, recruitment was observed at both zones, though the peri-urban zone had more small stems. Further, both sites were characterized by a Table 3
Structural characteristics of woody green spaces in urban and peri-urban zones of Lubumbashi city. Test U-related data express results of the Mann-Whitney average comparison, with p < 0.05 indicating significant differences between the urban and peri-urban zones.
Sylvicultural parameters Urban zone Peri-urban zone Test U Number of individuals 632 573 – Mean trees density (per ha) 356 ± 123 265 ± 110 p < 0.01 Average basal area (m²/ha) 42.56 ± 13.13 19.08 ± 9.11 p < 0.01 Mean diameter (cm) 38.92 ± 15.56 28.55 ± 14.87 p < 0.01 Classes of stem diameters (%)
[5-10[ 16.6 20.2 – [10-15[ 13.6 21.3 – [15-20[ 8.2 11.3 – [20-25[ 8.1 9.8 – [25-30[ 8.4 11.2 – [30-35[ 8.5 5.2 – [35-40[ 9.7 6.5 – [40-45[ 6.6 3.5 – [45-50[ 5.7 2.4 – ≥50 14.6 8.6 –
Fig. 2. Characterization of woody green spaces in urban (n = 9) and peri-urban (n = 11) zones of Lubumbashi city based on diversity indices. All indices are expressed relative to the maximum value (Hmax = 3.97, Dmax = 0.98).
Photo 1. A woody green space located in the yard of the Faculty of Arts (campus of the University of Lubumbashi) in the peri-urban zone. The fore-ground of the picture is decorated by species including Monotes katangense, Julbernadia paniculata and Combretum colinum. A Macrotermes falciger-erected termite mound can also be spotted, as well as people coming around for reading purpose.
greater understory abundance, which was found to favour plant re-generation.Wimana (2012)found that the basal area varied from 13.5 m²/ha to 16.1 m²/ha depending on the dominant species of miombo woodland, which is significantly lower than the values recorded in this study due to the difference in density of the trees and shrubs. 5. Conclusion
The present study is a contribution to the understanding of the miombo-type flora in Lubumbashi, notably in relation to the char-acteristics of woody green spaces, seen as potential remnant patches caused by miombo forest fragmentation. This category of green space was found to be dominated by the Fabaceae family (A. auriculiformis, L. leucocephala, B. thonningii), although other species, such as M. indica (Anacardiaceae) were also well represented. Overall data from this study suggest the existence of tree and shrubs species that are typical of the urban zone and the peri-urban zone. Moreover, a strong variation regarding the values of sylvicultural parameters between urban and peri-urban woody green spaces was revealed; however, their diversity indices were similar. The urban woody green space showed sig-nificantly higher values. The (peri-)urban woody green spaces pre-sented a trend towards regeneration, reflected by the preponderance of individuals with small diameters. The presence of some miombo woodland species in both urban and peri-urban woody green spaces was regarded as sound evidence of some level of intactness or
regeneration of certain original miombo woodland patches.
The approach adopted in this study could be the starting point for the formulation of policies and technical tools that would help in the appreciation of urban and peri-urban woody green spaces in the city of Lubumbashi that could lead to their longer-term monitoring and con-servation.
Conflict of interests
The author(s) declared no potential conflicts of interest with respect the research, authorship, and/or publication of this article.
Funding
The author(s) disclosed receipt thefinancial support from the ARES-CCD (Belgium) for the research, authorship, and/or publication of this article: YUS receivedfinancial support in the PRD CCPGU and SCK in the AI program.
Author contributions
YUS: Conceptualization, investigation, formal analysis and writing; FM: Methodology and review; SCK: Investigation and review; AKM: Investigation; AMY: Investigation and review; CNK: Investigation and review; JB: Supervision and validation; FMK: Supervision and valida-tion.
References
André, M., Mahy, G., Lejeune, P., Bogaert, J., 2014. Vers une synthèse de la conception et d’une définition des zones dans le gradient urbain-rural. Biotechnologie Agronomie Société et Environnement 18 (1), 61–74.
Assani, A.A., 1999. Variabilité temporelle et persistance des épisodes secs en saison des pluies à Lubumbashi (Congo-Kinshasa). Sécheresse 10 (1), 45–53.
Barima, Y.S.S., Kabulu Djibu, J.-P., Alongo, S., Ndayishimiye, J., Bomolo, O., Kumba, S., Iyongo, L., Bamba, I., Mama, A., Toyi, M., Kasongo, E., Masharabu, T., Visser, M., Bogaert, J., 2011. Deforestation in central and West Africa: landscape dynamics, anthropogenic effects and ecological consequences. In: In: Daniels, J.A. (Ed.), Advances in Environmental Research. Vol 7. Nova Science Publishers, Hauppauge, pp. 95–120.
Bogaert, J., Biloso, A., Vranken, I., André, M., 2015. Peri-urban dynamics: landscape ecology perspectives. In: Bogaert, J., Halleux, J.-M. (Eds.), Territoires périurbains: développement, enjeux et perspectives dans les pays du sud. Les presses agronomi-ques de Gembloux, Gembloux, Belgique, pp. 63–73.
Bolund, P., Hunhammar, S., 1999. Ecosystem services in urban areas. Ecol. Econ. 29 (2), 293–301.
Bourne, K.S., Conway, T.M., 2014. The influence of land use type and municipal context on urban tree species diversity. Urban Ecosyst. 17 (1), 329–348.
Bruneau, J.C., Pain, M., 1990. Atlas de Lubumbashi. Centre d’Etude Géographique sur l’Afrique Noire, Université Paris X, Nanterre, France. pp. 201.
Clergeau, P., 2007. Une écologie du paysage urbain. Editions Apogée, pp. 137.
Dassonville, N., Vanderhoeven, S., Gruber, W., Meerts, P., 2007. Invasion by Fallopia japonica increases topsoil mineral nutrient concentration. Ecoscience 14, 230–240.
du Toit, M.J., Cilliers, S.S., Dallimer, M., Goddard, M., Guenat, S., Cornelius, S.F., 2018. Urban green infrastructure and ecosystem services in sub-Saharan Africa. Landsc. Urban Plan. 180, 249–261.
Etshekape, P.G., Atangana, A.R., Khasa, D.P., 2018. Tree planting in urban and peri-urban of Kinshasa: survey of factors facilitating agroforestry adoption. Urban For. Urban Green. 30, 12–23.
Fanan, U., Dlama, K.I., Oluseyi, I.O., 2011. Urban expansion and vegetal cover loss in and around Nigeria Federal Capital City. J. Ecol. Nat. Environ. 3 (1), 1–10.
Gong, C., Chen, J., Yu, S., 2013. Biotic homogenization and differentiation of the flora in artificial and near-natural habitats across urban green spaces. Landsc. Urban Plan. 120, 158–169.
Gromke, C., Blocken, B., 2015. Influence of avenue-trees on air quality at the urban neighborhood scale. Part II: traffic pollutant concentrations at pedestrian level. Environ. Pollut. 196, 176–184.
Havyarimana, F., Bigendako, M.-J., Masharabu, T., Bangirinama, F., Lejoly, J., Barima, Y.S.S., De Cannière, C., Bogaert, J., 2013. Diversité et distribution d’abondances des plantes d’un écosystème protégé dans un paysage anthropisé: cas de la Réserve Naturelle Forestière de Bururi, Burundi. Tropicultura 31 (1), 28–35.
Huit, Groupe, 2009. Elaboration du plan urbain de référence de Lubumbashi. Rapport final Groupe Huit, BEAU, Ministère des ITR, RD Congo. pp. 62.
Kalombo, K.D., 2015. Caractérisation de la répartition temporelle des précipitations à Lubumbashi (Sud-Est de la RDC) sur la période 1970-2014. XXIII Colloque de l’Association Internationale de Climatologie, Liège. pp. 531–536.
Kalombo, K.D., 2016. Evaluation des éléments du climat en R.D.C. Editions Universitaires Photo 2. Private woody green space in the urban zone of Lubumbashi city,
characterized by a colonisation miombo woodland species, seemingly suggesting its place as a remnant patch trapped in a built-up area.
Photo 3. Population of Acacia auriculiformis, an exotic species, on a woody green space managed by the town hall of Lubumbashi city in the peri-urban zone (north-east).
Européennes, Saarbrücken (Allemagne), pp. 220.
Kestemont, B., Frendo, L., Zaccai, E., 2011. Indicators of the impacts of development on environment: a comparison of Africa and Europe. Ecol. Indic. 11 (3), 848–856.
Kong, F., Yin, H., James, P., Hutyra, L.R., He, H.S., 2014. Effects of spatial pattern of greenspace on urban cooling in a large metropolitan area of eastern China. Landsc. Urban Plan. 128, 35–47.
Lambin, E.F., Turner, B.L., Geist, H.J., Agbola, S.B., Angelsen, A., Bruce, J.W., Coomes, O.T., Dirzo, R., Fischer, G., Folke, C., George, P.S., Homewood, K., Imbernon, J., Leemans, R., Li, X., Moran, E.F., Mortimore, M., Ramakrishnan, P.S., Skanes, H., Steffen, W., Stone, G.D., Svedin, U., Veldkamp, T.A., Vogel, C., Xu, J., 2001. The causes of land-use and land-cover change: moving beyond the myths. Glob. Environ. Change 11 (4), 261–269.
LaRosa, D., Privitera, R., 2013. Characterization of non urbanized areas for land-use planning of agricultural and green infrastructure in urban context. Landsc. Urban Plan. 109, 94–106.
Leblanc, M., Malaisse, F., 1978. Lubumbashi, un écosystème urbain tropical. Centre International de Sémiologie, Université Nationale du Zaïre, pp. 166.
Liu, Z., He, C., Zhou, Y., Wu, J., 2014. How much of the world’s land has been urbanized, really? A hierarchical framework for avoiding confusion. Landsc. Ecol. 29 (5), 763–771.
Lowe, S., Browne, M., Boudjelas, S., De Poorter, M., 2000. 100 Of the World’s Worst Invasive Alien Species: a Selection from the Global Invasive Species Database. Invasive Species Specialist Group, Auckland, New Zealand.
Maas, J., Verheij, R.A., Groenewegen, P.P., De Vries, S., Spreeuwenberg, P., 2006. Green space, urbanity, and health: how strong is the relation? J. Epidemiol. Community Health 60 (7), 587–592.
Malaisse, F., 1974. Phenology of the Zambezian woodland area with emphasis on the miombo ecosystem. In: In: Lieth, H. (Ed.), Phenology and Seasonality Modelling, vol.8. Springer Verlag, Berlin-Heidelberg-New York, Ecological Studies, pp. 269–286.
Malaisse, F., 2010. How to Live and Survive in Zambezian Open Forest (Miombo Ecoregion). Les Presses Agronomiques de Gembloux, Gembloux, Belgium.
Malaisse, F., Rakotondrasoa, O.L., Rakotoniaina, N., Razafimanantsoa, T.M., Ratsimba, H.R., Pinel, R., Barsics, F., Verheggen, F.J., Mahy, G., Haubruge, E., Bogaert, J., 2013. Apport de la surface terrière dans la dénomination des formations végétales dominées par le tapia (Uapaca bojeri) à Madagascar. In: Verheggen, F., Bogaert, J., Haubruge, E. (Eds.), Les vers à soie malgaches: enjeux écologiques et socio-économiques. Les Presses Agronomiques de Gembloux, pp. 133–150.
McKinney, M.L., 2002. Urbanization, biodiversity, and conservation. Bioscience 52 (10), 883–890.
McPherson, E.G., Rowntree, R.A., 1993. Energy conservation potential of urban tree planting. J. Arboricult. 19 321-321.
Meerts, P., 2016. An annotated checklist to the trees and shrubs of the Upper Katanga (D.R. Congo). Phytotaxa 258 (3), 201–250.
Mensah, C.A., 2014. Urban green spaces in Africa: nature and challenges. Int. J. Ecosyst. 4 (1), 1–11.
Millenium Ecosystem Assessment, 2005. Ecosystems and Human Well-being: Synthesis. Island Press, Washington, DC.
Munyemba, K.F., Bogaert, J., 2014. Anthropisation et dynamique de l’occupation du sol dans la région de Lubumbashi de 1956 à 2009. E-revue UNILU 1 (1), 3–23.
Mwitwa, J., German, L., Muimba-Kankolongo, A., Puntondewo, A., 2012. Governance and sustainability challenges in landscape shaped by mining: mining-forestry linkages and impacts in the copper belt of Zambia and the DR Congo. For. Policy Econ. 25, 19–30.
Nagendra, H., Gopal, D., 2010. Street trees in Bangalore: density, diversity, composition and distribution. Urban For. Urban Green. 9 (2), 129–137.
Nagendra, H., Gopal, D., 2011. Tree diversity, distribution, history and change in urban parks: studies in Bangalore, India. Urban Ecosyst. 14 (2), 211–223.
Ngueguim, J.R., Zapfack, L., Youmbi, E., Riera, E., Onana, J., Foahom, B., Makombu, J.G., 2010. Diversitéfloristique sous canopée en plantation forestière de Mangombe-Edea (Cameroun). Biotechnologie, Agronomie, Société et Environnement 14 (1), 167–176.
Nkuku, K.C., Rémon, M., 2006. Stratégies de survie à Lubumbashi (R.D. Congo). Enquête sur 14000 ménages urbains. Mémoires lieux de savoir: Archive congolaise, l’Harmattan, Paris.
Nowak, D., Heisler, G., 2010. Air Quality Effects of Urban Trees and Parks. Research Series Monograph. Ashburn. VA: National Recreation and Parks Association Research Series Monograph, pp. 44.
Programme des Nations Unies pour le développement, 2013. Rapport sur le développement humain 2013. PNUD, New York, NY, USA.
Rakotondrasoa, O.L., Malaisse, F., Rajoelison, G.L., Gaye, J., Razafimanantsoa, T.M., Rabearisoa, M.R., Ramamonjisoa, B.S., Raminosoa, N., Verheggen, F., Poncelet, M., Haubruge, E., Bogaert, J., 2013. Identification des indicateurs de dégradation de la
forêt de tapia (Uapaca bojeri) par une analyse sylvicole. Tropicultura 31 (1), 10–19.
Rija, A.A., Said, A., Mwamende, K.A., Hassan, S.H., Madoffe, S.S., 2014. Urban sprawl and species movement may decimate natural plant diversity in an Afro-tropical city. Biodivers. Conserv. 23, 963–978.
Rondeux, J., 1999. La mesure des arbres et des peuplements forestiers. Les presses agronomiques de Gembloux, pp. 498.
Sampaio, M.B., De La Fuentea, M.F., Albuquerque, U.P., da Silva Souto, A., Schiel, N., 2018. Contact with urban forests greatly enhances children’s knowledge of faunal diversity. Urban For. Urban Green. 30, 56–61.
Shackleton, C.M., Hebinck, P., Kaoma, H., Chishaleshale, M., Chinyimba, A., Shackleton, S.E., Gambiza, J., Gumbo, D., 2014. Lowcost housing developments in South Africa miss the opportunity for household level urban greening. Land Use Policy 36, 500–509.
Shakleton, S., Chinyimba, A., Henbick, P., Shackleton, C., Kaoma, H., 2015. Multiple benefits and values of tree in urban landscapes in two towns in northern South Africa. Landsc. Urban Plan. 136, 76–86.
Shakleton, C.M., Blair, A., De Lacy, P., Kaoma, H., Mugwagwa, N., Dalu, M.T., Walton, W., 2018. How important is green infrastructure in small and medium-sized towns? Lessons from South Africa. Landsc. Urban Plan. 180, 273–281.
Shanahan, D.F., Lin, B.B., Gaston, K.J., Bush, R., Fuller, R.A., 2015. What is the role of trees and remnant vegetation in attracting people to urban parks? Landsc. Ecol. 30 (1), 153–165.
Song, X.P., Tan, P.Y., Edwards, P., Richards, D., 2017. The economic benefits and costs of trees in urban forest stewardship: a systematic review. Urban For. Urban Green. 29, 162–170.
Trefon, T., Hendriks, T., Kabuyaya, N., Ngoy, B., 2010. L’économie politique de la filière du charbon de bois à Kinshasa et à Lubumbashi: Appui stratégique à la politique de reconstruction post-conflit en R.D.C. Working paper of the Institute of Development Policy and Management, University of Antwerp.
Tzoulas, K., Korpela, K., Venn, S., Yli-Pelkonen, V., Kaźmierczak, A., Niemela, J., James, P., 2007. Promoting ecosystem and human health in urban areas using Green Infrastructure: a literature review. Landsc. Urban Plan. 81 (3), 167–178.
United Nations, 2016. The World’s Cities in 2016. Data Booklet (ST/ESA/SER.A/352)..
Useni, S.Y., Cabala, K.S., Malaisse, F., Nkuku, K.C., Amisi, M.Y., Bogaert, J., Munyemba, K.F., 2017a. Vingt-cinq ans de monitoring de la dynamique spatiale des espaces verts en réponse à l’urbanisation dans les communes de la ville de Lubumbashi (Haut-Katanga, R.D. Congo). Tropicultura 35 (4), 300–311.
Useni, S.Y., Malaisse, F., Cabala, K.S., Munyemba, K.F., Bogaert, J., 2017b. Le rayon de déforestation autour de la ville de Lubumbashi (Haut-Katanga, R.D. Congo) : synthèse. Tropicultura 35 (3), 215–221.
Useni, S.Y., Sambiéni, K.R., Maréchal, J., Ilunga, W.I.E., Malaisse, F., Bogaert, J., Munyemba, K.F., 2018. Changes in the Spatial Pattern and Ecological Functionalities of Green Spaces in Lubumbashi (the Democratic Republic of Congo) in Relation with the Degree of Urbanization. Trop. Conserv. Sci. 11, 1–17.
Useni, S.Y., Cabala, K.S., Halleux, J.-M., Bogaert, J., Munyemba, K.F., 2018b. Caractérisation de la croissance spatiale urbaine de la ville de Lubumbashi (Haut-Katanga, RD Congo) entre 1989 et 2014. Tropicultura 36 (1), 99–108.
Useni, S.Y., André, M., Mahy, G., Cabala, K.S., Malaisse, F., Munyemba, K.F., Bogaert, J., 2018c. Interprétation paysagère du processus d’urbanisation à Lubumbashi (RD Congo) : dynamique de la structure spatiale et suivi des indicateurs écologiques entre 2002 et 2008. In: Bogaert, J., Colinet, G., Mahy, G. (Eds.), Anthropisation des pay-sages katangais. Les presses universitaires de Liège (Belgique), pp. 281–296.
Bogaert, J., Vranken, I., André, M., 2014. Anthropogenic effects in landscapes: historical context and spatial pattern. In: Hong, S.K., Bogaert, J., Min, Q. (Eds.), Biocultural Landscapes. Diversity, Functions and Values. Springer, Dordrecht, The Netherlands, pp. 89–112.
Vranken, I., Amisi, Y.M., Munyemba, K.F., Bamba, I., Veroustraete, F., Visser, M., Bogaert, J., 2013. The spatial footprint of the non-ferrous mining industry in Lubumbashi. Tropicultura 31 (1), 22–29.
Williams, N.S.G., Schwartz, M.W., Vesk, P.A., McCarthy, M.A., Hahs, A.K., Clemants, S.E., Corlett, R.T., Duncan, R.P., Norton, B.A., Thompson, K., McDonnell, M.J., 2009. A conceptual framework for predicting the effects of urban environments on floras. J. Ecol. 97 (1), 4–9.
Wimana, K.P., 2012. Caractérisation des communautés végétales du miombo en lien aux paramètres physiques du sol. Réserve de Mikembo, Lubumbashi (RD Congo). Mémoire de DEA : Université de Lubumbashi (RD Congo).
Zerbe, S., Choi, I., Kowarik, I., 2004. Characteristics and habitats of non-native plant species in the city of Chonju, southern Korea. Ecol. Restor. 19, 91–98.
Zhou, X., Wang, Y.C., 2011. Spatial–temporal dynamics of urban green space in response to rapid urbanization and greening policies. Landsc. Urban Plan. 100 (3), 268–277.