Promotors
Wim Vyverman (Ghent University, Protistology and Aquatic Ecology, Krijgslaan 281 S8, 9000 Gent)
Annick Wilmotte (Université de Liège, CIP, Sart Tilman B6, Liège) Anne Willems (Ghent University, Lab. of Microbiology,
K.L. Ledeganckstraat 35, 9000 Gent)
Damien Ertz/Bart Van de Vijver (Plantentuin Meise, Nieuwelaan 38, 1860 Meise)
Authors
Elie Verleyen, Dagmar Obbels, Bjorn Tytgat, Maxime Sweetlove, Wim Vyverman, Anne Willems (Ghent University)
Zorigto Namsaraev (National Research Centre "Kurchatov Institute"
Winogradsky Institute of Microbiology RAS, Russia), Pedro De Carvalho Maalouf, Marie-José Mano, Annick Wilmotte (University of Liège)
Damien Ertz, Bart Van de Vijver (Botanic Garden Meise) Steve J. Roberts (British Antarctic Survey)
Josef Elster (Centre for Polar Ecology, Faculty of Science, University of South Bohemia, České Budějovice, Czech Republic)
Satoshi Imura (National Institute of Polar Research)
B
ELGIANP
RINCESSE
LISABETHS
TATIONFINAL REPORT
BELGIAN MICROBIAL DIVERSITY PROJECT IN ANTARCTICA
BELDIVA EA/00/05
Published in 2015 by the Belgian Science Policy Avenue Louise 231 Louizalaan 231 B-1050 Brussels Belgium Tel: +32 (0)2 238 34 11 – Fax: +32 (0)2 230 59 12 http://www.belspo.be
Contact person: Maaike Vancauwenberghe +32 (0)2 238 36 78
Neither the Belgian Science Policy nor any person acting on behalf of the Belgian Science Policy is responsible for the use which might be made of the following information. The authors are responsible for the content.
No part of this publication may be reproduced, stored in a retrieval system, or transmitted in any form or by any means, electronic, mechanical, photocopying, recording, or otherwise, without indicating the reference:
Elie Verleyen, Zorigto Namsaraev, Damien Ertz, Bjorn Tytgat, Dagmar Obbels, Maxime Sweetlove, Josef Elster, Pedro De Carvalho Maalouf, Marie-José Mano, Satoshi Imura, Bart Van de Vijver, Annick Wilmotte, Anne Willems, Wim Vyverman. Belgian Microbial Diversity Project "BELDIVA". Final Report. Brussels : Belgian Science Policy 2015– 61 p. (BELISA - Belgian Princess Elisabeth Station)
Table of Content
SUMMARY ... 5
A. Context ... 5
B. Objectives ... 5
C. Conclusions ... 5
D. Contribution of the project in a context of scientific support to a sustainable development policy ... 8
E. Keywords ... 8
1. INTRODUCTION ... 9
2. METHODOLOGY AND RESULTS ... 11
2.1. Field methods ... 11
2.2. Laboratory procedures ... 13
2.3. Results ... 19
3. POLICY SUPPORT ... 43
4. DISSEMINATION AND VALORISATION ... 45
5. PUBLICATIONS ... 51
6. ACKNOWLEDGEMENTS ... 53
7. REFERENCES ... 55
SUMMARY A. Context
Little is known about the diversity and geographic distribution of biota in Antarctica. This is in part underlain by the lack of systematic sampling and geographical coverage, and the problems associated with species definition, cryptic diversity and cultivability. Particularly the Dronning Maud Land region is understudied in terms of its biodiversity. As a result, we largely lack the ‘baseline’ data needed to understand the contribution of various processes that are responsible for the geographical patterns present in the diversity and composition of microbiota, lichens, mosses and microinvertebrates and to observe possible future changes in their diversity and taxonomic composition due to ecosystem change and/or human introductions.
B. Objectives
BELDIVA is aimed at (i) obtaining a first integrated biological description of the pristine habitats in an area of 50 km around the Belgian Princess Elisabeth research station (Sør Rondane Mountains) using state-of-the art sequencing techniques and (ii) studying their response and adaptations to change and the factors that control their spatial distribution. BELDIVA has the following scientific objectives:
1. Study the importance of airborne propagules in shaping the diversity of terrestrial and aquatic habitats in the Sør Rondane Mountains;
2. Install Open-Top Chambers to mimic future climate warming and its effect on the microbial communities;
3. Study adaptations under the extreme Antarctic conditions by conducting in situ experiments (i.e., photosynthetic efficiency).
4. Study the deglaciation history of the region, which will put the biodiversity data into a temporal framework.
5. Study the biodiversity of microorganisms (both prokaryotes and eukaryotes), microinvertebrates, lichens and mosses in various habitats in the region with a particular focus on soils;
6. Verify the distribution in representative samples of particular bacterial and cyanobacterial taxa and to integrate our findings with results obtained within other projects
C. Conclusions
Back trajectory analysis of air masses in East Antarctica revealed that long-distance transport of microorganisms is possible within the continent and even
between continents during cyclone events. However, the concentration of biotic propagules appeared to be low in the filters studied.
A total of 8 Open top chambers (OTC) on four different nunataks/ridges were installed. Monitoring revealed that the temperature was up to 5.8°C higher than the temperature outside of the OTC between 2010 and 2012. In some cases the temperature was higher outside the OTC, probably as a result of the longer persistence of snow in the OTC leading to a more buffered temperature regime. No significant change in vegetation cover could be observed over this relatively short period. A follow-up study is recommended to assess the effect of climate warming on these soil crusts.
Measurements of the photosynthetic efficiency revealed that cyanobacteria were probably photosynthetically active even at the temperature -7.8°C.
Cosmogenic isotope dating revealed that all samples analysed so far have a complex exposure history with samples surviving more than one glacial cycle. Erosion-rates are large in both studied regions, indicating they have all experienced a high degree of recycling, long periods of burial and/or multiple periods of exposure, resulting in large burial age ranges and large age errors. Among the prokaryotes, Cyanobacteria, Proteobacteria, Bacteroidetes,
Acidobacteria, FBP, and Actinobacteria were the most abundant prokaryotic phyla in 22 samples studied using 454 NGS from soils, lakes, cryoconite holes, and endolithic habitats. Multivariate analyses revealed that the prokaryotic community structure in lakes was significantly different from those in dry soils and endolithic habitats.
Morphological observations and DGGE analysis of crust samples revealed the presence of 15 morphotypes and 26 OTUs in Cyanobacteria of which the most abundant were related to Phormidium autumnale/Microcoleus autumnalis,
Cyanothece aeruginosa, Tolypothrix, Nostoc, Leptolyngbya sp. and Phormidesmis pristleyi. These analyses also showed a higher diversity on granite
rocks than on gneiss. Only 15% of the OTUs (defined with a threshold of 97.5% of 16S rRNA similarity) appeared limited to Antarctic habitats.
Ordination analyses revealed that total organic carbon was the most significant parameter in structuring the prokaryotic communities studied using the Illumina technology, followed by pH, conductivity, bedrock type and water content.
Acidobacteria (Chloracidobacteria) and Actinobacteria (Actinomycetales)
dominated the organic carbon poor samples situated on gneiss, while
Proteobacteria (Sphingomonadaceae), Cyanobacteria, Armatimonadetes and
candidate division FCB (OP11) mainly occurred in granite samples with a high total organic carbon content.
OTUs belonging to the Rotifera, Chlorophyta, Tardigrada, Ciliophora, Cercozoa, Fungi, Bryophyta, Bacillariophyta, Collembola and Nematoda were present with a relative abundance of at least 0.1% in the eukaryotic communities as assessed using the 454 NGS of the 22 samples from various habitats in the region. Multivariate analyses revealed a lack of differentiation of eukaryotes according to habitat type (aquatic versus terrestrial).
DGGE analysis revealed the presence of the Chlorophyte genera Stichococcus,
Pleurastrum, Trebouxia, Prasiola, Ulotrix, Diplosphaera, Neospongiococcum, Xylochloris, Rosenvingiella, Planophila, and Hemichloris in a selection of soil
samples
Fifteen species of lichens and lichenicolous fungi were newly collected in the Sør Rondane Mountains, raising the total number of taxa known for the Sør Rondane Mountains to 25.
In some groups, such as the lichens and the chlorophytes, a relatively large number of taxa/OTUs appeared to be restricted to Antarctica or new to science. For example, 48% of the lichen flora is endemic to the continent. This supports the hypothesis that the study area could have acted as a biological refuge during past glaciations or that the organisms colonized the regions from other ice-free refugia in Antarctica after the Last Glacial Maximum.
An unbalanced sampling effort in the region due to logistical constraints prevented an in-depth and standardized analysis of the diversity in the different nunataks surrounding the Princess Elisabeth Base. Hence, we could not unequivocally assess which region is most diverse in the different taxonomic groups studied. However, on Utsteinen Ridge, we recommend that the plots 17 to 21 (from 71°56’48.6”S, 23°20’47.9’’E to 71°56’44.5”S, 23°20’41.8”E) need careful protection from any human activities in the near and far future given their high lichen species diversity. In addition, the Pingvinane nunataks appeared to be rich in biota.
Additional sampling is needed to further investigate terrestrial and aquatic community structures and elucidate the interactions under the current environment conditions, as well as differences in the diversity of the different nunataks. The microtopography is also probably very important to explain the diversity patterns. A more detailed and extended investigation of the environmental parameters present can give the necessary insights in the nearly 82 % of the variance that could not be explained with our limited set of parameters in the ordination analysis of the soils and crusts. The latest metagenomics and metatranscriptomics approaches would also provide in-depth insights in ecosystem functioning (i.e. interactions between the different Domains
of Life) under the extreme environmental conditions governing this region. This would not only provide us with these ameliorated insights, but would also allow for better predictive power in potential changes associated with Global Change.
D. Contribution of the project in a context of scientific support to a sustainable development policy
Contribution to Committee for Environmental Protection (CEP) meetings as member of the Belgian delegation by Dr. Annick Wilmotte
Environmental impact of the Princess Elisabeth Station – inform users
Dissemination and outreach (e.g. science fair, presentations for primary and
secondary schools, contribution to a blog:
http://www.antarcticabelgium.blogspot.com, interviews in newspapers, a documentary regarding the Princess Elisabeth Station)
E. Keywords
Antarctica, microorganisms, bacteria, cyanobacteria, green algae, global change, lichens, mosses
1. INTRODUCTION
The biological activity in Antarctic terrestrial habitats is dominated by small organisms, including prokaryotes and microeukaryotes, mosses, lichens, fungi, and a few invertebrates such as tardigrades, rotifers and nematodes (Convey et al. 2008; Cowan et al. 2012). This “microbial dominance” is underlain by the combination of the extreme environmental conditions, the isolated nature of Antarctica inhibiting long-distance dispersal of taxa from other continents, and regional extinction in response to glacial-interglacial cycles. The long evolutionary history of Antarctic taxa in geographical isolation and the survival of biota in isolated ice-free refugia also resulted in a highly endemic flora and fauna (Convey et al. 2008).
Despite culminating evidence for endemism among microorganisms in Antarctica (De Wever et al. 2009, Vyverman et al. 2010), the vast majority of ice-free regions remain understudied in terms of their microbial biodiversity. This is particularly the case for inland nunataks in the largely inaccessible mountain chains in East Antarctica such as the Sør Rondane Mountains, the Wohlthat Massif and the Transantarctic Mountains. Recent studies revealed that habitats in these regions contain a relatively large diversity, which is composed of previously undiscovered taxa (e.g. Peeters et al. 2011, Fernandez et al. 2011) possibly due to the fact that they remained ice-free during glacial maxima and as such acted as refugia. Despite this, we largely lack the ‘baseline’ data needed to understand the contribution of various processes that are responsible for the geographical patterns in the diversity and composition of microbiota, lichens and microinvertebrates in these nunataks, and to observe possible future changes in their diversity and taxonomic composition due to ecosystem change and/or human introductions. This is underlain by various causes, in particular the lack of systematic sampling and geographical coverage, and the problems associated with species definition, cryptic diversity and cultivability.
BELDIVA is aimed at (i) obtaining a first integrated biological description of the pristine habitats, including soils, cryoconite holes, bedrock-based lakes, supraglacial water bodies and endolithics in an area of 50 km around the Belgian Princess Elisabeth research station (Sør Rondane Mountains) using state-of-the art sequencing techniques and (ii) studying their response and adaptations to change and the factors that control their spatial distribution.
BELDIVA has the following scientific objectives:
1. Study the importance of airborne propagules in shaping the diversity of terrestrial and aquatic habitats in the Sør Rondane Mountains;
2. Install Open-Top Chambers to mimic future climate warming and its effect on the microbial communities;
3. Study adaptations under the extreme Antarctic conditions by conducting in situ experiments (i.e., photosynthetic efficiency).
4. Study the deglaciation history of the region, which will put the biodiversity data into a temporal framework. By doing so, we will be able to assess whether the region acted as a refuge for biota during glacial maxima;
5. Study the biodiversity of microorganisms (both prokaryotes and eukaryotes), microinvertebrates, lichens and mosses in various habitats in the region with a particular focus on soils;
6. Verify the distribution in representative samples of particular bacterial and cyanobacterial taxa and to integrate our findings with results obtained within other projects;
2. METHODOLOGY AND RESULTS 2.1. Field methods
2.1.1. Air filtration experiments
Air filtration experiments were carried out to assess the importance of wind-driven dispersal of microorganisms, their spores and propagules. Air filtration was performed near the Princess Elisabeth Station in the 2009-2010 and 2010-2011 field seasons. Also near Novolazarevskaya Station, located in Schirmacher oasis, an air filtration experiment was carried out during the 2009-2010 field season. A suction pump and sterile membrane filters were used. The Southern Scientific Shelter (SSS) near the Princess Elisabeth Station was equipped by IPF personnel for the air filtration experiment. Near Novolazarevskaya Station, a small meteorological shelter ~100 m to the east from radio-house was used. Preparations included the installation of a vertical pole for the filter holder, a reinforced silicon tube and electrical wiring. During the 2009-2010 field season one set of filters was used, and the total time of filtration equalled 57.5 hours. Near Novolazarevskaya Station 3 sets of filters were used, and the total time of filtration was 230 hours. During the 2010-2011 field season air filtration was carried out 3 times. The negative control of the filtration experiment was performed on 28 December with one 0.2 µm filter (pore size) that was used for 1 minute. The second period was from 28 December 2010 (12:45) until 14 January 2011 (12:00). One 0.2 µm filter was used. Air filtration speed was 0.56 L/s and the air filtration time equalled 406 hours. The third period was from 17 January 2011 (13:00) until 29 January 2011 (15:35). In total, 3 filters were used, one of 10 µm (on the outer side), one of 2 µm and one of 0.2 µm (on the inner side). The air filtration speed was 0.28 L/s and the air filtration time was 262 hours. The air filtration speed without any filter installed was 0.85 L/s. After filtration all filters were kept in the freezer at -60°C.
In addition to the microbial diversity in the samples of the dust particles, their chemical compositions and back-trajectory was analysed in collaboration with Dr. Alexander Mangold (Royal Meteorological Institute, Belgium) and Prof. Willy Maenhaut (Institute for Nuclear Sciences, Ghent University).
2.1.2. Open-Top Chambers
In order to monitor the composition of microbial communities in response to local simulations of climate change, 8 Open-Top Chambers (OTC) were installed on the Utsteinen ridge, the Tanngarden granite outcrop, the Teltet nunatak and the fourth nunatak of the Pingvinane range.
The OTCs are made of UV-transparent plastic and have the form of a hexagonal pyramid with an open top allowing an exchange with the outside and a limited temperature
increase. The width of the OTCs is 52 cm, the height is 13 cm. A control site marked with spikes and without OTC installed is located on a distance of 1 to 3 m from the OTCs. Chambers are firmly attached to soil surface with spikes and metallic cables. Temperature and humidity probes (i-buttons®) were installed inside and outside the OTC. Annual monitoring of temperature and humidity was carried out.
2.1.3. Photosynthetic efficiency during a day-night cycle
Mechanisms of adaptation of phototrophic microorganisms to permanently cold environments were studied with the use of a portable fluorometer AquaPen AP-P 100 (Photon Systems Instruments, Czech Republic) and a Sky Spectrosense 2 during the 2009-2010 and 2010-2011 field seasons respectively. We followed a diurnal cycle of light intensity (photosynthetically active radiation), biofilm surface temperature and chlorophyll fluorescence (measure of photosynthetic efficiency) in 6 locations of biofilms developing on the Utsteinen ridge. Measurements were performed during 72 hours from 10 Jan (12:00) until 13 Jan (12:00). The time between measurements varied between 3 and 11 hours.
2.1.4. Samples for cosmogenic isotope dating
Samples from moraines and glacial tills were taken using established cosmogenic isotope surface exposure dating techniques, we and others have used to good effect elsewhere in Antarctica (Stone et al., 2003; Bentley et al., 2006) following procedures outlined in detail in Gosse and Philips (2001). The depositional and weathering characteristics of boulders on the most prominent moraine ridge crests was assessed in a systematic manner using classification schemes broadly similar to those in use in other heavily glaciated and extreme environments. A selection of samples was analysed by the UK NERC Cosmogenic Isotope Analysis facility within the project 9102/1010, coordinated by Dr. Steve Roberts (BAS, UK).
2.1.5. Sampling procedures for studying the biodiversity
Samples for the study of the microbial diversity were taken using spatulas sterilized with ethanol and sent frozen to the Belgian laboratories in sterile bags or tubes. Latitude and longitude for the majority of the samples were measured using a Garmin hand held GPS. Under ice water bodies and cryoconite holes were accessed by using a Jiffy ice drill or a made ice drill available on site. Sediments were cored using a custom-made coring device and a Livingston piston corer. Specific conductance, pH, oxygen concentration, temperature and the oxidation-reduction potential of liquid water were measured in the field using a YSI600 meter. Lichens were collected using a hammer and a chisel, placed in paper bags and sent dry to Belgium.
2.2. Laboratory procedures
2.2.1. General prokaryotic diversity
Extracellular DNA was removed following Corinaldesi et al. (2005). Genomic DNA was isolated as described by Zwart et al. (1998). This included a beat-beating method with phenol extraction and ethanol precipitation. After extraction, the DNA was purified on a Wizard column (Promega).
Two approaches were used to study the general prokaryotic diversity. First, we analysed the diversity in a selection of 22 samples from various terrestrial and aquatic habitats in the region, including cryoconite holes, subglacial lakes, supraglacial meltwater pools in contact with bedrock, rocks, soils with varying influence of macroscopic biotic communities and epiphytic on mosses. The V1 till V3 region of the 16S rRNA was amplified using fusion primers containing the 454/Roche adaptor, and the general forward prokaryote primer 27F (5’-AGAGTTTGATCCTGGCTCAG-3’) according to Edwards et al. (1989) with a unique MID (Roche/454) or the general reverse prokaryote primer BKL1 (5’-GTATTACCGCGGCTGCTGGCA-3’). Quantity and quality was checked using a Qubit 2.0 Fluorometer (Life Technologies) and Bioanalyzer (Agilent Technologies). These samples were pooled equimolar and sequenced unidirecionally on a 454 GS FLX Titanium sequencer.
Second, the bacterial diversity was also assessed in more detail in the most abundant habitat type (soils) in 53 samples. We ensured that soils situated on different bedrock types were included, which were furthermore sampled along a gradient of organic matter content. DNA was extracted as described above. Amplicons of the V1-V3 region in this sample set were obtained using the primers described above on an Illumina Miseq. The organic and inorganic carbon content, specific conductivity, water content and pH were measured following the procedures described in Tytgat et al. (in prep.) and included in a multivariate analysis, together with components of a principal coordinate analysis of the geographic coordinates of the samples. This enabled us to assess the effect of environmental variability versus spatial difference on the bacterial community structure.
2.2.2. Cyanobacterial diversity
A polyphasic approach was used to study the uncultivated cyanobacterial diversity (Taton et al. 2006) in biological soil crusts in 10 sites. It included a molecular study using 16S rRNA gene sequences and a microscopic observation of environmental samples as well as isolation of strains.
For strain isolations, the culture media BG11 and BG110 (Rippka et al., 1979) with and without nitrogen were used to isolate non-nitrogen- and nitrogen-fixing cyanobacteria, respectively. Strain cultivation was done at 12 and 18°C to potentially isolate psychrophilic and phychrotolerant strains.
Morphological identification was carried out using the determination keys « Süβwasserflora von Mitteleuropa, Cyanoprokaryota » tome 1 and 2 of J. Komarek and K. Anagnostidis (1999, 2005) and the Bergey’s manual of Systematic Bacteriology (Castenholz, 2001).
Table1: Localizations of the 10 studied sites.“Morpho” stands for the number of samples studied by microscopy and “Mol” for the samples studied by molecular approach.
ID Sampling site Coordinates and altitudes Substrate type Number of samples Morpho / Mol BR Brattnipane 71°29’39”S, 24°22’16”E, 1128 m a.s.l. gneiss 12 / 1 DU Duboisbreen 72°01’06”S, 23°10’5”E, 1531 m a.s.l. gneiss 3 / 1
KE Ketelersbreen 72°06'35''S, 23°11'15''E, 1651 m a.s.l. gneiss 15 / 2
TN Teltet 71° 59’52”S, 23°30’57”E, 1540 m a.s.l. gneiss 6 / 2
VN Vengen 72°04’18”S, 23°23’03”E, 1360 m a.s.l. gneiss 5 / 1 PE Petrelnutten 72°18”S, 22°59’56”E, 1456 m a.s.l. granite 1 / 1 PI Pingvinane 72°18”S, 22°59’56”E, 1456 m a.s.l. granite 20 / 5 TA Tanngarden 72°01’17”S, 22°56’29”E, 1440 m a.s.l. granite 8 / 3 UN Utsteinen Nunatak 71°57’S, 23°20’E, 1415 m a.s.l. granite 22 / 13 UR Utsteinen Ridge 71°56’S, 23°20’E, 1370 m a.s.l. granite 34 / 8 From the 126 samples studied based on the morphology of the cyanobacteria, 37 representative samples were selected based on their diversity and localization to have a large taxonomic and geographic coverage (Table 1). The molecular diversity in these samples were studied based on the 16S rRNA gene sequences. A first study of the samples taken in 2007, to obtain the baseline data of the cyanobacterial diversity before the start of the construction works (Fernandez-Carazo et al. 2012) had shown that with the current DNA extraction protocol, the cyanobacteria with a thick sheath were not detected at the molecular level though they were observed by microscopy. Therefore, a modified protocol based on the method of Zhou et al (1996) was designed and tested. Two steps were added to destroy this protective layer. The environmental sample was ground several times using a micropestle (Eppendorf, Hamburg, Germany) in 250 µL of 0.5 M of EDTA with 0.25 g of glass-beads (0.17-0.18 mm diameter; Braun Biotech, Melsungen, Germany). After grinding, 500 µL of 0.5 M of EDTA was added and the tube
was continuously vortexed horizontally for 20 min. The tubes were centrifuged for 3 min at 16000 g (Centrifuge 5424, Eppendorf) to eliminate the EDTA. The pellet was resuspended in 100 µL of sterile water and 200 µL of a 0.2 M NaOH / 1% SDS solution; which was added by gently mixing by inversion. The tube was incubated for 15 min at 70°C. Subsequently, 150 µL of a cold potassium acetate solution (pH 5.5; 3 M) was added and the tube was gently mixed and placed on ice for 5 min. After centrifugation at 16000 g to separate the pellet containing the cyanobacterial cells and the supernatant containing low quantities of DNA, the DNA was extracted from the pellet as described by Zhou (1996). In addition, the DNA was precipitated from the supernatant by adding 800 µL of 95% ethanol. After 2 min at room temperature, the tube was centrifuged at 16000 g and the pellet was washed with 300 µL of 70% ethanol and air-dried. The DNA extracted from the pellet and from the supernatant were merged for the following experiments. The extracted DNA was purified with the Wizard DNA clean-up system (Promega, Madison WI) and was eluted by adding 50 µL of TE-4 (10 mM TRIS-HCl pH 8; 0.1 Mm EDTA pH 8).
The samples were subsequently analysed by DGGE based on the V3-V4 region of the 16S rRNA as described by Fernandez-Carazo (2012), and the DGGE gels were duplicated for reproducibility. We used two sets of primers 16S378F/16S781RaGC and 16S378F/16S781RbGC as described by Boutte (2006). All the bands were excised out of the DGGE gels, re-amplified by PCR with the primers 16S378F/16S781R and sequenced using 16S378F (GIGA, Liège, Belgium) using an ABI 3730 xls DNA analyzer (Applied Biosystems, Foster City, USA). When several bands from the same samples showed the same sequences, we selected the longest one with the best quality and sequenced it in forward with the primer 16S781R (see Fernandez-Carazo (2012) for more information about the presence of different bands with the same sequence). The sequences were deposited into Genbank with the following accession numbers (KT887889-KT887949). The new sequences were analysed with the ones determined by Fernandez-Carazo (2012) for the same Antarctic region and aligned with the two most similar strain sequences and the most similar uncultured sequence found by SeqMatch of the RDP (Cole 2014). A distance tree was constructed by the Neighbor-joining method (Saitou & Nei 1987) using TREECON (Van de Peer & De Wachter 1994) on partial sequences of 326 bp and a bootstrap analysis was performed that involved the construction of 500 resampled trees. Sequences sharing more than 97.5% of similarity were grouped into Operational Taxonomic Units (OTUs) using MOTHUR using the average neighbor method (Schloss 2009).
2.2.3. Development of specific primers to study the distribution of Flavobacterium During a previous study (AMBIO project), a large number of novel Flavobacterium strains were purified from microbial mats from Antarctic lakes. On the basis of gyrB and 16S rRNA genes it was deduced that many of them might represent novel species for which characterization had started during the AMBIO project. Here we choose 7 of these groups because they contained multiple strains to improve their characterization: to be able to describe and name them, genome-scale genetic differences were assessed using DNA-DNA hybridizations. This method is currently still the international gold standard to establish the taxonomic status of a new species. First, for comparison, type strains of the existing species were obtained: F. aquatile LMG 4008, F. gelidilacus LMG 21477, F.
hibernum LMG 21424, F. johnsoniae LMG 1341, F. micromati LMG 21919, F. reichenbachii LMG 25512 en F. tegetincola LMG 21423. Their identity was confirmed by
partial 16S rRNA gene sequencing and a large-scale DNA extraction was performed from these strains as well as from representative strains of the 7 novel groups. DNA-DNA hybridizations were performed between the novel strains and the reference strains and the results confirmed that groups 3, 5, 8, 9, 10, 11 and 12 represent novel species. The %GC composition of their genomic DNA, a typical descriptive parameter, was determined via HPLC. Phenotypic characters for the differentiation of the novel species will be compiled and type strains deposited in the BCCM/LMG Bacteria Collection to allow the description of 7 new species.
The distribution of Flavobacterium in the region around the Princess Elisabeth Station was assessed in the 53 samples studied using the Illumina technology (2.2.1).
2.2.4. General eukaryotic diversity
The general eukaryotic diversity was assessed using Roche 454 sequencing in the subset of 22 samples described for the analysis of the general prokaryotic diversity (2.2.1) as well as field observations for the mosses and lichens. We sequenced the V4 region of the 18S rRNA gene using the primers TAReuk454FWD1 and TAReukREV3 (Stoeck et al. 2010) as described above for the prokaryotes.
The chlorophyte diversity was assessed in more detail in 22 soil samples using DGGE following the protocols described in Van Gremberghe et al. (2008). Part of the 18S rRNA gene was amplified using primers Euk528f (5’-CCGCGGTAATTCCAGCTC-3’) and CHLOO2r (5’-CTTCGAGCCCCCAACTTTC-3’) according to Zhu et al. (2005). In addition, a nested PCR protocol with primers described by Díez et al. (2001) was applied. The specific Chlorophyte primers Euk1A (5’-CTGGTTGATCCTGCCAG-3’) and CHLOO2r, and the general primers Euk1A and Euk 516r-GC (5’-ACCAGACTTGCCCTCC-3’) were used in the first and second PCR respectively. In the
first PCR, a high specificity was obtained and in the second PCR the fragment was shortened to obtain better profiles by DGGE (Díez et al. 2001; Verleyen et al. 2010). PCR amplification procedures were performed with a T1 Thermocycler (Biometra, Westburg). Each mixture contained 2 µl of template DNA, primers at a concentrations of 0.5 µM (Invitrogen), each deoxynucleoside triphosphate at a concentration of 200 µM (Applied Biosystems), 400 ng of bovine serum albumin (BSA), 5 µl of 10x PCR buffer (100mM Tris-HCl (pH9), 500mM KCL, 2.5 U of Taq DNA polymerase (Applied Biosystems). The mixtures were adjusted to a final volume of 50µl with sterile water (Sigma). The PCR program followed Zhu et al. (2005) for the first set of primers with an annealing temperature of 58°C. The PCR program for the nested PCR from the green algae started with a denaturation step of 5 min at 94°C. In a next step 25 cycles were performed consist of denaturation at 94°C for 30 sec, annealing at 58°C for 45 sec and a primer extension at 72°C for 130 sec, with a final extension at 72°C for 10 min. After the Chlorophyte-specific amplification and purification with a QiaQuick PCR purification kit (QiaGen), 1µl of PCR product was transferred to a new 50µl reaction mixture containing the general primers described above but no BSA and only 1U of Taq DNA polymerase (Applied Biosystems) were added. The PCR program started with a denaturation step of 130 sec at 94°C. In a next step 20 cycles were performed which consisted of denaturation at 94°C for 30 sec, annealing at 56°C for 45 sec and a primer extension at 72°C for 130 sec, with a final extension at 72°C for 30 min. The final PCR product was again purified with the QiaQuick PCR purification kit (QiaGen).
The presence of PCR products was determined by analyzing 5 µl of product on 2% agarose gels, staining with ethidium bromide, and comparison with a molecular weight marker (Smartladder; Eurogentec). Equal amounts of PCR product (700 ng) were applied to the DGGE gels and three standard lanes were analyzed in parallel to the samples. Electrophoresis was performed at 60°C for 16h at 75V. To obtain a matrix with the relative intensity of each band in all samples, the gels were analyzed using the software package Bionumerics 5.1 (Applied Maths BVBA, Kortrijk, Belgium). All the different and strong bands were excised and sequenced after re-extraction and amplification.
Sequencing of the 18S rRNA gene fragments was performed with an ABI-Prism sequencing kit (PE Biosystems) using primer EUK1A and EUK516r for Chlorophyte specific 18S and an automated sequencer (ABI-Prism 377). A nucleotide BLAST search (http://blast.ncbi.nlm.nih.gov/Blast.cgi; 2015) was performed in order to obtain sequences with the greatest significant alignment. Only one mixed band class was present in the matrix obtained using the primers from Zhu et al. (2005), whereas all the band classes were mixed in the dataset obtained using the primers from Diez et al. (2001).
2.2.5. Bioinformatics and multivariate statistics
The obtained reads from the 454 NGS analysis were processed using Mothur (Schloss et al. 2009) version 1.27.0, generally following Schloss et al. (2011) and the Mothur SOP (http://www.mothur.org/wiki/454_SOP; version of 6 November 2012). The data were denoized using Mothur’s PyroNoise (Quince et al. 2009) implementation with 450 flows as the minimal flow length and trimming of the longer sequences to this length. Overall, the minimal required sequence length was set at 200 nucleotides (nt). To avoid poor sequence quality, no ambiguous bases (N) were allowed (Huse et al. 2007) and sequences with homopolymers longer than 8 nt were culled, as it is known that long homopolymers are problematic for 454 pyrosequencing (Schloss et al 2011, Gilles et al. 2011, Datta et al. 2011). The sequences were aligned using Mothur’s alignment command, based on the GreenGenes NAST aligner (DeSantis et al. 2006) with default parameters and the Silva reference database (Quast et al. 2013), which takes into account the secondary structure of the 16S SSU rRNA. The starting and ending positions of the alignment were checked to ensure that sequences were overlapping the same alignment space. Sequences not starting at the correct position or ending before 95% of all the sequences were removed from the analysis. To increase computational speed and decrease data size, duplicate (identical) sequences were temporarily removed using the unique.seqs command. Further correction for erroneous base calls was done using single linkage preclustering according to Huse et al. (2010). Next, we used Uchime (Edgar et al. 2011) with default parameters for intra-sample de novo chimera checking. Positively identified chimeric sequences were removed from further analyses. The sequences were identified using Mothur’s implementation of the RDP classifier (Wang et al. 2007) by means of the modified RDP training-set release 9 (available at
http://www.mothur.org/wiki/RDP_reference_files) at an 80 % bootstrap value for the analysis focusing on the soil dataset (2.2.1). This training set too was first aligned and trimmed to the alignment space of the query sequences, increasing confidence values and reducing the number of unclassified sequences (Werner et al, 2012). Non-cyanobacterial “chloroplast” sequences were removed from the dataset. For the general prokaryotic (2.2.1) and eukaryotic diversity (2.2.4) we used Greengenes and PR2 respectively as training sets. Distances were calculated (dist.seqs command, default settings), after which the sequences were clustered using the average neighbor joining algorithm to generate OTUs at a 97 % cutoff level (Schloss & Westcott 2011). The data were stored in a custom-made SQL database, which will be integrated with national and international data repository centres.
The Illumina generated reads were paired using Usearch (Edgar 2010), setting minimal and maximum paired read lengths, and a maximum mismatch of 6 nucleotides. Sequences were processed with a distinct pipeline. Sequence quality filtering was
performed using Usearch, selecting only reads with a minimum per base Phred score of Q20 and a maximum expected error of 0.5. This allows for a very stringent quality filtering. Chimeric sequences were removed using Uchime, and OTUs were clustered on a 97 % identity cut-off using Uparse (Edgar 2013). Representative sequences of the obtained OTUs were consequently identified using the above mentioned Greengenes training set in Mothur. Further analysis and statistics were performed in R (R Core Team, 2015), with packages Vegan 2.3-0 (Oksanen et al., 2015) for redundancy analysis (Hellinger transformed data and scaled environmental variables) and diversity metrices, and clustsig 1.1 (Whitaker and Christman, 2014) for a SIMPROF analysis (Clarke et al., 2008) with 999 iterations, alpha set to 0.05 and average clustering using the Bray-Curtis distance. SIMPROF is a permutation-based procedure that ranks the pairwise similarities in each group and tests the null hypothesis that samples were all drawn from the same species assemblage.
2.3. Results
2.3.1. Air filtration experiments
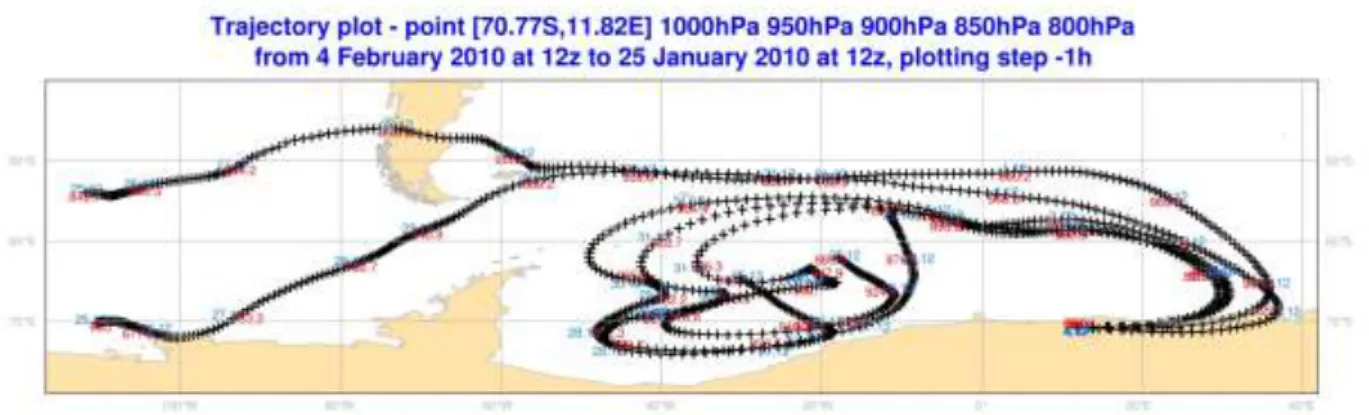
Back trajectory analysis showed that the origin of the air mass near Princess Elisabeth Station is geographically variable and depends on the weather conditions. This was most clearly observed during the 2009-2010 air filtration experiment. Two consecutive air filtration experiments were performed. The first experiment was performed at the end of the stay at Princess Elisabeth Station from 27 Jan (9:30) until 29 Jan (19:00). The wind direction was always from the east (not from the station). The weather was sunny, windy with blowing snow. Air mass origins were calculated using a back trajectory analysis by Dr. Alexander Mangold, and revealed that the probable region of origin was located between 115-145° E and 63-72° S (Fig.1). This includes the areas between Wilkes Land and Victoria Land.
Fig.1: Air trajectory plot of the 2009-2010 experiment at Princess Elisabeth Station.
During the second experiment near Novolazarevskaya Station the wind direction was E-SE (not from the station; Fig.2). Contrary to the first air filtration, the weather was cloudy with high wind speed (up to 20 m/s) due to consecutive cyclone events. Back trajectory
analysis revealed that the probable regions of the air masses was located between 100-120° W, 50-70° S and 20-40° W, 50-60° S. One of the back trajectories of the air masses crossed South America at approximately 45° S in Patagonian. These results show that the air masses during cyclone events could be a possible way of long-distance transport of microorganisms between continents.
Fig. 2: Air trajectory plot of the 2009-2010 experiment at Novolazarevskaya Station.
The molecular diversity analysis of the filters with primers specific for cyanobacteria did not give a positive signal. Probably the concentration of cyanobacterial cells (if present) was below detection limit.
2.3.2. Open-top-Chambers
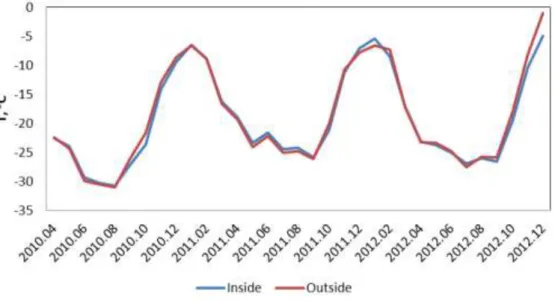
Analysis of the data recorded by loggers between April 2010 and December 2012 showed that mean yearly temperature inside of the chamber is up to 5.8°C higher than the temperature outside of the OTC (Fig. 3 & 4). In some cases the temperature was higher outside the OTC, probably as a result of the longer persistence of snow in the OTC leading to a more buffered temperature regime. Maximal temperature recorded inside of the chamber reached +27°C. Minimal recorded temperature was -41.1°C. Lower temperatures could not be recorded because of the detection limit of the logger.
Fig.3: Mean monthly air temperature inside and outside OTC1 between April 2010 and December 2012.
Fig. 4: Mean monthly air temperature inside and outside OTC5 between April 2010 and December 2012.
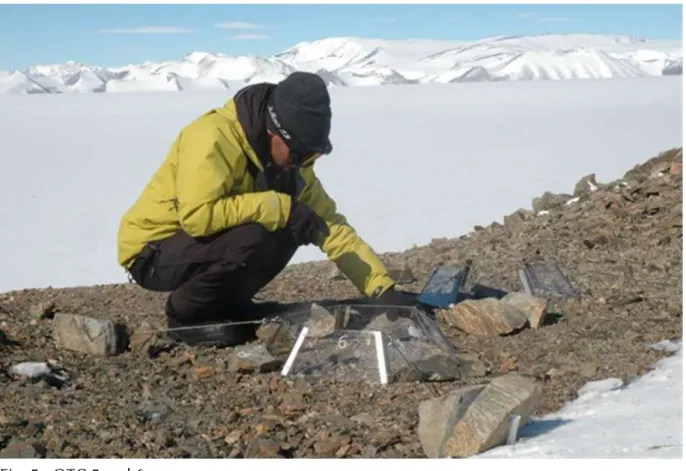
The biological soil crust coverage in the OTCs and the control sites was determined from digital photographs (Fig. 5). The majority of OTCs were filled with snow and it was impossible to accurately measure crust coverage. Changes between the 2009-2010 and 2010-2011 seasons were analysed in 2 chambers from Pingvinane and 1 chamber from Tanngarden. There was no significant change in coverage and the values were within the standard deviation range. Probably the changes in the soil crust coverage will become detectable after longer incubation time.
OTC 3, 2010 - 3.7 - 7.5%, average 5.6, SD 2.69 OTC 3, 2011 - 6.4 - 7%, average 6.7, SD 0.42 OTC 4, 2010 - 5.5 - 6.4%, average 5.95, SD 0,63 OTC 4, 2011 - 4.6 - 5.9%, average 5.2, SD 0.91 OTC 8, 2010 - 16.2 - 21%, average 18.6, SD 3.39 OTC 8, 2011 - 15 - 17.2%, average 16.1, SD 1.55
Fig. 5: OTC 5 and 6
The initial state of the cyanobacterial community structure inside the OTCs and control (CT) areas was firstly studied using microscopy. In total eleven morphotypes were observed, namely 1 taxon belonging to the Chroococcales, 5 to the Nostocales, 4 to the Oscillatoriales and 1 to the Stigonematales. In samples from Teltet no cyanobacterial cells were observed. In samples from Utsteinen only one morphotype, Phormidium
priestleyi, was observed in the CT1 sample. In Pingvinane, 7 morphotypes were
observed in samples from both OTC3 and OTC4 and 3 in the CT of 34. In Tanngarden 4 morphotypes were identified in OTC7 and the CT78 samples and 5 in the sample from OTC8.
2.3.3. Photosynthetic efficiency
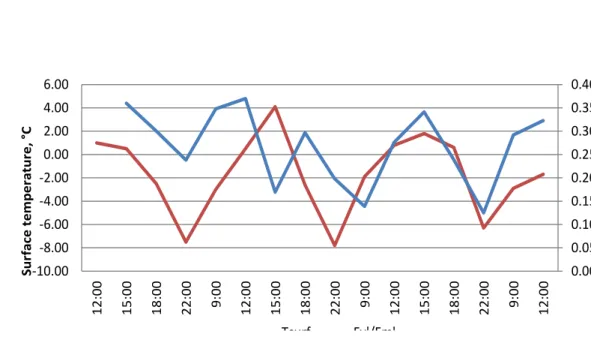
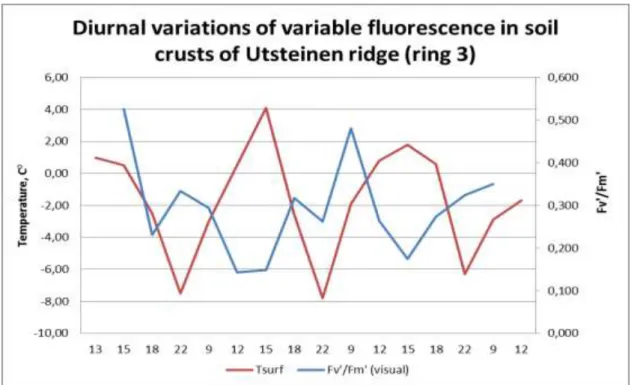
Air temperature was always negative (between -2 and -12 °C). The surface temperature varied between 4.1 and -7.8 °C. Photosynthetically active radiation varied between 43 and 1608 mol. The results obtained during the experiments were contradictory. In all 6 cases variable fluorescence (Fv'/Fm') changed during the daily cycle. But in some of the biofilms the changes of fluorescence followed changes of temperature and light intensity (for example ring 1; Fig.6) and in other biofilms the changes of fluorescence were controlled by other factors than temperature and light intensity (for example ring 3; Fig.7). The OJIP curve showed that cyanobacteria were probably photosynthetically active even at a temperature of -7.8°C.
0.000 0.050 0.100 0.150 0.200 0.250 0.300 0.350 0.400 -10.00 -8.00 -6.00 -4.00 -2.00 0.00 2.00 4.00 6.00 12 :00 15 :0 0 18 :0 0 22 :0 0 9: 00 12 :0 0 15 :0 0 18 :0 0 22 :0 0 9: 00 12 :0 0 15 :00 18 :0 0 22 :0 0 9: 00 12 :0 0 Su rf ace t em p er atu re, ° C Tsurf Fv'/Fm'
Fig. 7: Diurnal variations of variable fluorescence in soil crusts of Utsteinen ridge (ring 3)
2.3.4. Deglaciation history and cosmogenic isotopes
A total of 106 samples were collected for cosmogenic surface exposure dating analysis in the Teltet, Duboisbreen, Ketelersbreen, Pingvinane, Brattnipane, Utsteinen, Vikinghøgda regions of the Sør Rondane Mountains (Fig. 8). Geomorphologically and geologically, the latter three regions were most promising and a total of 43 of the best samples for preliminary cosmogenic isotope dating were selected for in-depth analysis within the InBev Baillet Latour project DELAQUA. Following exploratory minerogenic analysis, which revealed all samples had experienced a large degree of weathering associated with the particularly harsh climate, a trial-phase using 16 of the most suitable granite-syenite samples from Utsteinen and Vikinghøgda was approved for dating analysis after an analytical application to the NERC Cosmogenic Isotope Analytical Facility (CIAF) in October 2010. ‘Harder-to-analyse’ gneiss samples with less quartz content and a more complex depositional history from Bratnipane were retained for a second dating phase pending results of this first phase. Unlike some previous cosmogenic dating studies in the Sør Rondane region, we used paired Be-10 and Al-26 analyses and focussed on the younger and lower altitude (possibly reflecting LGM-recent) changes in ice-sheet elevation. An isotope approach allowed us to determine burial ages for our samples to see if they had experienced continuous exposure, calculate erosion rates and identify inheritance which might indicate more than one phase of exposure.
All samples analysed so far have a complex exposure history with samples surviving more than one glacial cycle. Erosion-rates are large in both Utsteinen (mean±2s) 7.0±6.1 m Ma-1 and Vikinghogda: 43.3±79.8 m Ma-1, indicating they have all experienced a high degree of recycling, long periods of burial and/or multiple periods of exposure, resulting in large burial age ranges and large age errors. Nevertheless, nunatak areas sampled in Utsteinen and Vikinghogda have amalgamated mean burial ages that suggest the samples have been buried for at least c. 250-300 kyrs during the Late Quaternary. The most-probable mean burial ages of 0.311±0.132 Ma (n=6; mean±RMSE) at Utsteinen and 0.320±0.138 Ma (n=10; mean±RMSE) at Vikinghogda are broadly coincident with Stage 1 of the Moriwaki-Matsuoka glacial history for peripheral areas in the Sør Rondane Mountains. Some of the lower altitude samples have minimum burial ages that suggest they could have been exposed at Utsteinen and Vikinghogda North c. 23 ka.
Fig.8: Sites visited during the BELDIVA 2008-2009 field campaign to obtain samples for cosmogenic isotope dating.
The final first-phase paired Be-Al results were received in October 2014. All show that boulders from even the simplest moraine systems have a similarly complex history. To further investigate the exposure history in this area, isotopes with a shorter half-life, e.g.
C-14 or Ne-21, could be used or sampling should focus on high-altitude sites that are likely to have experienced continuous exposure. C-14 and Ne-21 analytical processes are relatively new and require more time and further analytical or grant applications to provide funding needed.
2.3.5. General prokaryotic diversity
The pyrosequencing analysis revealed the presence of 167,711 sequences of good quality in the 22 samples, which resulted in 1952 OTUs when only OTUs with more than five sequences in the dataset were considered. The sequences belonged to 23 phyla, namely the Acidobacteria, Actinobacteria, Armatimonadetes, Bacterioidetes, BRC1, Chlorobi, Chloroflexi, Cyanobacteria, FBP, Firmicutes, Fusobacteria, Gemmatimonadetes, MVP-21, Nitrospirae, OD1, Planctomycetes, Proteobacteria, Thermi, TM6, TM7, Verrucomicrobia, and WPS-2. Cyanobacteria was the dominant phylum, with the orders Oscillatoriales, Chroococcales, Pseudanabaenales, Nostocales, and Synechococcales. The phyla Proteobacteria, Bacteroidetes, Acidobacteria, the candidate phylum FBP, Actinobacteria, Deinococcus-Thermus, and Armatimonadetes were the other phyla containing an OTU with a relative abundance exceeding 0.5%. The SIMPROF analysis of these 22 samples revealed the existence of a significant cluster, which was solely composed of aquatic samples, including the three lakes and one of the cryoconite holes (Fig.9). The two bedrock-based lakes (11SVI000 and 11SVI005) are dominated by two OTUs that belong to Leptolynbgya, a filamentous cyanobacterial genus. A total of 33.3% of the OTUs occurred in both terrestrial and aquatic samples. Within the terrestrial samples, no clear clustering could be observed according to habitat type. For example, the endolithic samples grouped in three different clusters, which were characterized by the absence or low abundance of the most abundant OTU in the dataset, which was related to the cyanobacterium Phormidium. One of the endolithic samples (11UN007) clustered with a wet soil sample on a lichen (11PER013) and one on a moss (11PER007) due to occurrence of OTUs related to the Armatimonadetes and the Acetobacteraceae (Alphaproteobacteria). One of the other endolithic samples formed a significant cluster with an epilithic sample (11PER001), again due to the shared presence of OTUs belonging to the Chloracidobacteria (Acidobacteria). The third endolithic sample (10DUB026) is dominated by cyanobacterial OTUs belonging to the Chroococcales and formed a significant cluster with samples (10UR081 and 10UR082) which shared unclassified OTUs belonging to other Cyanobacteria, the Acidobacteria, the Actinobacteria and the candidate division FBP. Except for the cluster composed of aquatic samples, every significant cluster contained at least one soil or epilithic sample. It should be noted that due to the different primer sets used, it is not possible to make a direct comparison with the cyanobacterial diversity data obtained by DGGE.
Fig.9: A SIPMROF analysis of the 454 data of the 22 samples showing the significant clusters based on the relative abundances of the prokaryotic OTUs. The names of the endolithic samples are indicated in red, the cryoconite holes in light blue, the lakes in dark blue, the soil and epilithic samples in khaki, and the epiphytic moss samples in light green.
The Illumina sequencing of the 54 soils samples situated on both bedrock types and in habitats with a varying influence of macroscopic organisms and microclimatic conditions resulted in ~404,000 processed high quality sequences divided over 3423 OTUs in 24 phyla and 189 genera. At the genus level, 2594 OTUs, representing 320,000 sequences, remained unclassified, suggesting a large amount of unknown
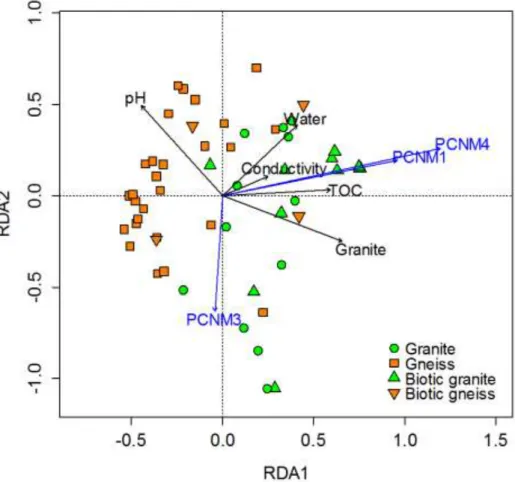
diversity. A SIMPROF (Clarke et al. 2008) and ordination analysis (Fig.10) showed a distinct clustering based on bedrock type (gneiss and granite) and macrobiotic content (moss, lichens and arthropods). Redundancy analysis further showed that indeed bedrock type, but also pH, water content, conductivity and Total Organic Carbon content significantly affected bacterial community structures. An indicator species analysis further showed a distinct association of certain OTUs and taxa with specific environmental parameters.
Fig. 10: Redundancy analysis (RDA) plot of the 53 Illumina sequenced samples. Granite samples are represented by green circles (mineral samples) or triangles (macrobiota samples); gneiss samples are represented by orange squares (mineral samples) or inversed triangles (macrobiota samples). The black arrows denote the abiotic factors while the blue arrows are the principal coordinate components approximating spatial distance between the samples.
2.3.6. Cyanobacterial diversity Strain isolation
Using the cultivation-dependent approach, twenty-eight cyanobacterial strains (ULC146, ULC147, ULC149, ULC152, ULC153, ULC163, ULC165, ULC166, ULC169, ULC172, ULC174, ULC176, ULC179, ULC180, ULC193, ULC194, ULC195, ULC196, ULC197, ULC301, ULC302, ULC303, ULC307, ULC309, ULC317, ULC318, ULC328, ULC329)
were isolated. They belong to the genera Chroococcidiopsis, Phormidium, Microcoleus,
Leptolyngbya, Nostoc, Hassalia and Calothrix. They have been added to the public
Belgian culture collection of cyanobacteria, BCCM/ULC (see http://bccm.belspo.be/about-us/bccm-ulc). Their quasi complete 16S rRNA and the spacer ITS were sequenced.
The morphological diversity
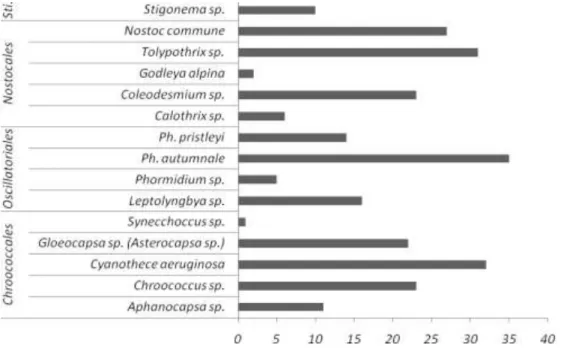
Fifteen morphotypes were observed in the 126 studied samples (Figure 11 and Table 2). Four morphotypes were unicellular and belonged to the Chroococcales, 4 morphotypes belonged to the Oscillatoriales and 6 morphotypes were related to heterocystous cyanobacteria from the Nostocales (5) and the Stigonematales (1). Ten of the 15 observed morphotypes were already described in Fernandez-Carazo et al. (2012) from samples taken in 2007, mostly on the Utsteinen nunatak and ridge. In addition, in the Chroococcales we observed, Aphanocapsa muscicola in ten samples and
Synechococcus elongatus in two crust samples. In the Nostocales order, Calothrix sp.
was observed in four samples and Godleya alpine (Novis & Visnovsky, 2011) in two crust samples whereas Tolypothrix sp. was abundant and found in thirty-one samples Globally, the most abundant morphotypes corresponded to Phormidum autumnale,
Cyanothece aeruginosa, Tolypothrix sp. The richest sampling sites were the ones
composed of granitic rocks (Figure 11, especially the Utsteinen Nunatak (14 morphotypes) and the Utsteinen Ridge (13). The richness in the samples from the five Pingvinane Nunataks was also high with 12 morphotypes observed in total.. However, these three sites were also the most sampled (76 samples). No cyanobacterial morphotypes were observed in the samples from Brattnipane, Duboisbreen and Teltet. Indeed, there were no visible green, black or colored microbial crusts or biofilms in these three sampling sites, but samples of bare gravel, ice, rock or/and sand were collected. Some of them were also used in the study of the molecular diversity.
Figure 11: Occurrence of the 15 morphotypes observed by microscopy in the 126 samples. “Sti.” stands for the Stigonematales.
Table 2: Distribution of the 15 morphotypes in the 10 sampled sites.
Gneiss Granite BR DU KE TN VN PE PI TA UN UR Phormidium sp. Ph. autumnale Ph. pristleyi Leptolyngbya sp. Calothrix sp. Tolypothrix sp. Godleya alpina Coleodesmium sp. Nostoc commune Stigonema sp. Aphanocapsasp. Cyanothece aeruginosa Gloeocapsa sp. (Asterocapsa sp.) Chroococcus sp. Synecchoccus sp.
The molecular diversity
For cyanobacteria, which were the most abundant prokaryotic photoautotrophs, 19 soil samples from 2007 had been studied in detail using DGGE with specific primers, by Fernandez-Carazo et al. (2012) and Obbels et al. (submitted). The modified protocol had enabled us to observe the presence in 8 samples of 10 OTUs not yet observed with the
protocol of Fernandez-Carazo et al. (2012) and which included taxa with large polysaccharidic sheaths (e.g. OTU7 corresponding to Cyanothece aeruginosa, OTU14 corresponding to Chroococcidiopsis sp. and OTU16 corresponding to
Hassalia/Tolypothrix sp.). The modified protocol was further used for the samples from
the field season 2009/10 and 2010/11.
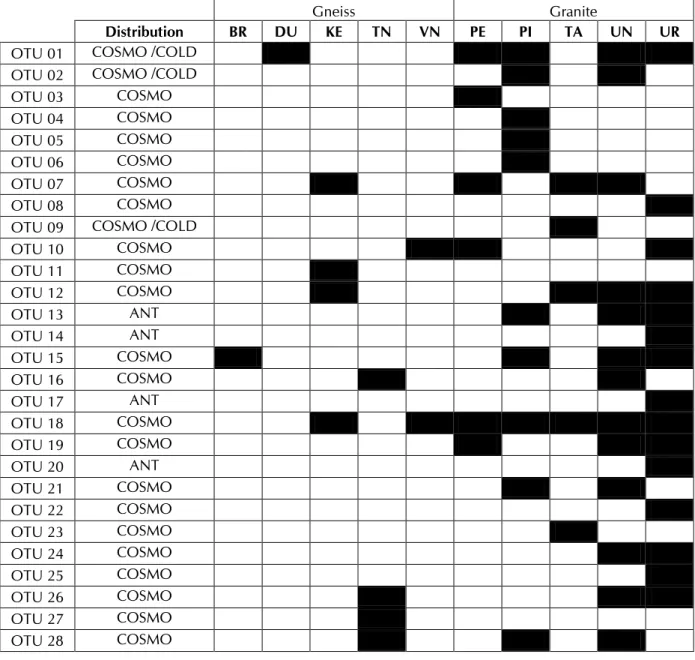
The 58 sequences obtained in this study and the ones from Fernandez-Carazo et al. (2012) were grouped into 28 OTUs sharing at least 97.5% of similarity (Figure 12). The OTUs richness in the samples assessed by DGGE varied between 1 and 5. The richest sampling sites were the Utsteinen nunatak and ridge where we found 13 different OTUs in the 13 samples and 15 OTUs in 8 samples, respectively (Table 3). The Pingvinane nunataks alslo included 10 OTUs in a total of 5 samples. Thus, like for the morphological diversity, the granite substrate seems to hold a more diverse cyanobacterial flora then gneiss. One hypothesis could be that the coarser texture of the rock and the large dimensions of most granite boulders result in a more stable environment leading to a higher diversity. The Utsteinen nunatak and ridge share 8 OTUs, and 7 OTUs are common to Pingvinane and Usteinen (nunatak and/or ridge). The Pingvinane Nunatak is 10 km to East from the Utsteinen Nunatak, which is also along the primary wind direction in this region (Pattyn et al., 2009). In the Taylor Valley (McMurdo Dry Valleys), Michaud et al. (2012) have shown that cyanobacteria were dispersed by high-energy winds following the main wind direction. Our data corroborate the idea that, cyanobacteria might be dispersed locally and survive short-term transportation by wind.
Thanks to the inclusion of identified strains in the OTUs, two OTUs could be affiliated to the Chroococcales, 10 OTUs to the Oscillatoriales and 4 OTUs to the Nostocales (Figure 12). The OTUs 18 and 19 are related to sequences belonging to the species
Phormidium autumnale, a cosmopolitan taxon that was recently transferred to the genus Microcoleus (M. autumnalis (Trevisan ex Gomont) Strunecký, Komárek et Johansen)
after the study of strains from five continents (Strunecky 2013).
The global geographical distribution of the 28 OTUs showed that 4 of them only included sequences from Antarctica and were potentially endemic (Table 3). The 24 other OTUs had a cosmopolitan distribution and 3 of them seemed restricted to cold areas like glaciers and Alpine regions. This supports the conclusion of Namsaraev et al. (2010) that cosmopolitan cyanobacterial OTUs dominate the Antarctic terrestrial habitats.
Table 3: Distribution of the 28 OTUs in the 10 sampled sites
Gneiss Granite
Distribution BR DU KE TN VN PE PI TA UN UR
OTU 01 COSMO /COLD
OTU 02 COSMO /COLD
OTU 03 COSMO OTU 04 COSMO OTU 05 COSMO OTU 06 COSMO OTU 07 COSMO OTU 08 COSMO
OTU 09 COSMO /COLD
OTU 10 COSMO OTU 11 COSMO OTU 12 COSMO OTU 13 ANT OTU 14 ANT OTU 15 COSMO OTU 16 COSMO OTU 17 ANT OTU 18 COSMO OTU 19 COSMO OTU 20 ANT OTU 21 COSMO OTU 22 COSMO OTU 23 COSMO OTU 24 COSMO OTU 25 COSMO OTU 26 COSMO OTU 27 COSMO OTU 28 COSMO
Figure 12 (next two pages): Distance tree based on partial (361 bp) 16S rRNA sequences of the sequences obtained in this study and in Fernandez-Carazo (2012) which are marked in red plus, for each sequence, 1 most related strain sequences and 1 uncultured. Indels were not taken into account. The dissimilarities were corrected for multiple mutations by the model of Jukes and Cantor and a tree was built with the Neighbor-joining method implemented in the software TREECON (Van de Peer & De Wachter, 1994). The bootstrap percentages (1000 resamplings) are indicated besides the concerned nodes if they are higher than 70% and the branches below this threshold were collapsed. The outgroup is Escherichia coli. The OTUs delimitation is indicated by a bracket.
BELISA - BELGIAN PRINCESS ELISABETH STATION 33
Distance 0.1
Pleurocapsa cf. concharum 1d-08
Plankt. cryptovaginata 3/Kutnar09 Trichocoleus sociatus SAG26.92.
Microcoleus antarcticus UTCC 474. cyanobacterium OU_20.
07UN34D5b3 (HM101212) 10KE24b01S
cyanobacterium Arctic cCLB-2.
09TN04b02C
uncultured Antarctic UMAB-cl-45.
uncultured Antarctic 23-20.
07UN34D1b2 (HM101198)
Leptolyngbya sp. Kovacik 1990/54.
uncultured Nostoc sp. DOL33.
09UR18b02S 07UN34D1b1 (HM101197) 10TA31b01S 09TN04b01C 07UN196D1b1 (HM101191) Antarctic clone BGC-Fr078. 07UN50Dc5b (HM101201) 09UN32a04C 10PI11a02S Phormidium sp. Ant-Lunch. 09UNE51b01S x3 09UN48b08C Oscillatoria sp. PCC 7112. 07PE144D2a2 (HM101180) Tychonema sp. P2r.
unidentified cyano Ni2-C1.
Leptolyngbya compacta GSE-PSE28-08A
uncultured Antarctic PB17018-1_F01. 09UN48b06C 10KE24a02C 10TA31a04S 10TA32b01C 10PE38a01S Leptolyngbya sp. CCMEE6124.
uncultured soil crust lichen29
Chlorella saccharophila; 3.80. Cyanothece aeruginosa NIVA-CYA258/2.
uncultured nbu56c08c1. uncultured 3GB21_K52.
07UR160D8b1 (HM101184)
uncultured soil crust moss3.
uncultured glacier KuyT-IWPS-70. uncultured AM-20-3.
10PI11b03S
Leptolyngbya sp. CCMEE6119.
Crinalium epipsammum (T) SAG22.89
07UR183D2b2 (HM101220) 10PE38b03C Phormidium sp. PMC301.07. uncultured ncd942f02c1. Coleodesmium sp. ANT.L52B.5. uncultured Arctic B9_61. 09UNE46b04C Chroococcidiopsis sp. CCMEE6048.
uncultured soil M37_Pitesti.
07UN34D1a1 (HM101196) 07UN196D3a1 (HM101208)
Phormidium autumnale CYN53.
uncultured Alpine Oscillatoriales QB96
09PI20b09C
uncult Antarctic UMAB-cl-35.
09UN45b01S
uncultured Antarctic LB3-53.
09UR90a05S
10DU26b04C x3
uncultured Antarctic H01_ELL02.
09UR01b02S
07UR183D7b1 (HM101207)
09UR01a02S x4
10PE38b04S1
uncultured Antarctic UMAB-cl-50. uncultured Arctic AlertG10.
09UR18a03C
uncultured Alpine B108211B.
10TA36b01C
Phormidium sp. D1_2.
uncultured Antarctic 1A-E9FF9.
Chroococcidiopsis sp. CC1.
uncultured glacier AK4DE1_08B.
07UR183D1a1 (HM101187)
Tychonema bourrellyi NIVA-CYA58 uncultured alpine Be_074.
Pseudanabaenaceae VUW28. uncultured BK-20-11.
uncultured Antarctic 23-18.
09UNE46b08C
Phormidium priestleyi ANT.LMA.2. Phormidium priestleyi ANT.L66.1.
07UN42Ds3b (HM101200) 09PI21b10C x4 07UN196D2b2 (HM101192) 07UR160D2b1 (HM101183) uncultured Phormidium sp. 5f-12 uncultured Arctic B9_81. cyanobacterium Arctic cCLA-4. Phormidium priestleyi ANT.LG2.4.
09PI60b03C 09UN47b04C 10PE38b07S x4
Phormidium priestleyi ULC147. uncultured B1_6_1B_88. uncultured Antarctic H-D14. unidentified IL-12.3 10PI11b03C x3 Leptolyngbya sp. WJT25-NPbg1. uncultured clone 014.
cyanobacterium Arctic cCLA-3. Leptolyngbya tenuis PMC304.07. uncultured Antarctic MPB1-3. uncultured Antarctic RJ088. 07UN33D3b3 (HM101210) 07PE144D5b3 (HM101214) uncultured Antarctic R8-R13. Leptolyngbya sp. ANT.RI8.1. Leptolyngbya sp. ANT.L52.1. Leptolyngbya sp. OU_6. 07PE144D1b1 (HM101179) 07UN195D1b1 (HM101188) 10PE38b04C3 x3 10TA36b08S x2
uncultured Antarctic TM4LUCF12
09UR18b01S
uncultured glacier gs59 uncultured alpine B10912H
uncultured alpine B108208E uncultured alpine B108208H. 07UR160D1b2 (HM101182) 10VN22b01S Synechococcus sp. UH7. Synechococcus sp. KUAC 3049. uncultured Juncus02D. 07UR164DC1b2 (HM101223) 10TN15b03C uncultured alpine B107212C. 09PI59b14S 09UN32a03C 07UR196DC2b1 (HM101217) 07UR164D5b1 (HM101219) 09BR82a03S 09PI59b10S 07UR160D3b1 (HM101222) 07UR160D2b2 (HM101221) 09UR16b04S
uncultured Antarctic UMAB-cl-181. Chroococcidiopsis sp. CC3. Chroococcidiopsis A789-2 CCMEE171
uncult Antarctic Nostocales C_16
09PI20a03C
07UN42Ds3a (HM101199)
uncultured glacier AK4AB1_05A. cyanobacterium Arctic cCLB-9. 09UNE02a02C 09UNE51a01S 10TN15a03S 09UNE46b01C 09UN32b01S 09UN32b02S 09TN04b03C 09UR17a01C uncultured NGH5. Chroococcus sp. VP2-07. Chroococcus sp. VP2-04c.
enrich Antarctic 3_10_3.1.5_E11-T7 Hassallia antarctica CCALA955.
09PI59a01C x2 09UN45a03C
uncultured Antarctic PB17018-1_A07. Hassallia antarctica CCALA956. Hassallia andreassenii CCALA954.
09PI20a09C Toxopsis calypsus PLF 3. uncultured glacier S282. Nostoc cf. indistinguendum F15-VF4 10TA36a04S uncultured CNY_03379. Stigonema ocellatum SAG 48.90. Nostoc 'Stereocaulon exutum'I28958. uncultured glacier YAS-3-87
09UN48a04S x3
07UR164D1a2 (HM101186)
uncultured glacier YAS-3-90. uncultured alpine FQSS103.
07UN196D5a2 (HM101209)
uncultured LaP15L66.
uncultured Antarctic c30. Microcoleus rushforthii UTCC296
09UR16a03S
Phormidium autumnale VUW5. Phormidium autumnale VUW14. uncultured Antarctic M4_39. Phormidium autumnale VUW16.
07UN50Ds2a (HM101202) uncultured RRD14.0May-91. 07UN33D1a1 (HM101193) 10VN22a03C Microcoleus vaginatus PCC9802 07UR160D1b1 (HM101205) Phormidium sp. Ant-Orange. 96 92 87 99 95 98 100 97 82 100 75 88 71 78 89 99 94 91 89 78 100 94 89 94 99 96 94 71 100 90 96 100 79 92 88 93 100 80 83 100 89 93 84 73 85 93 85 85 95 100 84 100 100 84 92 88 100 100 99 96 100 100 99 92 79 86 71 100 71 100 1 2 3 4 5 6 12 7 11 8 9 10 17 16 13 14 15