To cite this version :
Bonnin, Marie
and Azzaro-Pantel, Catherine
and Pibouleau, Luc
and Domenech, Serge
and Villeneuve, Jacques Development and
validation of a dynamic material flow analysis model for French copper
cycle. (2013) Chemical Engineering Research and Design, vol.91 (n° 8).
pp. 1390-1402. 0263-8762
O
pen
A
rchive
T
OULOUSE
A
rchive
O
uverte (
OATAO
)
OATAO is an open access repository that collects the work of some Toulouse researchers
and makes it freely available over the web where possible.
This is an author’s version published in :
http://oatao.univ-toulouse.fr/9731
Official URL : https://dx.doi.org/10.1016/j.cherd.2013.03.016
Any correspondence concerning this service should be sent to the repository administrator :
[email protected]
Development and validation of a dynamic material flow
analysis model for French copper cycle
Marie
Bonnin
a
,
*
,
Catherine
Azzaro-Pantel
a,
Luc
Pibouleau
a,
Serge
Domenech
a, Jacques
Villeneuue
ba Laboratoire de Génie Chimique, LGC UMR CNRS 5503 ENSIACET INPT, 4 allée Emile Monso, BP 84234, 31432 Toulouse Cedex 4, France b Bureau de Recherche Géologique et Minière, 3 avenue Claude-Guillemin, BP 36009, 45060 Orléans Cedex 2, France
ABSTRACT
This study performs a quantitative description of the copper life cycle at the scale of France from 2000 to 2009 with special focus on waste streams. The approach is based on substance flow analysis and includes data reconciliation. The mode! takes into account the relationships between economic system, resource consumption, product man ufacturing, waste generation and pollution, thus broadening the traditional scope of process systems engineering. The more important results concern waste management since France exports most of its col!ected copper wastes because there is no industry for recycling low-grade scrap. The paper shows the interest of using substance flow analysis methodology coupled with data reconciliation to obtain a precise cartography of a substance flow inside a large area. Indeed, statistic data from institutional organisms and industries may vary from one source to the other, and the utilization of the redundancy of information is an efficient tool for obtaining more precise data. Moreover, the dynamic analysis allows modeUing the stock evolution with more accuracy than in previous studies. FinaUy, the results are compared with existing values for other countries or continents, and some perspectives concerning the use of copper in France are given.
Keywords: Substance flow analysis; Resources management; Copper; Data reconciliation; Stocks and flows
1. Introduction
More than twenty years after the release of the Brundtland report and the first definition of sustainable development, many questions still focus on the evaluation of systems unsustainability, and the way to reach a sustainable state. The paradigmatic vision of a sustainable industrial system is characterized by minimal physical exchanges with the environment, with internai material loops being driven by renewable energy flows. However, in the current situation, the industrial metabolism is still depleting its resources and over loading the environment with wastes and emissions in many respects.
This is especially true in the metal industry, in particu lar in the case of copper. Indeed, copper is the third metal used in the world after iron and aluminium (Muchova et al., 2011), it is used in a wide range of applications (electricity, electronic equipment, building, chemistry, etc.), it is expen sive and pure copper is infinitely recyclable at 100% without any property losses. Moreover, according to Ayres et al. (2002), copper production peak is likely to occur before the end of the 2020s, while demand should continue to grow for several more decades. Thus, according to Graedel et al. (2004) deple tion should arrive no later than the 2050s and according to
Jamet et al. (2009), world copper reserves will be exhausted by 2030.
Abbreviations: C&D, construction and demolition waste; DM, dry material; EEE, electrical and electronic equipment; ELV, end of life vehicles; !&HW, industrial and hazardous waste; LCA, life cycle assessment; MFA, material flow analysis; MSW, municipal solid waste; RSMW, residual municipal solid waste; SFA, substance flow analysis; SS, sewage sludge; STAF, stocks and flows; WEEE, waste from electrical and electronic equipment.
• Corresponding author. Tel.: +33 534323664.
In countries with no copper ores, as it the case for France, this situation will lead very quickly to problems in new refined copper supply. Thus, there is an urgent need to know where copper is used, stocked and lost along its life cycle, to guide decision makers in taking good management decision to face this situation.
Material flow analysis (MFA} is the analysis of flows in every stream of a process, including extraction or harvest ing, chemical processing, product manufacturing, material consumption, recycling or material elimination. This flow analysis is based on flow account in physical units (tons) that quantify inputs and outputs of a process. Involved data can be chemicals (C, CO2, etc.), natural compounds
or techniques as well as bulk materials (coal, wood, etc.). Accounting of any substance has a clear link with eco nomic accounting: MFA covers mass flow analysis in an economic system. Substance flow analysis (SFA} is a kind of MFA that is used when only one specific chemical is stud ied (Ayres and Ayres, 2002}, which is the case in this study. This tool is thus commonly used in the industry at process scale, sometimes combined with a life cycle assessment to obtain very accurate data on environmental impacts of a process Oeswani et al., 2010}. However, it is also a powerful tool to study the industrial metabolism of a substance (for instance a metal) at a regional scale. The interest of SFA and MFA to draw substances cycle, as described by Brunner and Rechberger (2004}, has already been highlighted by many stud ies.
In fact, different works have already been conducted on the implementation of SFA to help facing problematic of copper management, especially in the framework of the stocks and flows (STAF} project initiated by the Center for Industrial Ecol ogy at Yale University: a macro-level study has been conducted on the characterization of the Europe an copper cycle and on its waste management subsystem (Bertram et al., 2002}, as well as a study on the copper stocks and flows in Asia by Kapur et al. (2003} and North America by Spatari et al. (2005}; more over, substance flow analysis of copper (and other metals) have been carried out in many other area, most of them based on the "STAF model", for instance by Guo and Song (2008} in China, by Daigo et al. (2009} in Japan and by Tanimoto et al. (2010} in Brazil. In these different works, methodologies and tools were proposed to conduct and analyse material flow analysis. Finally a study conducted by Graedel et al. (2004}
presents many copper cycles performed on an annual basis at different governmental unit levels: country, region and planet. This work was also conducted within the framework of the STAF project and aimed at giving global information on the anthropogenic copper cycle. Therefore French copper cycle was performed among others and is available in the suppor ting information linked to this paper; results are discussed in
Section 4.
This work aims at developing a more comprehensive methodology, based on the application and validation of the STAF model on the French copper cycle from year 2000 until 2009, with a special emphasis on data reconciliation and on the dynamic behaviour of the system. The methodology is described in Section 2, along with the definition of the sys tem. Then, Section 3.1 presents how data collection with a significant level of accuracy was conducted, and Section 3.2
deals with data reconciliation. Moreover, attention is focused on the waste streams, which can be considered as a secondary material source rather an environmental burden as described in Section 3.1.5.
2. Methodology
2.1. System boundaries
According to Brunner and Rechberger (2004} definition, "MFA is systematic assessment of materials within a system defined in space and time". In other words, MFA gives information of a material mass flow into defined boundaries. As this study consists in evaluating French copper cycle, the space bound ary is obviously France. In fact, given that the decisions are taken at a country level, SFA is applied at this level. The time boundary is based on ten years, to obtain not only a picture at a specific time but also an overview of the evolution in the recent past. Thus it is possible to take into account the evolu tion of the addition of copper into the technosphere, and this can be useful to anticipate consumption scenarios in the near future. Indeed the evolution of copper production, fabrication, use and waste production has been very important along the twentieth century all around the world. Yet, with the increas ing use in electric and electronic equipment, this evolution has changed radically since the end of the last century, which justifies a study on a 10-year period.
Moreover, a study has already been conducted to carry out the dynamic copper cycle in North America, which gives a good understanding of copper cycle evolution along the twentieth century. However, the lack of data, especially con cerning product end-uses and product residence times, leads to many modelling assumptions thus providing, according to the authors, quite high uncertainty in results (Spatari et al., 2005). Furthermore, this study shows that for most of the flows (trade, use and stock), the evolution has varied a lot from 1900 to about 1995 and then has started to increase very quickly, as society is more and more a material-intensive industrial one. That is why this paper only focuses on the recent past: fairly accurate data have been available for most of the flows since the end of the twentieth century and flows change has known a break at the end of the twentieth century that does not allow using past trends for prediction purpose.
The choice of such a large area for the space boundary leads to a major issue insofar as every flow of materials containing copper has to be identified and estimated. This means that the entire life cycle of copper in France has to be considered.
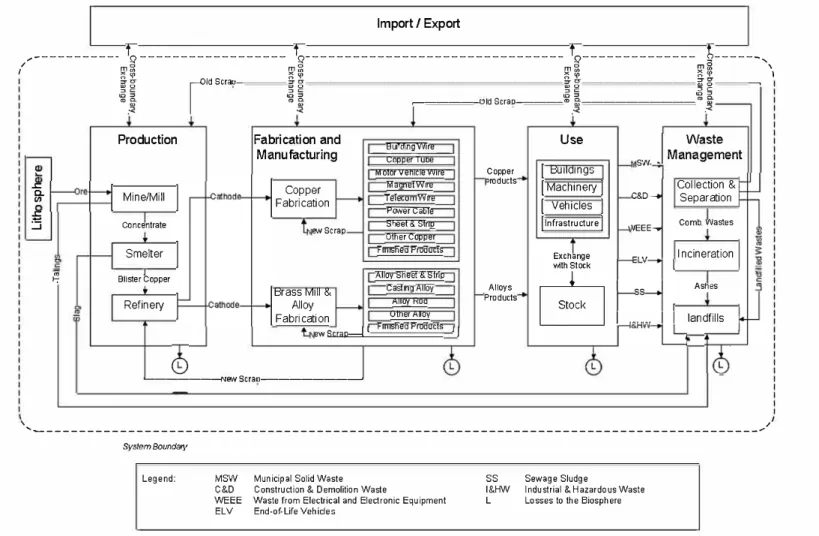
Along its life cycle, usually a metal passes through four major steps: first it is extracted and transformed into a refined metal, then, semi-finished and finished products are manu factured, then the products are used, and finally, they become wastes that have to be managed. Fig. 1 presents the system boundaries of the French copper cycle. As mentioned earlier, a similar representation has been used in the STAF model.
Fig. 1 shows every copper flow and stock that has to be determined, including importations and exportations, lasses into the environment as wastes and emissions, recycling, etc. The objective is to collect as much data as possible even if a redundant system is obtained, as explained in Section 3.2.
2.2. Flows and stocks estimation
The system under study concerns only material flows, and the calculation of both stocks and flows, which is then based only on the principle of mass conservation (Eq. (1), with I the importations, P the production, C the consumption, S the stock and E the exportation flows), is performed.
Import/ Export
,--- �--- �--- �---
�---/ ma ma ma m � ', I �; ,o---� ; ______________________ � ; __________ � C(I \ �§ :,- a- r l§ �§ �s ld Sera ::::,- cr ::::,- o- � g ___ � ..c: a. V).s
::J ,;; 1-;-CD g. m � �---Uld ScraP---"' g-__________ m!
.'< '< .'< . Production Mine/Mill Concentrate Smelter Blister Copper Refinery Fabrication and Manu facturing Copper F abri cati on ew ScrapBrass Mill & Alloy
F abri cati on
BiiTéliiigWire CO!!fl.Sr Tube M otor Vehicle Wire
Ma_g_netWire TelecomW1re Poiverca61e Sneel&Sîn!'. l:lllierC op p e r F m,shed Products
Alloy Sheet & Slrip Casting Alify
All.<1t.Rod
Other AUoy
ew Scrap-1 1 fm,shed Products
�---<,ew Scrao---�
'I
Copper roducts Alloys ·Products Use 1 Waste sw _ Management 1 Buildings 1 Machinery 1J
Collection & 1 Vehicles 1 Separation!
Infrastructure 1 Comb. WastesExchange 1 ncineration vvith Stock
[È]
1 -- 1 Ashes1
•-• N�O1
1
landfills'
'---�
,
System Bounda,yLegend: MSW Municipal Solid Waste
C&D Construction & Demolition Waste
WEEE Waste from Electrical and Electronic Equipment
ELV End-of-Life Vehicles
SS Sewage Sludge
l&HW Indu striai & Hazardous Waste
L Lasses to the Biosphere
Fig. 1 - French copper cycle system boundary (Graedel et al., 2002). Reprinted from T.E. Graedel, M. Bertram, K. Fuse, R.B. Gordon, R. Lifset, H. Rechberger, S. Spatari, The contemporary European copper cycle: the characterization of technological copper cycles, Ecological Economies 42, 9-26, Copyright (2002), with permission from Elsevier.
"' z "'"' z "' "'
"'
en )> n: tJ tJ"' en i;'î z "" "' 0 w r-' w"'"
0The determination of the flows is firstly carried out by col lecting data in public database, as detailed in Section 3.1. However, some data are not available or are available from dif ferent sources and may be slightly different according to the sources. Furthermore, when all the flows concerning a pro cess are known, the mass balance may not be satisfied. This can be explained by the fact that data are not accurate, and unfortunately, the uncertainty on values is rarely given by the different reports used in this study. Moreover, depending on the sources, data have to be aggregated or disaggregated to obtain similar precision levels, which also leads to uncertain ties. For these reasons, data uncertainty has to be evaluated and the mass balance satisfaction leads to validation and rec onciliation issues, as discussed in Section 3.2.
3. Data collection and reconciliation
3.1.
Data
collection1\vo methods can be used to quantify stocks and flows: identi fication of each particular flow from organisms or companies (bottom-up), or identification of macro-level flows and use of branching ratio to allocate them (top-down) (Tanimoto et al., 2010}. The former method seems more precise than the lat ter one and will be used as often as possible. lt must be yet emphasized that because of data scarcity, the latter was also implemented.
Therefore, an exhaustive data collection was performed, involving various sources, in particular the International Cop per Study Group (ICSG, 2012} for every flow of production, fabrication and manufacturing steps, the French agency of environment and energy management (ADEME, 2012a} for use and waste flows, the import/export customs and the lnterprofessional Technical Center for Atmospheric Emission Study (CITEPA, 2012} for emissions into environment. How ever, regardless of the sources, no quantified information was given on uncertainty. As mentioned by Graedel et al. (2004}, dif ferent alternative approaches exist to assess the uncertainty of data but neither of them seems appropriate in the case of copper cycle data, due to the different sources involved and/or to the calculation performed with different degrees of uncertainty. This explains why the same approach based on Moss and Schneider proposa!, with a five-point quantitative scale for confidence levels (Graedel et al., 2004}, was adopted. Thus, when data were directly available from one of the above cited accurate sources, the confidence level was estimated to be "high" (±5-33%), otherwise, depending on the source and calculation, the confidence level was specified as "medium" (±33-67%), "low" (±67-95%) or "very low" (>±95%). Consider ing that data are evaluated by measurement of samples or through company statements, the confidence level was never estimated as being "very high" (<±5%).
3.1.1. Production
In France, there are no more copper extraction industries: the only copper refinery that worked in France was closed in 1998
43% -Electrical materials -Building c=JTransport equipment � Mecanical industry c=J Equipment -Chemical/Metalurgy -Others 1%3% 6% 29%
Fig. 2 - Oudets of copper (Gie et al., 2010).
12%
(SCF, 2006). Nowadays, France imports directly refined copper, thus nearly every flow in the production stage is null (ICSG, 2010}, small import and export flows exist but only because of some existing stocks and also for economical reasons. For these reasons, their impact was neglected in this study. 3.1.2. Fabrication and manufacturing
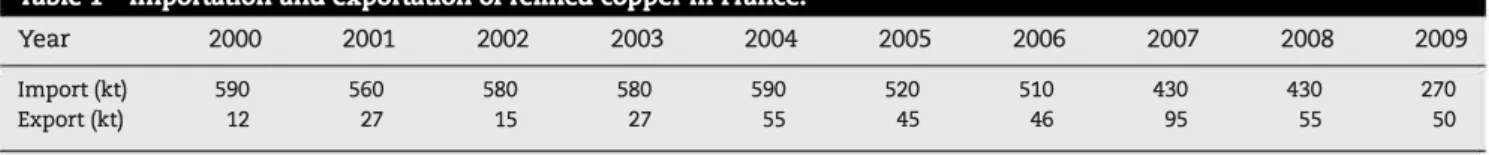
From the imported refined copper (see Table 1} (ICSG, 2010}, semi-products and products are manufactured in France. However, some refined copper is also exported: as no more refined copper is produced in France, it is probably copper imported during previous years that is exported due to the market demand. As shown in Table 2, the amount of copper contained in finished products manufactured in France has been decreasing slowly since 2000 (Gie et al., 2010}.
There is no data on the allocation of either copper or copper-based product in the different categories of finished products manufactured in France. lt is assumed that the prod ucts are manufactured with the same ratio as they are used (see Section 3.1.3}.
3.1.3. Use
The outlets of copper can be divided into seven categories, the importance of each is represented on the chart in Fig. 2 (Gie et al., 2010}.
The main outlet for copper (43%} is electrical equipment, including threads and cables, due to the very good electric properties of copper. The second outlet is building (29%}, mainly for electric cables but also for roofs, gutters and pipes. The third one is transport equipment (12%}: the copper can especially be found in car brakes and train concatenate. These three outlets account for more than 80% of the copper out lets. The remaining is shared between mechanical industry, equipment, chemistry and metallurgy and some other minor uses.
Table 1 - Importation and exportation of refined copper in France. Year Import (kt) Export (kt) Source: ICSG (2010). 2000 590 12 2001 560 27 2002 580 15 2003 580 27 2004 590 55 2005 520 45 2006 510 46 2007 430 95 2008 430 55 2009 270 50
Table 2 - Quantity of copper in fmished products manufactured in France.
Year 2000 2001 2002 2003
Copper (kt) 610 530 500 460
Source: Gie et al. (2010).
Table 3 - Sources of dissipation of in-use copper to the atmosphere in 2009. Source of dissipation Road transport Other transport Manufacturing ResidentiaVtertiary Energy transformation Agriculture/forestry Source: CITEPA (2012). Percentage 52 35 8.0 2.9 1.6 0.1
Sorne uses of copper are dissipative, but most applications maintain all copper intact inside the fi.nished product. Atmo spheric emissions are estimated every year by the CITEPA (2012) (about 170t/y since 2000) and are mainly due to trans port (see Table 3). Concerning emissions to water and soils, the E-PRTR (2012) registers environmental data from indus trial facilities in European Union countries (and some other Euro pean countries), including industrial emissions of copper into air, water and soi!. Having no other data for water emissions, only industrial emissions will be considered, while emissions from agricultural and farming inputs to soils (about 4900 t/y) will be considered in addition to industrial emissions to the soi! (see Table 4).
A diffi.culty cornes from the estimation of importation and exportation in the use section. According to the customs data from 2000 to 2009 (Eurostat, 2012), the quantities of imported and exported goods in France remain quite stable and are respectively about 340 millions of tons and 190 millions of tons. Among these amounts, the quantity of fi.nished prod ucts represents about 30% of the importation flow in 2006 (against 22% in 1990) and 41% of the exportation flow (against 36% in 1990) 0amet et al., 2009). Moreover, copper and copper based products represent only about 1.3% of importations in 2006 (against 2.5% in 1990), i.e. about 1330 kt of copper-based products were imported in France in 2006. However, there is no information on the copper concentration in these copper based products.
Nevertheless, to get more practical data, a result from a top down approach was used. In fact, within the project Forwast (2012), physical input-output table were designed for France in 2003 by using Eurostat economic table and converting it into a physical table. Considering the copper concentration of each product category, it was determined that approximately 200 kt of copper were imported in fi.nished products whereas
Table 4 - Emission of copper to air, water and soil (in t/y).
Year 2000 2001 2002 2003
Atmospheric emissions 170 170 170 170
Water emissions 1900" 1900" 1900" 13000 Soi! emissions 35" 35" 35" 0.86
Sources: CITEPA (2012), E-PRTR (2012}.
a Estimated data (average of year 2003-2009).
2004 2005 2006 2007 2008
470 430 440 430 390
Table 5 - ln-use stock of copper.
Country In-use stock Reference
United States 270 kg/capita Zeltner et al. (1999}
United States 225 kg/capita Spatari et al. (2005}
Sweden 140---170 kg/capita Landner and Lindestrôm (1999)
West Europe 190 kg/capita Ruhrberg (2006)
Industrialized 230 kg/capita UNEP (2011)
countries
150 kt were exported. Compared with the customs data, this corresponds to a concentration of 15% in imported copper based products, which seems to be a good order of magnitude. The involved data were taken into account and considered identical from 2000 to 2009 with an uncertainty of 67%. In fact, as mentioned in the beginning of this section, top-down approaches are less accurate than bottom up ones, and data on copper concentration in each category of products were also not very accurate.
Furthermore, it has to be highlighted that these values do not take into account indirect flows, which are upstream mobilized to manufacture a product ready to be imported or exported. These flows are not physically imported or exported but they contribute to impacts on the environment and to the generation of copper wastes in the production country. Hence, indirect flows mobilized abroad for the importation of 1 kg of copper ore and copper-based products are about 180 kg Oamet et al., 2009).
3.1.4. In-use stocks
During the past 20 years, different studies have been con ducted to evaluate copper stocks in the technosphere at different geographical levels. These studies generally use data on the number of products marketed since 1900, and the quan tity that is still in used is determined with average lifetime for each category of products. However, according to assumptions on product lifetimes used by different authors, the results may be quite different (Ayres et al., 2002). Table 5 displays the main results found in literature.
These stocks evolved quickly during the 20th century in industrialized countries. For instance, according to the
UNEP (2011), the copper stock per capita in the USA has been increasing linearly between 1932 and 2002 from about 70 to 275 kg/capita, that is a growth of 3 kg/(capita, year), while according to Ruhrberg (2006), the in-use stock in West Europe increases of 5 kg/(capita, year) and of 6 kg/(capita, year)
2004 2005 2006 2007 2008 2009
170 170 170 170 160 170
45 61 45 57 38 61
Table 6 - Copper wastes collected in France from 2000 to 2008.
Year 2000 2001 2002 2003 2004 2005 2006 2007 2008
Copper collected (kt) 290 260 250 230 280 290 320 310 280
Source: Gie et al. (2010).
Table 7 - Evolution of the municipal solid waste production in France. Year
MSW (kg/cap. y.)
Capita (in thousand) MSW(Mt) 2000 440a 59 28• 2001 480 59 29
Sources: Fangeat (2009), Bertram et al. (2002). a Estimated data. 2002 500 60 30 2003 500 60 31
according to Spatari et al. (2002). As there are no data to conduct a more detailed study for French stocks, these results are used to initialize French in-use stock at about 170± 20 % kg/capita in 2000 and additions to stock at 5± 30 % kg/(capita, year).
3.1.5.
Waste management
As indicated previously, a small part of copper wastes results from dissipative use and cannot be collected, e.g. pulverized copper from car brakes. Thus, total emissions from the "use" and "waste management" boxes will be considered for the cal culation but this issue will not be discussed in detail in this study. Copper scrap is produced at different stage of copper life. However, almost all the scrap produced during the fab rication and manufacturing steps are recycled as new scrap, thus in this study only the old scrap, that is copper contained in the end-of-life products, will be considered. Table 6 presents the estimated amount of copper scrap collected in France from 2000 to 2008 (Gie et al., 2010).
However, a more detailed knowledge of the waste streams is necessary to understand more clearly the waste issue. Thus, copper scrap flows are regrouped into six categories of waste: municipal solid waste (MSW), construction and demolition waste (C&D), waste from electric and electronic equipment (WEEE), end-of-life vehicles (ELV), industrial and hazardous waste (I&HW) and sewage sludge (SS). Each of these categories has a specifi.c copper concentration and way of treatment. This is detailed in the following paragraphs.
Municipal
solidwaste
According to the French Ministry of Ecology, Sustainable Development and Energy (2012), the pro duction of MSW is about 500 kg/(capita, year) in France. Table 7gives the available data from 2001 to 2008. Data for the years 2000 and 2009 have been estimated, respectively, as 26 and 32.8 Mt with a standard deviation of 20%.
Table 8 - Construction and demolition waste in France (Mt).
Year 1994 1999 2000 2001 2002 Building 24 31 Civil works C&D waste 160· 210• 240" 270" 290• C&D wasteb 29 38 43 49 52 2004 510 61 32 2005 520 61 32 2006 530 61 33 2007 540 62 34 2008 540 62 34 2009 530• 63 33a
Moreover, according to a study conducted by the BRGM (French Bureau of Geological and Mining Research) for the AD EME, the concentration of copper in French Residual Munic ipal Solid Waste (RSMW) was 56 mg/kg (0.0056%) in 2007, against 1048 mg/kg (0.1048%) in 1993 (Fangeat, 2009). For 1993, MSW flow can be considered as equal to RMSW flow because selective collect was only sporadically applied, while in 2007, selective collect has also to be taken into account. Consider ing selective collect flows given by the SINOE (2013) and the copper concentration in each flow determined in the above mentioned BRGM study, the concentration of copper in MSW in 2007 can be estimated to be about 65 mg/kg. Furthermore, according to Bertram et al. (2002), copper concentration in MSW in Europe in 1994 was comprised between 0.04 and 0.06%. With no more precise data, the copper flow will be taken as decreasing linearly from 0.06% in 2000 to 0.0065% in 2007 and equal to 0.0065% after 2007 with a standard devi ation of 10%. This copper concentration can seem to be very low and the decreasing between 2000 and 2007 very fast, but selective collection in France has made significant progress in recent years, especially regarding small electric and electronic equipment that contains most of the copper found in MSW.
Construction
and
demolitionwaste.
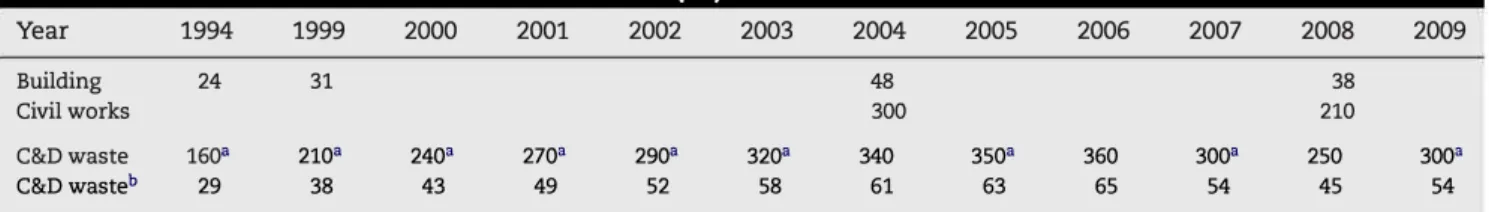
There is a scarcity on data relative to construction and demolition waste. An investi gation by Vernus and de Cazenave (2011) presents the few available data on the building wastes, and data on total C&D waste flows exist for 2006 and 2008 (Ghewy and Trégouët, 2010) and for 2004 (Crosnier et al., 2007); this is recapitulated inTable 8.
Missing data from 2000 to 2009 were estimated according to these data with an uncertainty of 20% and considering that building represents about 15% of total C&D waste, as in 2004 and 2008. Moreover, according to an investigation from the European Commission (Monier et al., 2011), a recycling rate
2003 2004 2005 2006 2007 2008 2009
48 38
300 210
320• 340 350• 360 300• 250 300"
58 61 63 65 54 45 54
Sources: Vernus and de Cazenave (2011), Ghewy and Trégouët (2010), Crosnier et al. (2007). a Estimated data.
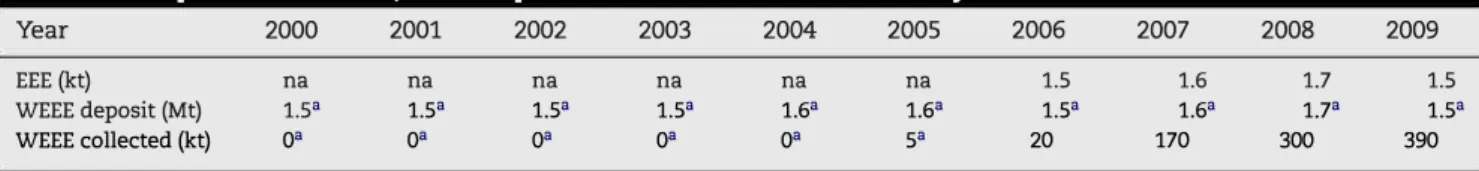
Table 9 - EEE put on the market, WEEE deposit and amount of WEEE selectively collected in France.
Year 2000 2001 2002 2003
EEE (kt) na na na na
WEEE deposit (Mt) 1.s• 1.s• 1.s• 1.s•
WEEE collected (kt)
o
•
o
•
o
•
o
•
na: not available.
Sources: Longueville et al. (2007}, Gie et al. {2010), Labouze et al. {2010). a Estimated data.
Table 10 - Deposit of end-of-life vehicles in France.
Year 2006 2007 2008 2009
ELV (kt) 1800 1600 1700 1900
Sources: ADEME (2012c).
of C&D waste of about 45% is reported in France, but it should increase because of the 70% target set by the Waste Framework Directive.1 However, this recycling rate concerns only 18% of the waste flow as 82% of C&D waste are excavated material which are not included in the defmition of C&D waste for th� purpose of the 70% target. Furthermore, according to Bertram et al. (2002), the copper concentration in C&D waste (excluding excavation material) in Europe in 1994 was comprised between 0.05 and 1 % and estimated to be about (0.07 ± 0.05) %.
Waste
from
electricand
e!ectronicequipment.
As for C&D waste, not many precise data exist on WEEE deposit. According to the French Ministry of Ecology, Sustainable Development and Energy (2012), WEEE deposit lies between 16 and 20 kgl(cap,y), that is about 1130 kt in 2005, and the waste stream of WEEE is increasing from 2 to 3% every year. However, according to a report made for the SYTCOM (inter-municipal syndicate for the processing of municipal solid waste) of Paris (France) (Longueville et al., 2007), the flow of WEEE can be estimated at 1500 kt in 2000, and according to the Gie et al. (2010), the WEEE deposit can be estimated as being equal to the quantity of EEE sent to the market (see data in Table 9), and represents approx imately 5% of the MSW stream. As the quantity of EEE put on the market is only known since 2006, WEEE stream was esti mated from the MSW stream from 2001 to 2005. The amount of WEEE that is collected selectively is reported by the ADEME (Labouze et al., 2010), and even if it has been increasing dras tically since the WEEE directive of 2005, it only represented about 25% of the deposit in 2009 (Labouze et al., 2010). The uncertainty was estimated to be 20% from 2000 to 2005 and 10% from 2006 to 2009.Moreover, according to the European Copper Institute (ECI, 2012), the copper concentration in WEEE varies from 5 to 20%. The selected concentration is 13± 7 %, as estimated by Bertram et al. (2002).
End-of-Iife
uehicles. The ADEME (2012c) created the obser vatory of the end-of-life vehicles sector in 2005. A report is published every year on the state of the sector: deposit, treat ment, recycling, etc. Data are presented in Table 10.Besides, since 2000, the deposit is estimated to be in aver age about 1300 kt/y by the industrials of the sector, and about 1800 kt/y by the AD EME. An intermediate value of 1600 kt/y 1 or Directive 2008/98/EC of the European Parliament and of the Council of 19 November 2008 on waste and repealing certain
directives.
2004 2005 2006 2007 2008 2009
na na 1.5 1.6 1.7 1.5
1.6• 1.6• 1.s• 1.6• 1.7• 1.s•
o
•
s• 20 170 300 390is considered in this study for the years 2000-2005 with an uncertainty of 20%, against 10% from 2006 to 2009.
Furthermore, the content of copper in vehicles can be esti mated to be about 2.5± 1 % ECI (2012). However, this content is going to rise in the near future with the development of electric cars.
Industrial and hazardous
waste. It is difficult to estimate the quantity of industrial and hazardous waste. According to the ADEME (2012b), the ordinary industrial waste quan tity is about 95 Mt, composed essentially of wood (40%), paper and paperboard (16%) and metals (14%). Secondly, hazardous waste stream represents only about 7 Mt. The copper concen tration in this category of waste is very low, about (0.02± 0.02) % according to Bertram et al. (2002). For this work, agricultural wastes are not taken into account because the copper content is supposed to be null. In the absence of any other informa tion, this flow was considered constant from 2000 to 2009: 102 ± 30.6 Mt. An uncertainty of 30% was adopted because of the importance of the hypothesis.Sewage sludge. Sewage sludge (SS) production in France is given by the ministry for sustainable development from 2003 to 2007 (Bureau de la Lutte contre les Pollutions Domestiques et Industrielles, 2009) (see Table 11). The other data are esti mated according to the evolution from 2003 to 2007. An uncertainty of 20% is considered for all the years.
Furthermore copper concentration in SS can be estimated at about (0.037± 0.015) % (Bertram et al., 2002).
Results
on waste management.
As detailed previously, cop per concentration in waste has been evaluated for each of the six categories of waste. Table 12 presents a summary of the values relative to 2007: the average copper concentrations were used to estimate the uncertainty of the adopted copper concentration.Using these concentrations and the flows of waste given previously, the flow of copper scrap in the different years has been calculated. Results are presented in Fig. 3 (no reconcilia tion has been performed so far).
The total quantity of copper scrap produced has been cal culated and compared with the estimated collected scrap (see
Fig. 4). Fig. 4 shows that the results are consistent, even if in 2002 and 2003 the amount of collected scrap seems very low. In 2006 and 2007, more scrap is collected than produced, prob ably due to the fact that scraps produced during the previous years have been then collected.
3.2. Data reconciliation
When performing data reconciliation, two cases have to be taken into account, i.e., either the system is redundant, which means that there are less unknown values than equations, or the system is not redundant. If the system is redundant, the objective of the reconciliation is to satisfy mass conservation. In this study, since data corne from different sources, the
Table 11- Production of sewage sludge in France.
Year 2000 2001 2002 2003 2004 2005 2006 2007 2008 2009
SS (ktoM) 860· 900• 910• 950 990 1000 1000 1100 1200• 1300•
Sources: Bureau de la Lutte contre les Pollutions Domestiques et Industrielles {2009). a Estimated data.
Table 12 - Copper concentration in wastes.
Category Medium copper concentrations (%) Retained copper concentration in 2007 (%) Source
MSW [0; 0.06] C&D [0.05; 1] WEEE [5; 20] ELV [2; 3.5] !&HW [0.01; 0.08] SS [0.02; 0.04]
mass conservation equation rarely holds and reconciliation is necessary to respect mass conservation. If the system is not redundant, it is either observable or not. The system is observable when unmeasured (or missing) values can be estimated from known values and process constraints (e.g. mass conservation). For an observable system, reconciliation aims at calculating unknown average values and standard
250�-�-�--�-�-�-��-�-�-� � 200
r---
--
-
-� :.,. .!: 150 0 ;:: Q) uî � 100 Q) o.. o.. 0 ü 50 -----------------��
·-
·
-
·
--
-
---WEEE ---ELY - -·C&D · ··· ··l&HW --MSW • SS---O
·
t=
====�===
=
�
2000 2001 2002 2003 2004 2005 2006 2007 2008 2009 YearFig. 3 - Evolution of copper scrap flows in different kind of wastes from 2000 to 2009. 320 310 300
---
... ...,.,..-0 290 .!: 280 270 uî 260 'ëi 250 0 240 230 2?fooo
2001 2002 ..,,,..,,.--�--'\. / 2003 2004 2005 Year --Collected wastes ---Produced wastes 2006 2007 2008 Fig. 4 - Comparison between the quantities of copper waste collected and produced.2009 0.0065 Fangeat (2009) 0.07 Bertram et al. {2002) 8 ECI {2012) 2.5 ECI {2012) 0.02 Bertram et al. {2002) 0.037 Bertram et al. {2002)
deviation. For a non-observable system, data reconciliation cannot be carried out.
3.3. Calculation
The computation and reconciliation steps are implemented by using the STAN (acronym for substance flow analysis) soft ware (Cencic and Rechberger, 2008). STAN is a free software that helps performing material or substance flow analysis according to the Austrian standard ÔNorm S 2096 (material flow analysis - application in waste management) (Cencic and Rech berger, 2008). lt performs data reconciliation as described in Section 3.3.2 with integrated calculation modules, and helps at detecting gross errors. This package allows to draw a map of the copper cycle and to give flow data and uncertainties for successive periods (in this case, the period is 1 year). Then, redundant and missing flows are calculated with its integrated data reconciliation method, where uncertainty is considered as normally distributed, and STAN performs data reconcil iation using a method of error propagation, based on the classical least square method.
3.3.1. Least square general method
Generally, least square method is used to fit experimental data to a mathematical model that describes these data. In the most general case, the theoretical model is a family of func tions and the application of the least square method aims at selecting the fonction that best reproduced experimental data. A reconciled value (y'± a') respecting the selected math ematical model is thus determined from the measured values (yi ± ai) (i being the index of a measure, N the total number) by minimizing Xî in Eq. (2): the difference between the measured values and the reconciled value, weighted by the standard deviation (to take into account uncertainty differences):
(2)
Then, the reconciled standard deviation, a', is determined with Eq. (3):
General Plan
Litosphere
0 Production
11 -8.1±30%
Fabrication & Manufacturing
Blister and anod� lngots
System Bound�ry: ---prea�rltfate�-��-v:'-���---� -�-Refined Copper
France ® ® ® Slag 10±5' OldScrap •�-��•w
cp
�
•-1-�per Scrap �--44±5%··· Alloy�crap Waste Management 2,400±41% +51±31% ® �---<,_0r---r---� TailingsImport 1,200±8% Ggla dStock: 300±27% Ggla Export: 860±10% Ggla
Fig. 5 - French MFA - year 2003 (because of approximation to two digits throughout, mass balance seems violated at some boxes, though the closure is achieved in our detailed calculation). t,-1,
w
10 00 () n:""
,::�
t--<"' z
()z
"' "'
�
z ()"'"'
en"'
)>�
n:�
tJ tJ"'
en i;'î z""
"'
0 w r--' w""
i
"'"
0 '-'3.3.2.
Least square adapted
to MFA problemIn SFA study, there is only one "measured" values for each flow i: the collected data called Yi, and the mathematical model that has to be respected is the mass balance equation (see
Section 2.2): L:i (À Yi) = 0 with À= 1 if the flow is an input
and À= -1 if the flow is an output (in these equations, stocks
are considered as output flows) (Narasimhan and Jordache, 2000). Thus, to determine the reconciled value il of each flow i, STAN uses the formula presented in Eq. (4): all y1 are obtained
simultaneously.
2 .
(�(Yi -Yî)
2)
x2 = mm L...,
---i�1 O'i
(4)
The reconciliation of the standard deviation is more complex and error propagation concerns have to be taken into account. Indeed, according to STAN software modelling, the standard deviation of one flow depends on the standard deviations of all the other flows and is computed according to the weighted sum presented in Eq. (5), with Y the flow whose standard devi ation is reconciled, and Xi the other flows. This issue is about error propagation theory (Narasimhan andJordache, 2000) and will not be further discussed in this study.
(5) It must be noted that the classical assumption of a normal distribution of uncertainty is necessary because there is no other general method to perform reconciliation without the distribution normality assumption. However, in many real world problems data uncertainty distribution is more prob ably trapezoidal and a specific reconciliation model should be implemented: this is an important issue that will be discussed in future study.
4. Results and discussion
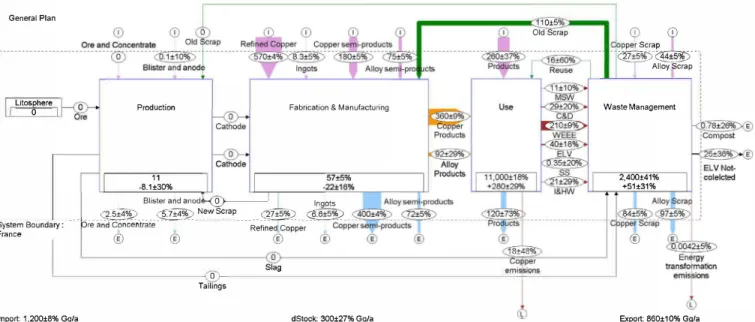
Using the flows expressed in the previous parts, French dynamic SFA has been carried out from 2000 to 2009 with STAN software, using the calculation module Kelly 2011. Fig. 5 shows a typical snapshot result (year 2003): each box represents a stage of the copper chain (production, fabrication and man ufacturing, use and waste management), flows with a circled "I" represent importation, flows with a circled "E", exporta tion, flows with a circled "L", losses to the environment and the "Old Scrap" flow represents recycling. The numbers above the arrows indicate the flow values in gigagram (Gg) and the
700�--�---�--�---�---� "' C: 600 500 .S 400 .9 .!: 3:: 300 0 200 100 / i---:1- -t--cl/ --Products production · · · · · Add to stock ---Wastes production -·•· ·Wastes exportation -· -·Wastes importation - H--Wastes recycling • Emissions I---�
,..
-
-
-
�
�:
:�:
-
-
=!�
-
r
_:-�
f:
,-
_
-:-
!
:.'.':..
"i;:
:_
-
I
2000 2002 I 2004 Year 2006 2008 2010 Fig. 7 - Evolution of copper flows in kilotons with the standard deviation.uncertainty is expressed as a percentage. Let us note that each box contains a subsystem with more detailed data (distinction between copper and alloy, treatment depending on the type of waste, etc.). The variation of stocks in the "Waste Manage ment" box represents the quantity of copper and alloy scrap that is landfilled.
It can first be observed that there is nearly no streams in the production stage for French copper cycle: there is no copper primal transformation industry in France and product fabrication and manufacturing are achieved through imported refined copper or semi-finished products.
A second comment is that most of French scrap is exported while secondary copper is not widely used in France: from 2000 to 2009 the utilization rate of secondary copper in raw mate rial is 25% in average (Gie et al., 2010) which is a low value compared to the average in Europe countries, which is around 40% (Gie et al., 2010). Moreover, even ifit cannot be observed in
Fig. 5, the study showed that nearly all recycled copper cornes from importation of copper scrap with high copper content, while most of the collected copper (with a low copper content) is exported (Gie et al., 2010). This may be explained by the lack of first transformation industry: there is neither equipment infrastructure to refine copper, nor an industry to transform copper scrap into new refined copper.
These results are consistent with those obtained by Graedel et al. (2004) for year 1994. Indeed, except at the production stage where copper cathodes were still produced in 1994, similar trends were observed, with a high net importation Blister Refined Copper
540 (440)
N ew
1
Semi.i!nished Ocrap Products Old Scrap
t
Ore --0 (0) 5.6 (-4) Production Stock -8.1 (-12) ,,. .,. Reflned Copper 220 (l3) (160)
0 Fabrication & Manufacturing
(54) O (�) (85) (18) �---New Scrao-�-� 110 (21) Prad. Cu 360 (250) Us e Prad. Alloy 91 (64) ck Sto +28 (+15 Old Scrap 110 (39) 0 0) Wast es >- 311 .. (160) 110 (58) 1 W aste Management Landfilled W aste +62 (+83)
0.7 0.6 0.5 0.4 0.3 0.2 0.1
am
France2000am
France2001 llilIIIIIIIIIII France2002 IIIIIT] France2003 � France2004 l!!i!il!iil!!l France2005 � France2006 l:J2IJ France2007 llilIIIIIIIIIII France2008am
France2009 SS l&HW 1.4,---.----,---,----r;::::=======:;i
1.2 0.8 0.6 0.4 0.2MSW C&D WEEE ELV
aD France 2005 i9m Brazil 2005 llllIIIIlillIII Europe 1994 � Asia 2003 � Latin America 1994 �Africa1994 SS l&HW
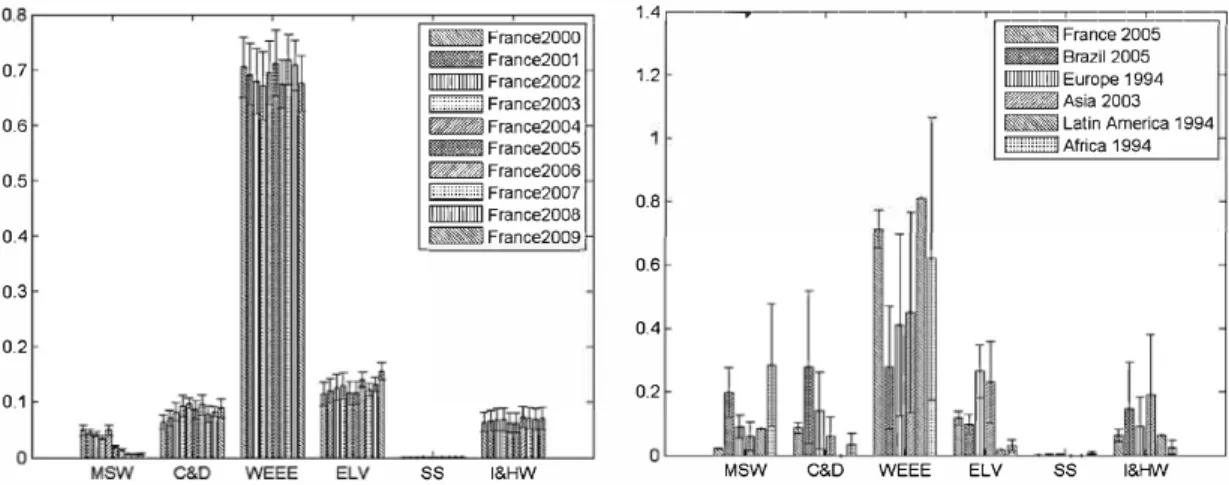
Fig. 8 - Distribution of copper in estlmated waste flows, with uncertainty when available. Left: in France, Right: France compared to other regions (Tanimoto et al., 2010; Bertram et al., 2002; Kapur et al., 2003; Vexler et al., 2004; van Beers et al., 2003; own data).
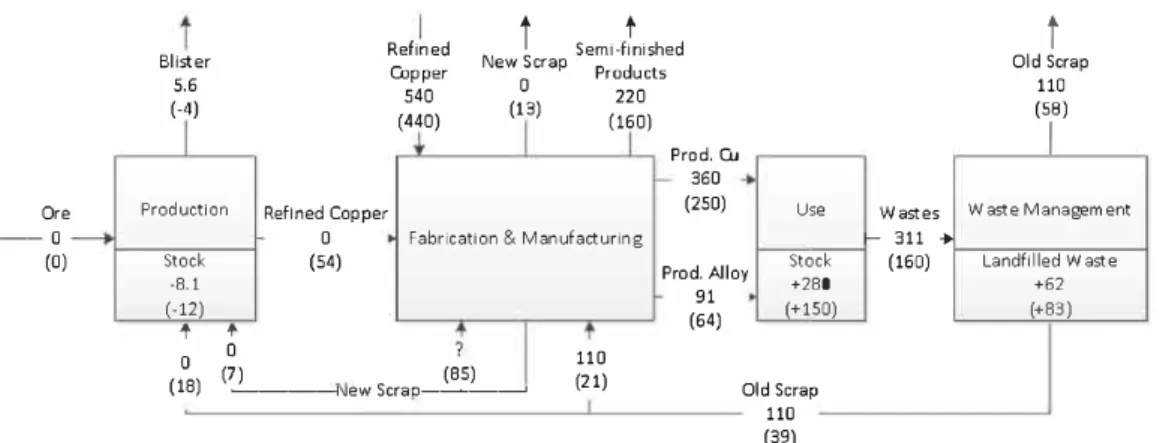
of refined copper and a net exportation of semi-fi.nished product. Conceming waste management, waste production, recycling and net exportation of scrap increased, while land filled decreased a little. Fig. 6 summarizes all this information, with the results obtained in 2003 in this study as compared with those of Graedel (between brackets).
Fig. 7 shows the evolution of total copper and alloy pro duction, additions to stocks, scrap importations, exportations, production and recycling and copper emissions into the envi ronment in France from 2000 to 2009 expressed in kilotons. It can be observed that production and recycling have decreased while scrap exportation has increased and scrap production is qui te stable. It can also be highlighted that copper importation and recycling flows are closely related, which is explained by the fact that most of recycled copper cornes from imported scrap. The quantity of copper added to stock is quite stable in this time period. This behaviour is due to the facts that copper lifetime in the technosphere is qui te long and that con sumption in France has reached a steady state: copper has been accumulated in technosphere as stocks in the use com partment for the past 50 years. Thus, copper used during this period is now reaching the waste phase of its life cycle, which explains why the scrap flow is stable while the importation, exportation and production flows are decreasing. Finally, cop per emissions are negligible as compared with the other flows: they cannot be considered as a source of material recovery. It is yet important to quantify their environmental burdens, by using for instance life cycle assessment (LCA) as suggested in the perspective section.
In Fig. 7, the standard deviation of each plotted value is reported. This information allows identifying the most sensi tive items. The most sensitive one is the addition to stock, followed by product production, then by waste production, and after by waste exportation. Waste importation, waste recycling and emissions exhibit no significant sensitivity.
Loo king more closely at the scrap flow, it is possible to com pare the results with other studies. Fig. 8 shows the allocation of the copper in the different kinds of waste in France from year 2000 to 2009 and in different areas (Tanimoto et al., 2010; Bertram et al., 2002; Kapur et al., 2003; Vexler et al., 2004; van Beers et al., 2003) in comparison with the situation of France in 2005. Data reconciliation makes the interpretation of the results obtained from this study easier due to a decrease in uncertainty. Thereby it can be observed that the proportions are quite stable in France, except in the MSW stream where it
decreases significantly. Indeed the quantity of copper left in MSW is very low as compared with the other areas, especially in recent years, while it is located among the higher values for the WEEE stream. This can be explained by the efficient waste selective collection in France. Conceming the other types of waste, France had an average position.
S. Conclusion and perspectives
This study illustrates how material flow analysis (MFA), cou pled with data reconciliation, can give relevant information on a specifi.c resource situation at the scale of a country. Indeed, statistic data from institutional organisms and industries are often different from one source to the other, and the utilization of the redundancy of information to obtain more precise data is required. The knowledge of resource stocks and flows tumed out to be very useful to improve resource management. In the case of copper in France, it appeared that emissions to the environment are a very small source of copper losses, while an important part of copper scrap is exported or discarded. An important work has been conducted on waste stream charac terization that showed that most copper scrap cornes from WEEE while the other copper scrap sources cannot be dis carded without significant losses. The conclusion to be drawn from these results is that the improvement of copper manage ment in France can be performed mainly by improving waste management.
However, while improving waste management would decrease copper ore consumption and copper losses, a man agement option must also be appreciated by considering its associated costs: an economic analysis must be carried out with the assessment of the environmental impacts -for instance with a life cycle assessment (LCA) - linked to the copper cycle. Indeed, LCA aims at quantifying the total environmental impacts due to a process or product "from cradle-to-grave", that means from the extraction of primary resources used to the elimination of produced wastes, consid ering all the life stages (transformation, utilization, etc.). LCA is carried out in four distinct phases as defined by the norm ISO 14044: definition of the goal and scope of the study; inven tory analysis; impact assessment and results interpretation. This method is particularly adapted for a combination with SFA because SFA data can be directly used in the second phase of the LCA, which is the inventory analysis. A perspective of
this work is thus to perform an economic analysis together with a LCA to compare the actual waste management situation in terms of primary resource consumption, environmental impacts and costs with other waste management options.
Moreover, the MFA procedure can then be used to predict if there will be enough resource or not in the upcoming future. Indeed, based on the evolution from 2000 to 2009 and on macro-economic scenarios proposed by economists, as those for instance used by the Intergovernmental Panel on Climate Change (Bernstein et al., 2007), it is possible to imagine a set of possible scenarios for resource needs and waste production. These macro-economic considerations may be supplemented by more specific information on given industrial sectors; for instance the quantity of copper in end-of-life vehicles may be expected to increase exponentially, as there is twice as much copper in electric cars than in classical cars.
Afterwards, waste management options may be assessed as described previously for each future scenario and a multi objective optimization model could be proposed, which would aim at finding the best option(s) for each scenario considering that the resource consumption and losses, the environmental impact and the costs have to be minimized.
Finally, in this paper the mass balance is performed at a national se ale, but the approach could be extended to an en tire continent.
Acknowledgments
We would like to thank Oliver Cencic from Vienna University of Technology for his help regarding STAN software, as well as the three anonymous reviewers for their insightful comments and remarks.
References
ADEME, 2012a. Agence De l'Environnement et de la Maîtrise de l'Energie. Retrieved from http://www2.ademe.fr/ on 20.09.12. ADEME, 2012b. Agence De l'Environnement et de la Maîtrise de
l'Energie Midi-Pyrénées. Retrieved from
http:/ /www.ademe.fr/midi-pyrenees/a_Ll2.html on 20.09.12. ADEME, 2012c. Observatoire des Véhicules Hors d'usage (VHU).
Retrieved from http://www2.ademe.fr/ on 01.10.12. Ayres, R.U., Ayres, L., 2002. A Handbook of Industrial Ecology.
Edward Elgar, Cheltenham, UK - Northampton MA, USA.
Ayres, R.U., Ayres, L.W., Rade, 1., January 2002. The life cycle of copper, its co-products and by-products. Eco-Efficiency in Industry and Science 13, 1-210.
Bernstein, L., Bosch, P., Canziani, O., Chen, Z., Christ, R., Davidson, O., Hare, W., Huq, S., Karoly, D., Kattsov, V.,
Kundzewicz, Z., Liu,
J.,
Lohmann, U., Manning, M., Matsuno, T., Menne, B., Metz, B., Mirza, M., Nicholls, N., Nurse, L., Pachauri, R., Palutikof,J.,
Parry, M., Qin, D., Ravindranath, N., Reisinger, A., Ren, J., Riahi, K., Rosenzweig, C., Rusticucci, M., Schneider, S., Sokona, Y., Salomon, S., Stott, P., Stouffer, R., Sugiyama, T., Swart, R., Tirpak, D., Vogel, C., Yohe, G., 2007. Climate Change 2007: Synthesis Report. Tech. rep., Intergovernmental Panel on Climate Change (!PCC), Geneva, Switzerland.http://www.ipcc.ch/pdf/assessment-report/ar4/syr/ar4_syr.pdf
Bertram, M., Graedel, T.E., Rechberger, H., Spatari, S., 2002. The contemporary European copper cycle: waste management subsystem. Ecological Economies 42 (1-2), 43-57 http://www. sciencedirect.com/science/article/pii/S0921800902001003
Brunner, P. H., Rechberger, H., October 2004. Practical Handbook of Material Flow Analysis. Lewis, ISBN-10: 1566706041; ISBN-13: 978-1566706049.
http://www.iwr.tuwien.ac.at/mfa-handbook/home.html
Bureau de la Lutte contre les Pollutions Domestiques et Industrielles, May 2009. Eléments de contexte et
réglementation française relatifs à la valorisation des boues issues du traitement des eaux usées. Tech. rep., Ministére de !'Ecologie, de !'Energie, du Développement durable et de l'Aménagement du territoire.
Cencic, O., Rechberger, H., 2008. Material flow analysis with software STAN. Journal of Environmental Engineering and Management 18 (1), 3-7 http://www.sswm.info/sites/default/ files/reference_attachments/CENCIC%20and%20RECHBERGER% 202008%20Material%20Flow%20Analysis%20with%20Software% 20STAN.pdf
CITEPA, 2012. Centre Interprofessionnel Technique d'Etude de la Pollution Atmosphérique. Retrieved from
http://www.citepa.org on 20.09.12.
Crosnier, M., Leray, F., Margontier, S., Bird, G., Nirascou, F., Trégouët, B., Février 2007. Le recyclage des déchets du bâtiment et des travaux publics peut progresser. Tech. Rep. 116, Institut Français de l'Environnement (!FEN). http://www. side.developpement-durable.gouv.fr/simclient/consultation/ binaries/stream.asp?INSTANCE=EXPLOITATION&EIDMPA=IFD_ FIC]OINT _0000552
Daigo, 1., Hashimoto, S., Matsuno, Y., Adachi, Y., 2009. Material stocks and flows accounting for copper and copper-based alloys in Japan. Resources, Conservation and Recycling 53 (4), 208-217 http://www.sciencedirect.com/science/article/pii/ S092134490800205X
E-PRTR, 2012. The European Pollutant Release and Transfer Register. Retrieved from http://www.prtr.ec.europa.eu/ on 20.09.12.
ECI, 2012. European Copper Institute - Copper production and properties. Retrieved from http://www.eurocopper.org on 20.09.12.
Eurostat, 2012. Data Explorer. Retrieved from http://www.appsso. eurostat.ec.europa.eu/nui/show.do?dataset=nama_gdp_k& lang=fr on 20.09.12.
Fangeat, E., Juin 2009. Campagne nationale de caractérisation des ordures ménagères - Résultats Année 2007. Tech. rep., ADEME. Forwast, 2012. Overall mapping of physical flows and stocks of
resources to forecast waste quantities in Europe and identify life-cycle environmental stakes of waste prevention and recycling. Retrieved from http://www.forwast.brgm.fr/ on 20.09.12.
French Ministry of Ecology, Sustainable Development and Energy, 2012. Déchets d'Equipements Electriques et Electroniques. Retrieved from http://www.developpement-durable.
gouv.fr/Dechets-d-equipements-electriques, 12039 on 03.10.12. French Ministry of Ecology, Sustainable Development and Energy,
2012. L'essentiel sur les déchets ménagers et assimilés. Retrieved from http://www.statistiques.developpement durable.gouv.fr/lessentieVs/dechets-menagers-assimiles.html
on 20.09.12.
Ghewy, X., Trégouët, B., December 2010. Chiffres et statistiques -345 millions de tonnes de déchets produits en France en 2008. Tech. Rep. 179, Ministère de l'Ecologie, du Développement durable, des Transports et du Logement - Commissariat Général au Développement Durable.
http://www.developpement-durable.gouv.fr/IMG/pdf/CS179.pdf
Gie, G., Haeusler, L., Mougani, A.K., Septembre 2010. Bilan du recyclage 1999--2008 - Matériaux et recyclage - Données détaillées par filière. Rapport a, Société In Numeri pour l'ADEME.
Gie, G., Haeusler, L., Mougani, A.K., Septembre 2010. Bilan du recyclage 1999--2008 - Produits usagés et recyclage - Données détaillées par filière. Rapport b, Société In Numeri pour l'ADEME.
Gie, G., Haeusler, L., Mougani, A.K., Septembre 2010. Bilan du recyclage 1999--2008 - Synthèse générale. Rapport, Société In Numeri pour l'ADEME.
Graedel, T.E., Bertram, M., Fuse, K., Gordon, R.B., Lifset, R., Rechberger, H., Spatari, S., 2002. The contemporary European copper cycle: the characterization of technological copper cycles. Ecological Economies 42 (1-2), 9-26
http://www.sciencedirect.com/science/article/pii/ S0921800902001015
Graedel, T.E., van Beers, D., Bertram, M., Fuse, K., Gordon, R.B., Gritsinin, A., Kapur, A., Klee, R.J., Lifset, R.J., Memon, L., Rechberger, H., Spatari, S., Vexler, D., 2004. Multilevel cycle of anthropogenic copper. Environmental Science and
Technology 38 (4), 1242-1252, PMID: 14998044;
http://www.pubs.acs.org/ doi/abs/10.1021/es030433c
Guo, X., Song, Y., 2008. Substance flow analysis of copper in China. Resources, Conservation and Recycling 52 (6), 874-882
http://www.sciencedirect.com/science/article/pii/ S0921344907002029
ICSG, July 2010. ICSG 2010 Statistical Yearbook. Tech. Rep. Vol. 7, International Copper Study Group. http://ec.europa.eu/ competition/consultations/2011_questionnaire_emissions_ trading/atlantic_copper _annex2_en. pdf
ICSG, 2012. International Copper Study Group website. Retrieved from http://www.icsg.org/ on 20.09.12.
Jamet, C., Grégoire, P., Boitard, C., Bird, G., Nirascou, F., Trégouët, B., June 2009. Etudes & Documents - Matières mobilisées par l'économie française - Comptes de flux pour une gestion durable des ressources. Tech. Rep. 6, Commissariat Général au Développement Durable - Service de !'Observation et des Statistiques.
Jeswani, H.K., Azapagic, A., Schepelmann, P., Ritthoff, M., 2010. Options for broadening and deepening the LCA approaches. Journal of Cleaner Production 18 (2), 120-127 http:// www.sciencedirect.com/science/article/pii/ S0959652609003229
Kapur, A., Bertram, M., Spatari, S., Fuse, K., Graedel, T.E., 2003. The contemporary copper cycle of Asia. Journal of Material Cycles and Waste Management 5, 143-156
http://dx.doi.org/10.1007 /s10163-003-0096-4
Labouze, E., Hestin, M., Deprouw, A., Pageot, G., Octobre 2010. Rapport annuel sur la mise en œuvre de la réglementation sur les Déchets d'Equipements Electriques et Electroniques (DEEE} - Données 2009. BIO Intelligence Service S.A.S. pour l'ADEME, collection repère Edition.
Landner, L., Lindestrom, L., 1999. Copper in Society and in the Environment. Swedish Environmental, Research Group (MFG}, Vasteras, Sweden.
Longueville, L., Mahe, C., Rousselle, L.-A., Yin, H., Labert, V., Camuzard, J.-P., February 2007. La mise en place de la filière DEEE: Quels enjeux pour le SYCTOM ? Tech. rep., Sytcom and AgroParisTech. http://www.syctom-paris.fr/pdf/
Collectivites/rapportdeee.pdf
Monier, V., Hestin, M., Trarieux, M., Mimid, S., Domrose, L., van Acoleyen, M., Hjerp, P., Mugdal, S., 2011. Study on the management of construction and demolition waste in the EU. Tech. rep., European Commission (DG Environment), contract 07 .0307 /2009/540863/SER/G2. http://www.biois.com/wp/wp content/uploads/2011/01/BIO_Construction-and-Demolition Waste_Final-reporL09022011. pdf
Muchova, L., Eder, P., Villanueva, A., 2011. End-of-waste criteria for copper and copper alloy scrap: technical proposais. Tech.
rep., JRC European Commission and lnstitute for Prospective Technological Studies.
Narasimhan, S., Jordache, C., 2000. Data Reconciliation & Gross Error Detection: An Intelligent Use of Process Data. Gulf Professional Publishing, Houston, Texas.
Ruhrberg, M., 2006. Assessing the recycling efficiency of copper from end-of-life products in Western Europe. Resources, Conservation and Recycling 48 (2), 141-165 http://www. sciencedirect.com/science/article/pii/S0921344906000115
SCF, 2012. Société Chimique de France - Cuivre. Retrieved from
h ttp://91.121.18.171/sfc/ donnees/metaux/cu/texcu.htm on 20.09.12.
SINOE, 2013. SINOE®
déchets. Retrieved from
http://www.sinoe.org/ on 18.03.2013.
Spatari, S., Bertram, M., Fuse, K., Graedel, T.E., Rechberger, H., 2002. The contemporary European copper cycle: 1 year stocks and flows. Ecological Economies 42 (1-2}, 27-42 http://www. sciencedirect.com/science/article/pii/S0921800902001039
Spatari, S., Bertram, M., Gordon, R.B., Henderson, K., Graedel, T., 2005. Twentieth century copper stocks and flows in North America: a dynamic analysis. Ecological Economies 54 (1), 37-51 http://www.sciencedirect.com/science/article/pii/ S0921800904003921
Tanimoto, A.H., Durany, X.G., Villalba, G., Pires, A.C., 2010. Material flow accounting of the copper cycle in Brazil. Resources, Conservation and Recycling 55 (1), 20-28
http://www.sciencedirect.com/science/article/pii/ S0921344910000716
UNEP, 2011. Assessing Minerai Resources in Society - Meta! Stock and Recycling rate. Tech. rep., United Nations Environment Programme. urlhttp://www.unep.org/resourcepanel/Portals/ 24102/PDFs/Metals_Recycling_Rates_Summary. pdfhttp:/ /www. unep.org/resourcepanel/Portals/24102/PDFs/Metals_Recycling_ Rates_Summary. pdf.
van Beers, D., Bertram, M., Fuse, K., Spatari, S., Graedel, T., 2003. The contemporary African copper cycle: one year stocks and flows. Journal of the South African Institute of Mining and Metallurgy 103 (3), 147-162 http://www.saimm.eo.za/ Journal/v103n03p147.pdf
Vernus, E., de Cazenave, A., Juin 2011. Déchets de démolition et de déconstruction: gisements, caractérisations, filières de traitement et de valorisation. Tech. rep., Polden / lnsavalor and Treize Développement. http://www.record-net.org/ record/synthPDF/Synth_record09-0139_1A.pdf
Vexler, D., Bertram, M., Kapur, A., Spatari, S., Graedel, T., 2004. The contemporary Latin American and Caribbean copper cycle: 1 year stocks and flows. Resources, Conservation and Recycling 41 (1), 23-46 http://www.sciencedirect.com/ science/article/pii/S0921344903001198
Zeltner, C., Bader, H.P., Scheidegger, R., Baccini, P., 1999. Sustainable metal management exemplified by copper in the USA. Regional Environmental Change 1, 31-46