1
A rapid solution method to determine the charge capacity of LiFePO
41
Ngoc Duc Trinh
a, Guoxian Liang
b, Michel Gauthier
b, Steen B. Schougaard
a*2
a Université du Québec à Montréal, 2101 Jeanne-Mance, Montréal, Québec, H2X 2J6, Canada 3
b Phostech Lithium Inc, 1475 Marie-Victorin, St-Bruno-de-Montarville, Québec, J3V 6B7, Canada 4 *corresponding author. 5 6 Abstract 7
A new method has been developed to estimate the charge capacity of LiFePO4. This method does not
8
rely on assembly of active material, carbon and polymer binder composite electrodes, and can be used 9
on nanoparticles with or without carbon coating. Charge capacity is derived from LiFePO4 oxidation by
10
a solution redox mediator, 10-methylphenothiazine, in a bulk electrolysis system. The mediator serves 11
the role of connecting the working electrode with the LiFePO4 particles suspended in the electrolyte.
12
XRD and IR spectroscopy identified the oxidized species as heterosite-FePO4, as in standard coin cell
13
tests. Analyses with 6.8 % relative standard deviation were routinely obtained. 14
Keywords: Lithium battery; Cathode; LiFePO4; 10-methylphenothiazine; Bulk electrolysis; Charge capacity
15
1. Introduction
16
Development of cathode materials for Li-ion batteries is currently a very active research area, in part 17
due to the development of electric and hybrid-electric vehicles.[1-4] One of the major challenges of this 18
work is overcoming the power limitation imposed by the relatively slow transport of lithium ions inside 19
the solid-state structures used for charge storage.[5] A recognised methodology to address this research 20
target is particle down-sizing so that the distance travelled by the lithium ion inside the active material 21
during charge and discharge is minimized.[6-8] In this way most of the ionic transport path is in the 22
liquid electrolyte part of the porous electrode. This is advantageous as liquid electrolytes diffusion 23
coefficients are several orders of magnitude larger than those of solid-state insertion materials.[9] 24
2 Down-sizing the active materials however lead to a number of challenges when fabricating active 1
material, carbon, polymer binder composites required for making functional electrodes and thus 2
batteries. Specifically, it is difficult to ensure good electrical contract to active material when the carbon 3
particles and the active material particles have comparable size.[10] A common problem when 4
developing new nano-sized battery materials is therefore identifying whether a given performance loss is 5
due to the composite electrode structure or the active materials it-self. This complexity is further 6
compounded when working with materials that require conducting-coatings, since the coating process 7
can have profound effect on the underlying base materials as was shown by Herle et al.[11] 8
An analytical technique that can estimate the capacity of active materials without the use of 9
composite electrode test batteries and independent of the surface conductivity would therefore be an 10
important tool when developing nano-sized battery materials.[12] To be widely used this technique 11
should: 12
• Not require highly specialized equipment beyond what is normally found in a lithium battery 13
materials laboratory. 14
• Not be labour intensive. 15
In addition, it should be independent of the counter electrode structure, i.e. species that generated at the 16
anode should not affect on the cathode process. This technique would first serve as a screening test, to 17
determine if the performance of the base material is sufficient to warrant further analysis such as 18
cycling, abuse (temperature and rate) testing etc. using standard techniques like coin cells test.[13-15] 19
Second, it should provide a direct measure of the maximum practical charge capacity. A discrepancy 20
between the capacity measured by the new analytical technique and the standard cells would thus be a 21
strong indication that further optimization of the composite electrode structure is required to produce the 22
maximum performance of the active material. In this paper, we describe an analytical technique that 23
fulfils criteria mentioned above. 24
Briefly, the active material particles (Fig. 1.) is dispersed in the redox mediator containing electrolyte 25
solution, so that the mediator can serve as an electron shuttle between the current collector/working 26
3 electrode and the particles. There is therefore no need for carbon or a composite electrode structure to 1
perform electrochemical test of the active material. 2
LiFePO4 is chosen to validate this technique, because this material, while being attractive due to high
3
safety as well as inexpensive and environmentally acceptable constituents, also exhibit unusually slow 4
lithium ion diffusion.[16] There is therefore a large effort to develop techniques that can produce this 5
material in a form that has nano-scale dimensions.[7] In addition, LiFePO4 requires a conductive coating
6
to function in composite electrodes. This is however not the case for the redox mediator technique, and 7
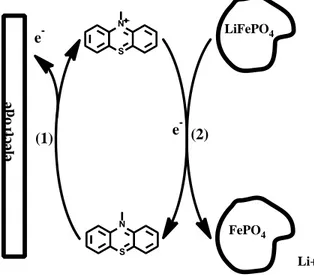
we can therefore examine materials that cannot be analyzed with classical coin-cells.[12, 17-18] 8 S N S N LiFePO4 FePO4 Li+ (1) e (2) -e l ectr od e e -9
Fig. 1. Mechanism of oxidation of LiFePO4 via 10-methylphenothiazine (MPT). Both the LiFePO4 and MPT are present in the
10
liquid electrolyte, where effective stirring ensures MPT and therefore also charge transport between the electrode and the LiFePO4
11
particles.
12
13
The redox mediator was chosen from a family of molecules known as “overcharge redox shuttles” used 14
as an additive for overcharge protection. As such, these molecules have been shown to be stable in the 15
harsh battery environment.[19-20] Specifically, 10-methylphenothiazine (MPT) was chosen since the 16
potential of the first redox couple, 3.62 V vs. Li/Li+ is just above the potential of LiFePO4 (~3.4 V vs.
17
Li/Li+).[21-22] The complete reaction cycle therefore becomes: 18
MPT → MPT+• + e- (1)
19
MPT+• + LiFePO4→ FePO4 + Li+ + MPT (2)
4 Every MPT+• formed at the current collector/working electrode is therefore converted back to MPT by 1
oxidation of LiFePO4. As such, the instant where this regeneration stops represents the equivalence
2
point. The charge needed to reach complete delithiation of LiFePO4 can therefore be determined form
3
the total charge required to return the MPT and MPT+• concentrations to their initial value before
4
LiFePO4 addition. The [MPT]/[MPT+•] ratio is here conveniently measured by the electrochemical
5
potential according to the Nernst equation. 6
7
2. Materials and methods
8
2.1. Chemicals
9
10-methylphenothiazine (MPT) (Alfa Aesar 98%), LiPF6 (Strem Chemicals +99.9%), propylene
10
carbonate (PC) (Sigma-Aldrich anhydrous 99.7%), lithium foil (Aldrich 99.9%) were used as received. 11
R&D and commercial grade samples with varying performance of carbon coated and carbon free 12
LiFePO4 were generously donated by Phostech Lithium Inc. (St-Bruno de Montarville, Canada). All the
13
samples of LiFePO4 were dried at 60°C under vacuum for 2 days, before analysis.
14
2.2. Materials characterization
15
2.2.1 Redox mediator analysis procedure
5 1
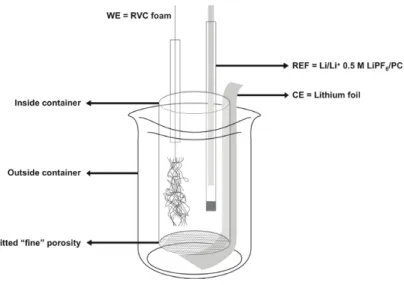
Fig. 2. The electrolysis cell.
2
The electrolysis was performed in a electrochemical cell composed of an inside fritted container 3
(“fine” porosity) of 30 mL and a 50 mL outside container (Fig. 2). The counter electrode was installed in 4
outer compartment while the working and reference electrodes were installed in the inside solution, 5
which was stirred during electrolysis. The working electrode (1.5 cm by 2 cm) consisted of reticulated 6
vitreous carbon (RVC) foam, 3 % density (ERG Materials and Aerospace Corp.) with a porosity of 30 7
PPI connected to a platinum wire. An insulating epoxy was used to stabilize the connection. The 8
reference electrode consisted of lithium foil inside a glass tube filled with 0.5 M LiPF6 in PC. The
9
exchange of electrolyte was limited by a Vycor fritt. A 1.5 cm x 12 cm piece of lithium foil served as the 10
counter electrode and was mechanically cleaned before each electrolysis. All analysis were performed in 11
an argon filled glovebox (H2O, O2<1ppm).
12
Before and after each analysis, the mediator and the reference was verified by cyclic voltammetry 13
(3.0 V to 4.0 V vs. Li/Li+, sweep rate 100 mV.s-1) using Pt working electrode (0.02 cm2) inserted in the 14
inner compartment only during this verification step. 15
In initial step of the electrolysis a potential 0.04 V above the [MPT]/[MPT+•] redox potential 16
measured by cyclic voltammetry was imposed at the working electrode. This potential was kept 17
throughout the electrolysis. During this first oxidation the solution changed from transparent, to dark red
18
indicating formation of MPT+•. Once the current reached the background level, defined as a current 19
6 change of less than 0.2 mA per hour, a known mass of LiFePO4 was added to the inner chamber
1
solution, and the current was monitored until the background level was reached again (the system is at 2
this time ready to receive a new sample). From an integration of the current vs. time peak, the number of 3
coulombs needed to completely oxidized LiFePO4 was obtained. Thus using Faraday’s law the capacity
4
is calculated from: 5
Charge capacity (mAh.g-1) = Q / (3.6 m) (3)
6
where Q is the total integrated charge in units of A.s and m is the LiFePO4 sample mass in units of g.
7
For every studied sample, a minimum of six analyses were performed in the same solution. All cited 8
confidence intervals are at the 95% confidence level. 9
2.2.2 Standard techniques
10
XRD pattern were recorded using a Bruker D8 Advanced diffractometer with a Cobalt source. The IR 11
spectra were obtained by a Nicolet 6700 FT-IR spectrophotometer coupled with a Smart iTR diamond 12
ATR. Test batteries consisted of a lithium metal anode, a cathode (80 m/m-% active material, 10 m/m-% 13
EBN1010 (mixture of graphite/carbon black) and 10 m/m-% PVDF binder, on a carbon coated Al 14
current collector) separated by a perforated polymer membrane, soaked in 1 M LiClO4 and hermetically
15
sealed in a CR2032 coin-cell. The cathode material loading was ~4 mg/cm2. The capacity was 16
determined slow scan rate voltammetry (v=0.25 mV.s-1, 3-3.7 V), by integrating current vs. time, or by 17
chronopotentiometry (C/12, 2.2-4.0 V). 18
Lithium analysis consisted of dissolving oxidized lithium iron powder in 1:1 HCl/HNO3, before
19
filtration to remove residual carbon. The lithium concentrations ware determined from flame emission 20
using a Varian AA-1475, based on a five point calibration curve in the 0-1 μg.mL-1 concentration range
21
obtained from a 1000 μg.mL-1 certified lithium standard (Aldrich). The confidence interval was
22
calculated at 95% level from five emission values. 23
24
3. Results and discussion
7
3.1. Electrochemical behaviour
1
2
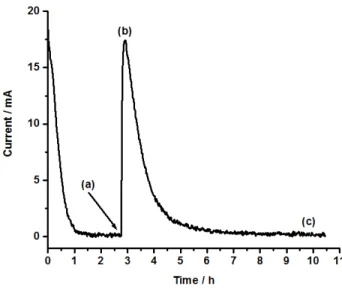
Fig. 3. A typical oxidation peak (see text for details)
3
The electrochemical measurements made in the bulk electrolysis system are base on a three electrodes 4
setup, where the potential measurement is decoupled from the counter electrode reaction.[23] This has 5
the advantage over the two electrode approach used in coin-cells, that structural or concentration 6
changes at the counter electrode does not affect the measurement. The active materials reaction is further 7
protected from any adverse effect of species generated at the counter electrode by restricted diffusion 8
across the fritted glass membrane that separates inner positive electrode from the outer negative 9
electrode compartment. A typical measurement (Fig. 3) therefore begins by imposing a potential at the 10
working electrode, which will be held constant throughout the measurement. A consequence of the 11
difference in potential of the working electrode and the solution, is that an anodic current is passes 12
through the system to form [MPT+•]. As the potential difference diminished, so does the current until 13
the there is potential difference between the solution and the working electrode. At this point the [MPT]/ 14
[MPT+•] ratio is directly related to the working electrode potential through the Nernst equation, and as 15
such the system is in equilibrium, just before the LiFePO4 sample is added at time (a) (Fig. 3).
16
The addition of the sample leads to a large increase in the transferred current as the system tries to 17
compensate via eq. 1 for the MPT+•consumed by delithiation of LiFePO4 (eq. 2). However, as the
18
diffusion and convection is not sufficient to maintain a high concentration of MPT close to the working 19
8 electrode, a maximum current is reached at time (b). An alternative interpretation of the appearance of a 1
peak current is that the LiFePO4 oxidation rate decreases due to an increasing Li+ diffusion path inside
2
the particle as it is delithiated. However, the fact that doubling the mediator concentration leads to a 3
doubling of peak current (within the experimental error), suggest that the transport of MPT towards the 4
working electrode is the limiting factor. At time (c), the system has returned to the same redox-state, i.e. 5
[MPT]/[MPT+•] concentration is the same as immediately before time (a). The time needed to reach this 6
point depends on a complex combination of transport of charge by the mediator between the working 7
electrode and the LiFePO4 particles, as well as the kinetic of LiFePO4 desinsertion reaction. However,
8
the product of the current and the time, i.e. the total charge needed to return to equilibrium is only 9
dependent on the quantity of LiFePO4 that has been oxidized.
10
3.2. System stability and reproducibility.
11
As with any analytical system, the stability of the base line is essential to obtaining reliable results. 12
In our system, this translates into a reliable reference electrode and a steady background current. In fact, 13
these two parameters are coupled since drift of the reference electrode will result an unsteady 14
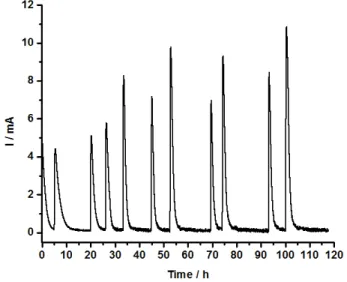
background current. An example of the stability of the system is shown in Figure 4, where the 15
background current does not vary more than 0.2 mA over the entire analysis series (150 h). The method 16
was performed on 10 different samples, carbon coated and carbon free, and at least six analyses were 17
carried out on each sample. 18
9
Fig. 4.Electrolysis of peaks for 7 samples from the same batch.
1 2 Mass of LiFePO4 (mg) Integrated current (A.s) Capacity (mAh.g-1) 101.3 54.9 150.9 113.5 60.9 149.3 94.1 47.9 141.7 113.5 57.7 141.6 120.4 64.3 149.1 120.0 62.1 144.0 209.0 108.2 144.2
Average at confidence limit of 95 % 145.8 ± 6.4
3
Table 1. Capacity obtained for different masses of LiFePO4 for the redox mediator method from the same LiFePO4 batch as Fig. 4.
4 5
Table 1 shows the results for seven replicates of the same sample as in Figure 4. The charge capacity 6
is obtained by using the equation (3) as shown above. These results combined with the 9 other samples 7
for a total of 90 analysis show good reproducibility, as identified by the average relative standard 8
deviation of 6.8 % for the redox mediator method. 9
10
Fig.5. Electrolysis of reduced MPT by different mass of carbon free LiFePO4 particles.
10 Figure 5 shows the successful analysis of carbon free LiFePO4 with an average diameter of
1
approximately 400 nm. The measured capacity of 142.6 ± 4.6 clearly show the possibilities of the redox 2
mediator technique as this sample show no charge/discharge capacity in standard test batteries. 3
To confirm complete oxidation of LiFePO4, a commercial C-LiFePO4 (Life Power® P2 grade) was
4
used, since the composite electrode formulation that yields optimal utilisation is known. Battery tests 5
indicated a capacity of 160 mAh.g-1 at the C/5 rate. Using the redox mediator method, a charge capacity
6
of 166.6±3.6 mAh.g-1, was obtained using 7 samples. Considering a carbon content of 2 to 3 wt.%, the
7
charge capacity is consistent with the theoretical value (170 mAh.g-1) for complete Li+ desinsertion of
8
LiFePO4.
9
Quantitative transfer of charge from the working electrode to LiFePO4 was further confirmed by
10
partial oxidation, followed by isolation and lithium analysis of the formed Li1-xFePO4. A predetermined
11
number of coulombs were injected into the MPT solution, to oxidize an excess mass of LiFePO4. Two
12
different samples with partial oxidation for a transfer of 0.36 and 0.49 electrons per LiFePO4 formula
13
unit were analysed. The remaining lithium calculated by the redox mediator method divided by the 14
lithium concentration obtained by elemental analyses where 1.02 ± 0.01 and 0.998 ± 0.009, confirming 15
quantitative transfer. 16
3.3. Methods comparison and validation.
17
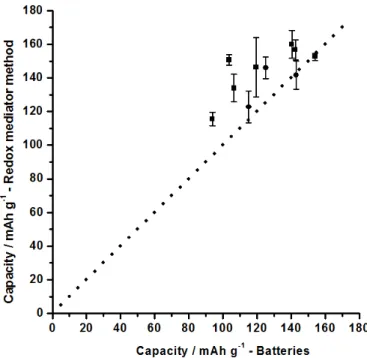
Figure 6 shows the correlation chart between measurements obtained by the redox mediator method 18
and those obtained by cycling of coin cells.[24] It shows the charge capacity measured by coin cell tests 19
vs. the redox mediator method for ten different samples. In this type of correlation graphics, samples that
20
yield the same value for both tests fall on the 45° line that passed through the origin. For the coin cells 21
tests, three values were obtained by cyclic voltammetry, and the seven others by chronopotentiometry. 22
11 1
Fig. 6. Correlation chart. Capacity obtained by the redox mediator method vs. coin cells tests. The dotted line represents perfect
2
correlation. (Two different analytical technique were used to generate the batteries values: Chronopotentiometry (Squares) and
3
Cyclic voltammetry (Circles))
4 5
From figure 6 it is clear that redox mediator method yield higher or equivalent capacities compared to 6
the standard battery method. This is to be expected since the redox mediator method will address the 7
entire sample as the MPT+•/MPT redox couples and the electrolyte is in contact with the entire surface 8
of all the LiFePO4 particles. In contrast, battery electrodes rely on point contacts between particles to
9
ensure electronic conduction, while the ionic conduction is limited to the electrolyte filled voids between 10
particles.[13] Consequently, cases were the sample exhibit the same capacity by both methods, are 11
strong indication that the battery test has reached full utilization of the active material. 12
3.4. Characterization of the oxidation product.
13
Both LiFePO4 and Li0FePO4 were characterized by X-ray diffraction and IR spectroscopy. Unlike
14
most lithium insertion materials, the oxidation of LiFePO4 leads to a phase separation into
olivine-15
LiFePO4 and heterosite-FePO4, which greatly simplifies the analysis.[25] The XRD patterns of LiFePO4
16
before and after the chemical oxidation (Fig. 8.) show the full transition from the olivine to heterosite 17
12 phase, as the (200) and (210) peaks located at 20° and 26° in the olivine phase have been replaced by the 1
corresponding heterosite peaks at 21° and 27° in the oxidized sample.[26] The fact that that all peaks in 2
the oxidized sample can be assigned to the heterosite phase is a further confirmation that oxidation is 3
complete. 4
5
Fig.7. XRD patterns of (a) LiFePO4 and (b) after chemical oxidation.
6 7
IR analysis was further undertaken to examine if the analysis resulted in damage to system which due 8
to it localilized nature would not be visible by XRD. The spectra of the delithiated phase (Fig. 9b) is 9
assigned as follows: peaks at 1074, 954 and 914 cm-1, are attributed to the stretching modes of the PO 4
3-10
units in the heterosite phase for carbon coated samples. For the carbon free sample, similar peaks 11
appeared at 1161, 1077, 979 and 957 cm-1.[27-28] In the 700-600 cm-1 range, both materials show 12
similar transformation, where the band at 636 cm-1 and a weaker band at 650 cm-1 for olivine phase 13
become stronger and well-defined peaks for heterosite phase.[29] Moreover, the band at 1237 cm-1 is 14
indicative of delithiated phase, and is consistently not present in the LiFePO4 spectrum.[27-28]
15
Combined, the IR spectra show no evidence of damage to the crystal structure. 16
13 1
Fig.8. IR Spectra of carbon coated and carbon free (a) LiFePO4 and (b) after chemical oxidation.
2 3 4 4. Conclusion 5
In this work we have investigated a rapid solution method to obtain the charge capacity of LiFePO4. The
6
oxidation of LiFePO4 was performed by a redox mediator, 10-methylphenothiazine, which ensures the
7
electrochemical contact between the working electrode and the active particle. Importantly the oxidation 8
product was found by XRD and IR spectroscopy to be hetrosite-FePO4,same as in the standard test
9
batteries. Our new technique is interesting as it is a) less labor intensive than standard test batteries, b) 10
without influence form the composite electrode fabrication and c) yields a best case charge capacity that 11
can be used as the target when developing composite electrode formulations. Moreover, its utility when 12
analysing nanoparticles both with and without conductive coating, could make it an important tool for 13
the research community devoted to developing new nanosized LiFePO4 materials.[13]
14 15
Acknowlegdement
16
The authors thankfully acknowledges NSERC for financial support via the CRD program (grant no. 17
385812) 18
19 20
14
References
1
[1] J.-M. Tarascon, M. Armand, Nature 414 (2001) 359-367. 2
[2] C. Daniel, JOM 60 (2008) 43-48. 3
[3] E. Karden, S. Ploumen, B. Fricke, T. Miller, K. Snyder, J. Power Sources 168 (2007) 2-11. 4
[4] J. Arai, T. Yamaki, S. Yamauchi, T. Yuasa, T. Maeshima, T. Sakai, M. Koseki, T. Horiba, J. Power 5
Sources 146 (2005) 788-792. 6
[5] M.S. Whittingham, Chem. Rev. 104 (2004) 4271-4302. 7
[6] X. Zhi, G. Liang, L. Wang, X. Ou, J. Zhang, J. Cui, J. Power Sources 189 (2009) 779-782. 8
[7] G.T.-K. Fey, Y.G. Chen, H.-M. Kao, J. Power Sources 189 (2009) 169-178. 9
[8] A. Yamada, S.C. Chung, K. Hinokuma, J. Electrochem. Soc. 148 (2001) A224-A229. 10
[9] X.-C. Tang, L.-X. Li, Q.-L. Lai, X.-W. Song, L.-H. Jiang, Electrochim. Acta 54 (2009) 2329-2334. 11
[10] P. Bruce, B. Scrosati, J.-M. Tarascon, Angew. Chem. Int. Ed. 47 (2008) 2930-2946. 12
[11] P.S. Herle, B. Ellis, N. Coombs, L.F. Nazar, Nat. Mater. 3 (2004) 147-152. 13
[12] D. Lepage, C. Michot, G. Liang, M. Gauthier, S.B. Schougaard, Angew. Chem. Int. Ed. 50 (2011) 14
6884-6887. 15
[13] D.Y.W. Yu, K. Donoue, T. Inoue, M. Fujimoto, S. Fujitani, J. Electrochem. Soc. 153 (2006) A835-16
A839. 17
[14] H.-S. Kim, B.-W. Cho, W.-I. Cho, J. Power Sources 132 (2004) 235-239. 18
[15] S.S. Zhang, K. Xu, T.R. Jow, Electrochim. Acta 49 (2004) 1057-1061. 19
[16] A.K. Padhi, K.S. Nanjundaswamy, J.B. Goodenough, J. Electrochem. Soc. 144 (1997) 1188-1194. 20
[17] N. Ravet, Y. Chouinard, J.F. Magnan, S. Besner, M. Gauthier, M. Armand, J. Power Sources 97-98 21
(2001) 503-507. 22
15 [18] P.P. Prosini, D. Zane, M. Pasquali, Electrochim. Acta 46 (2001) 3517-3523.
1
[19] R.L. Wang, J.R. Dahn, J. Electrochem. Soc. 153 (2006) A1922-A1928. 2
[20] Z. Chen, Y. Qin, K. Amine, Electrochim. Acta 54 (2009) 5605-5613. 3
[21] L.M. Moshurchak, C. Buhrmester, R.L. Wang, J.R. Dahn, Electrochim. Acta 52 (2007) 3779-3784. 4
[22] C. Buhrmester, L. Moshurchak, R.L. Wang, J.R. Dahn, J. Electrochem. Soc. 153 (2006) A288-5
A294. 6
[23] A.J. Bard, L.R. Faulkner, Electrochemical Methods Fundamentals and Applications, second ed., 7
John Wiley & Sons, New York (2001) pp. 163, 423. 8
[24] J.C. Miller, J.N. Miller, Statistics for Analytical Chemistry, third ed., Ellis Horwood PTR Prentice 9
Hall, Chichester (1993) pp. 123. 10
[25] A. Yamada, H. Koizumi, N. Sonoyama, R. Kanno, Electrochem. Solid-State Lett. 8 (2005) A409-11
A413. 12
[26] A.M. C.V. Ramana, F. Gendron, C.M. Julien, K. Zaghib, J. Power Sources 187 (2009) 555-564. 13
[27] A. Ait Salah, P. Jozwiak, K. Zaghib, J. Garbarczyk, F. Gendron, A. Mauger, C.M. Julien, 14
Spectrochimica Acta Part A 65 (2006) 1007-1013. 15
[28] K. Zaghib, C.M. Julien, J. Power Sources 142 (2005) 279-284. 16
[29] C.M. Burba, R. Frech, J. Electrochem. Soc. 151 (2004) A1032-A1038. 17
18 19