OATAO is an open access repository that collects the work of Toulouse
researchers and makes it freely available over the web where possible
Any correspondence concerning this service should be sent
to the repository administrator: tech-oatao@listes-diff.inp-toulouse.fr
This is an author’s version published in:
http://oatao.univ-toulouse.fr/20320
To cite this version:
Cachet, Nadja and Camy, Séverine
and Benjelloun-Mlayah, Bouchra
and Condoret, Jean-Stephane
and Delmas, Michel
Esterification of
organosolv lignin under supercritical conditions.
(2014) Industrial Crops and
Products, 58. 287-297. ISSN 0926-6690
Esterification of organosolv lignin under supercritical conditions
Nadja Cacheta, Séverine Camyb, Bouchra Benjelloun-Mlayaha,*, Jean-Stephane Condoretb, Michel Delmasa,b
a Compagnie Industrielle de la Matière Végétale (CIMV), 109, Rue Jean Bart, Diapason A, 31674 Labege Cedex, France
b Université de Toulouse, INP-Ensiacet, Laboratoire de Génie Chimique (LGC), 4 allée Emile Monso-BP 44362, 31030 Toulouse Cedex 4, France
ARTICLE INFO ABSTRACT
An organosolv lignin, extracted in organic acid media, named Biolignin™, was acetylated with acetic anhydride in supercritical carbon dioxide (scC02). The effect of moisture and specific surface of lignin
sample, temperature (50, 80, 100, 150 "C), reaction time and the use of a catalyst have been studied using
analytical techniques such as FT-IR, quantitative 31 P NMR and Differential Scanning Calorimetry (DSC).
The reaction appeared ta be more efficient when a dried organosolv lignin was used (97% Dry Matter)
and with a specific surface of 0.645 m2 /g. The highest degree of substitution of acetylated samples was
obtained after 1 h of reaction at a temperature of 100 '( (180bar) and in the presence of pyridine as a
catalyst. Keywords: Organosolv lignin Acetylation Supercritical C02 Quantitative 31 P NMR
Differential Scanning Calorimetry
When compared with conventionally acetylated lignin (using a solvent medium), it appeared that
supercritical conditions allowed a higher yield of acetylation and a decrease of the glass transition
temperature of the lignin.
1. Introduction
Lignin is composed of three main phenylpropanoid units, namely sinapyl (S), guaiacyl (G), and p-hydroxylphenyl (H) unit and clearly is the most abundant substance based on aromatic moi eties in nature. The amount of this natural polymer on the earth
is estimated at about 300Gt (Singh et al., 2005). lt is then a very
promising substitute to most of petrochemicals. Chemical modifi cation of lignin, such as esterification, could be used to improve its compatibility for a further transformation. Esterified lignin can be
used for example to synthesize durable composites (Olsson, 2011 ),
in unsaturated thermosets (Thielemans and Wool, 2005) or also as
a biopolymer precursor for carbon fibers (Zhang and Ogale, 2013).
ln addition, lignin can be esterified (generally acetylated) in order
to determine and quantify its functional groups (El Mansouri and
Salvado, 2007; Cateto et al., 2008; Delmas et al., 2011 ). Lignin is gen erally esterified with a mixture of anhydride and pyridine (1 :1, v/v) and the procedure to recover modified lignin is long and tedious.
ln the present work we have developed an efficient and envi ronmental friendly procedure to acetylate lignin using supercritical carbon dioxide as a solvent (termed as se-conditions) and acetic anhydride as a reagent with or without the presence of pyridine as
* Corresponding author. Tel.: + 33 534318242.
E-mail address: b.benjelloun@cimv.fr (B. Benjelloun-Mlayah). https://doi.org/10.1016/j.indcrop.2014.03.039
the catalyst. The aim of the study was to develop a "green" and user friendly protocol in order to quickly recover the acetylated lignins suppressing most of the time-consuming separation/purification steps. lndeed, the use of se-conditions instead of conventional con ditions has several advantages. As a result, it promotes the induced polymer and biopolymer transformations these were effected to
be easier and complete (Yalpani, 1993); the organic solvents and
taxie by-products are eliminated and/or significantly reduced; and finally, the separation and purification of the final product is gen
erally faster and easier (Young et al., 2003).
These advantages of the use of supercritical carbon dioxide as a solvent for biopolymer chemical modifications have already been
demonstrated in the case of cellulose oxidation (Camy et al., 2009).
Following acetylation under se-conditions, the modified lignin could then be used for further analysis or for a further chemical transformation.
The procedure was optimized on a type of lignin obtained
from an organosolv process. This lignin, named Biolignin ™, is
obtained from CIMV refining process (Benjelloun-Mlayah et al.,
2009; Benjelloun-Mlayah and Delmas, 2011 ).
The efficiency of the acetylation was evaluated by conventional analytical methods such as Attenuated Total Reflectance system Fourier Transform lnfrared (ATR-FT-IR) as well as quantitative 31 P NMR spectroscopy. Comparison between the conventional acety
lation of the Biolignin™ showed that the physical parameters were
media allowed a complete dissolution of the BioligninTM sample
during the reaction; whereas the BioligninTM sample acetylated in
se-conditions was kept solid state.
The analysis of the acetylated sampi es by Differential Scanning Calorimetry (DSC) permitted to compare the physical parameters of the sampi es.
2. Materials and methods
2.1. Materials
The organosolv lignin studied below is named BioligninTM.
BioligninTM was extracted at pilot scale (CIMV, Pomacle, France)
from wheat straw with a mixture of acetic acid/formic acid/water
(55:30:15, w/w/w) using the CIMV process (Benjelloun-Mlayah
et al., 2009; Benjelloun-Mlayah and Delmas, 2011 ). The lignin
content of the BioligninTM (i.e. Klason lignin content) was about
89.8% ± 1.5%. The molecular weight in number (Mn) and the molec
ular weight in weight (Mw) of the BioligninTM sample were
evaluated at 889 and 1719 g/mol, respectively.
Ali chemicals used were ofreagent or HPLC grade and were pur
chased from Panreac (Castellar del Vallès, Espafia). The CO2 used for
the supercritical esterification was provided by Air Liquide with 99.9% purity.
The supercritical experiments were performed in a stainless steel high pressure vesse! with an internai working volume of90 ml (Top Industrie, France) equipped with an ISCO pump (Teledyne Iseo,
mode! 260D) to fi.li the reactor from the CO2 tank.
2.2. Biolignin TM acetylation using supercritical carbon dioxide
( sc-conditons)
About 1 g of a Biolignin TM sample with a known moisture con
tent was put in an empty tea bag and placed in the 90 mL-scCO2
reactor. Before pressurization with CO2, a large excess of acetic
anhydride was added in the reactor ( about 5 g, i.e.> 10 eq/free OH
of the BioligninTM sample) (Fig. 1). For the experiments which
required a catalyst, 100 µ.L of pyridine were added to acetic anhy dride.
The scCO2 reactor was heated until reaching the desired tem
perature and then the CO2 was introduced into the reactor thanks
to the pump with a low flow rate ( 4-6 ml/min) to avoid any
Pump
Thermocouple probe
Refi/1 valve
-•
BioligninTM powder dispersion until the desired pressure was
reached. In this work, the CO2 is used as a solvent in order to allow
the contact between acetic anhydride and solid lignin.
At the end of the defined reaction time, the pressure was slowly
released using the release valve (Fig. 1 ). When the pressure in the
reactor reached the atmospheric pressure, it was unsealed and the
modified Biolignin TM, contained in the tea bag, was recovered and
placed in an oven dryer at 50 °C during 48 h.
The temperatures studied in this work were 50, 80, 100 and 150 °c and the pressure range was 100-180 bar. In this work, the different pressures used were selectively chosen from the exper
imental liquid-fluid diagram of the CO2-acetic anhydride binary
system previously described by Calvo and de Loos (2006) and
Muljana et al. (2011) in orderto ensure a single-phase system which is necessary for optimal reaction conditions.
2.3. Biolignin TM acetylation using conventional procedures
Acetylation was conducted using acetyl anhydride and pyri dine. Conventional acetylations were performed for comparison
of experimental results with acetylated BioligninsTM under sc
conditions. Three reference experiments were conducted (Table 1 ):
- Control 1: The conditions selected in this experiment were these usually selected for the acetylation of lignin used for a further analytical analysis. Hence, 2 ml of pyridine and 2 ml of acetic
anhydride were added to 200 mg of BioligninTM with known
moisture content. The sample was stirred at room temperature during 72 h.
- Control 2: 4ml of pyridine and 4ml of acetic anhydride were placed in a 100 mL-flask equipped with a condenser. 400 mg of
BioligninTM were then added. The sample was stirred at 100 °C
during 1 h.
- Control 3: 4ml of 1,4-dioxane, 4ml of acetic anhydride and 100 µL of pyridine were placed in a 100 mL-flask equipped with
a condenser. 400 mg of Biolignin TM were then added. The sample
was stirred at 100 °C during 1 h.
The reaction was quenched by adding a mixture of methylene chloride and methanol (8:1, v/v, 18 ml for 200 mg of unmodified
BioligninTM). Stirring was maintained at room temperature during
30 min. The mixture was then transferred to a funnel and washed
Release valve
-90 ml sc CO2 reactor containing: -A tea bag containing Biolignin™
-Ace tic anhydride Magnetic stirring
Table 1
Summary of the experiments of acetylation.
Biolignin™ used T(°C) P(bar)
Specific surface (m2 /g) Dry matter (DM)
Control 1 0.645 97% 25 Patm Control 2 0.645 97% 100 Patm Control 3 0.645 97% 100 Patm Expl 0.335 97% 50 100 Exp2 0.335 90% 50 100 Exp3 0.645 97% 50 100 Exp4 0.645 97% 50 100 Exp5 0.645 97% 50 100 Exp6 0.645 97% 80 160 Exp7 0.645 97% 100 180 Exp8 0.645 97% 100 180 Exp9 0.645 97% 100 180 Explü 0.645 97% 100 180 Expll 0.645 97% 100 180 Exp12 0.645 97% 150 180
with, respectively, 2 M HCI aqueous solution, NaHCO3 aqueous saturated solution, and distilled water. The organic phase was col lected and dried with MgSO4. After removing MgSO4, the solvent
was evaporated under reduced pressure. Acetylated BioligninTM
was recovered as a sparkling dark powder. The sample was kept in an aven dryer at 50 °C during48 h and stored under dry atmosphere.
These reference experiments are termed "acetylation using con ventional procedures".
2.4. Infrared spectroscopie analyses
The modified and unmodified Biolignin TM samples were char
acterized by infrared analyses using an attenuated total reflectance system (ATR) on a PerkinElmer Spectrum 100 Universal ATR-FrIR instrument equipped with a diamond/ZnSe crystal single reflection. 10 mg of dried unmodified or acetylated Biolignin TM were
placed on the crystal plate on which a constant pressure of 85 N/mm2 was applied. Each spectrum was obtained after eight
scans at a resolution of 4 cm-1.
To compare the obtained spectra, each spectrum was nor malized with the intensity of the absorbance peak A1510, which
was attributed to a characteristic band of the aromatic skeletal vibrations. The normalization and the baseline correction were processed as it was explained by Gilarranz et al. (2001 ).
2.5. Quantitative 31 P NMR
The 31 P NMR technique provides quantitative information for
various types of hydroxyl groups and is widely applied to iso
lated lignin samples (Pu et al., 2011 ). Approximately 30 mg of
dried modified or unmodified Biolignin TM were transferred into a
1.5 mL-sample via! and 400 µ,L of a mixture of freshly distillated pyridine/deuterated chloroform (1.6:1, v/v) were added. The sam ple via! was flushed with argon gas, sealed and magnetically stirred at room temperature until complete dissolution.
N-Hydroxynaphtalimide and chromium (III) acetylacetanoate were used as the internai standard and relaxation agent, respec tively. 100 µ,L of 0.01 mmol/mL of the internai standard and 100 µ,L of 0.0143 mmol/mL of the relaxation agent in the solvent system above were added to the sample via!. Finally, 100 µ,L of 2-chloro-1,3,2-dioxaphospholane was added and the mixture was left at room temperature for 20 min with continuous stirring. The pre pared sample solution was then transferred into a 5 mm NMR tube and immediately analyzed.
The spectra were acquired using a Bruker Avance 400 MHz spectrometer equipped with a 5 mm TBO BB-1 H/31 P/D Z-GRD 2104586/0001 probe. A sweep width of 10,000 Hz was observed,
Reaction time (h) 72 1 1 6 6 6 10 24 24 24 24 6 Catalyst
Pyridine/acetic anhydride media ( 1: 1) Pyridine/acetic anhydride media ( 1: 1)
1,4-Dioxane/acetic anhydride media (1: 1) + pyridine ( cat.)
Pyridine (cat.) Pyridine (cat.) Pyridine ( cat.) Pyridine (cat.)
and spectra were accumulated with time delay of 25 s between
pulses. A pulse width causing 90° flip angle was used. Line broad
ening of 4 Hz was used in processing spectra. The number of scans was set to 128. Ali chemical shifts reported in this paper are relative to the reaction product of water with the phosphitylating reagent
which has been observed to give sharp signal in pyridine/CDCl3 at
121.1 ppm (Argyropoulos, 1994).
Based on the work of Jasiukaityte et al. (2010), the maximum
standard deviation was considered to be 2 x 10⁻² mmol/ g and the
maximum standard error was 1 x 10⁻² mmol/g.
2.6. Differential Scanning Calorimetry (DSC)
The Differential Scanning Calorimetry (DSC) is a technique allowing the study of the thermal behavior of a sample. DSC mea surements were performed on a Setaram (Caluire, France) DSC131. The analyses were conducted on 5-10 mg of acetylated or unmo
dified Biolignin™ in alumina pans sealed by a drilled alumina !id,
under nitrogen atmosphere. Prior to running DSC scans, samples were placed in an aven dried at 50 °C during 48 h to avoid any sol vent/water artifacts. In order to eliminate the thermal history of the sample, two step scans were conducted. The first step allowed the annealing of the sample (i.e. the suppressing of the thermal history of the sample ). The sample was subjected to an initial scan where
it was heated in DSC from 30 °C to 145 °C and maintained at 145 °C
during 30 min. The sample was then cooled down to 0 °C and main tained at this temperature during 30 min. The second heating run
was used to determine the glass transition temperature (Tg) of the
sample. The following temperature program was used: heat ramp
from 0 °C to 250 °C at 10 °C/min, isothermal state at 250 °C dur
ing 10 min and cooling to room temperature at 30 °C/min under air flow. The cooling phases of the samples DSC scans were not recorded.
3. Results and discussions
The procedures tested to acetylate the Biolignin™ samples
under se-conditions were very user-friendly and allowed a quick
recovery of the modified Biolignin TM as shown in Fig. 1. At the end
of the reaction, the modified Biolignin TM was easily recovered by
untying the small tea bag, in which the Biolignin ™ was initially put
(Fig. 1 ).
In an effort to optimize the reaction, a variety of variable were investigated: the specific surface (related to the particle size of the
sample) and the moisture of the Biolignin™ samples, the time and
Table2
Main IR bands assignment of the acetylated and initial BioligninTM samples.
Band position (cm-1) Assignment 3400 2939 2848 1823 1741 1711 1651 1597 1510(ref) 1459 1423 1363 1327 1222 1200 1156 1121
O-H stretching of aromatic and aliphatic OH groups
C-H asymmetric and symmetric vibration of methyl/methylene groups
C-H asymmetric and symmetric vibration of methyl/methylene groups/C-H stretching in O-CH3 groups Characteristic band of acetic anhydride
C=O stretch of aliphatic acetyl groups C=O stretch (unconjugated)
C=O stretch in conjugated p-substituent carbonyl and carboxyl
Aromatic skeletal vibration and C=O stretch ring Aromatic skeletal vibration
O-CH3 deformation, C-H deformation asymmetric in CH3 and CH2 Aromatic skeletal vibration with C-H in-plane deformation C-H of aliphatic chain, acetoxy CH3 bending
c-o and C-C of syringyl ring (S-units)
c-o-c of guaiacyl ring (G-units) (phenolic groups) C-O-C of aromatic acetyl groups
Aromatic C-H in plane deformation, typical of G-units 995
886
Aromatic C-H in plane deformation (S-units), characteristic band of acetic anhydride Characteristic band of acetic anhydride
Characteristic band of acetic anhydride
3.1. ATR-FTIR spectra
3.1.1. Influence of specific surface and moisture of the Biolignin TM The moisture of the BioligninTM sample, linked to its swelling
properties, and the specific surface of the sample could have an important role on the efficiency of the acetylation reaction. To determine the effect of the moisture on the reaction, two samples ofBiolignin TM, 90% and 97% Dry Matter (DM), have been acetylated
under supercritical conditions, temperature and pressure were set at 50°C and lOO bar, respectively. The modified BioligninTM sam
ples obtained were characterized after 6 h of reaction.
The ATR-ITIR spectra of the resulting acetylated BioligninsTM
indicated that these above conditions allowed a partial acety
lation of the Biolignin TM samples. Indeed, a shoulder band at
V"" 1741 cm-1 was distinguishable. This band could be attributed to
the C=O vibration of aliphatic acetyls (Table 2). In the same manner,
the presence of a shoulder band was noted at v"" 1200 cm-1 and
was attributed to the C -0 vibration of aromatic acetyls (Table 2 ).
On the other hand, the characteristic broad band attributed to the hydrogen bonded-OH, at v"" 3400 cm-1, was still apparent indicat
ing that the acetylation of the Biolignin TM samples was incomplete.
The ATR-ITIR spectra of acetylated BioligninsTM obtained from
"dried" ( dry matter (DM) 97%, Expl) and "wet" Biolignin TM (DM
90%, Exp2) were compared (Fig. 2).
The characteristic bands of acetic anhydride (v""1823, 1121,
995 and 896 cm-1) indicated that both acetylated Biolignin TM sam
ples contained traces of unreacted acetic anhydride.
According to the literature the band at v"" 1510 cm-1 is one of
the three characteristic bands assigned to aromatic skeletal vibra
tions (Gilarranz et al., 2001 ). This band is well defined in every
unmodified and modified BioligninsTM spectra. It could thus be
used to normalize the spectra (the spectra were normalized with
the intensity of the absorbance peak A1510 as it was indicated by
Gilarranz et al. (2001 ).
The IR spectra were studied by calculating the ratio of the absorbance of a specific band with the one of the band at
v"" 1510 cm-1. Thus, the calculated ratios were used to compare an
IR spectrum with each other. As noted above, the bands at v"" 1741
and 1200 cm-1 could be attributed to the C=O vibration of aliphatic
acetyls and the C-0 vibration of aromatic acetyls, respectively. Even if no precise value could be determined, the ratios A1141 /A1510
and A1200/A1510 could then give an indication on the degree of
substitution (DS) ofhydroxyl groups by acetyl groups in the acety lated sample. Indeed, the greater these ratios, the greater the DS.
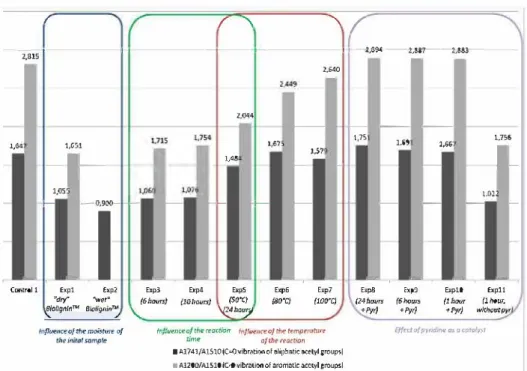
As shown in Fig. 3, the ratio A1741 /A1510 was higher on the
spectrum of the acetylated BioligninTM from a dry BioligninTM
sample than from a wet BioligninTM sample (1.055 instead of
0.900 for acetylated BioligninsTM from dry (Expl) and wet (Exp2)
BioligninTM, respectively). Indeed, these experiments indicated
that the reaction is more efficient when the initial Biolignin TM is
dry.
The influence of the specific surface was also studied. The spe cific surface is defined as the accessible area of a solid surface per unit mass of material. In the case of lignin powder and thanks to a better contact between lignin and the reagent (acetic anhy dride), its reactivity could be enhanced by a higher specific surface. To increase the specific surface of the samples, the unmodified
BioligninTM was grinded at two different stages:
- A rough grinding ( average particle diameter: 1000 µ,m) which led to a specific surface of 0.335 m2 /g
- A medium-fine grinding (average particle diameter: 68 µ,m)
which led to a specific surface of 0.645 m2 /g
Thus, the reactivity of a roughly grinded sample (Expl, specific
surface of0.335 m2 /g) and the one ofa medium-fine grinded sample
(Exp3, specific surface of 0.645 m2 /g) were compared.
As shown in Fig. 3, the use of dry BioligninTM with a
higher specific surface induced a slightly better acetylation (A1741/A151o = 1.060 instead ofl.055 andA1741 /A1510 = 1.715 instead
of 1.651 for, respectively Exp3 and Expl ).
From these results, the following experiments were done using
a dry Biolignin TM (DM 97%) with a specific surface of 0.645 m2 /g.
3.1.2. Influence of reaction time and temperature
Esterification is known to be an equilibrated and slow reaction. Traditionally, 24 h to few days of reaction are required in conven tional media to esterify lignin samples. Thus, after 6 h of reaction
under the above se-conditions, the acetylation ofBioligninTM sam
ples might not have reached the equilibrium. Few experiments were proceeded to determine the kinetics of reaction: 6, 10 and
24 h of reaction were respectively tested on dry Biolignin TM sam
ples (97% DM) with a specific surface of 0.645 m2 /g (Exp3, 4 and
5, respectively). One of the goals of using supercritical conditions
instead of conventional conditions was to acetylate the BioligninTM
in a limited reaction time. Then, the maximum reaction time was set to 24 h.
The ratios A1741 /A1510 and A1200/A1510 were measured on ITIR
3400 -1 1741 18 3 11 1200 12 0 1823 1,10 1500 1200 12 11 1 995 100) 9 5 8 6
Exp1: Dry Bioligninn., alter acetylated: Speciftc surface 0.335 m'lg, DM (Dry Malter) 97%
Exp2. Wet BIolIgnin n., atter acetylated: SpecIt1c surface o. 335 m'lg, DM 90% Exp3: Dr_x Biolignin n,, alter acetylated: Specific surface 0.645 m'/g, DM 97%
Biolignin " before aœtylation: Specific surface 0.645 m'lg, DM 97%
1a::JO 1600 1400 1200 1000
cm-1
Fig. 2. ATR-FTIR spectra of initial Biolignin™ and acetylated Biolignins™ from Expl-3.
According to these measurements, the acetylated Biolignin™ sam
ples recovered after 6 and 10 h of reaction had a similar degree
of substitution (DS) of aliphatic hydroxyl groups (A1741/A1510
of 1.060 and 1.076, respectively) and aromatic hydroxyl groups
(A1200JA1510 of 1.715 and 1.754, respectively). After 24 h of reac
tion, the acetylated Biolignin™ sample seemed to have a higher
DS of aliphatic hydroxyl groups (A1741/A1510 of 1.484, Exp5). The
shoulder band at v"" 1200 cm-1, attributed to the C-O vibration of aromatic acetyls, was also stronger than on the previous Ff!R
spectra (A1200JA1510 = 2.044), indicating a better acetylation of aro
matic hydroxyl groups. In the above conditions (50 °C, 100 bar), 24 h
of reaction allow the acetylation of a Biolignin TM sample with a DS a
bit lower but in a same range that to the one obtain in conventional esterification after 72 h of reaction in presence of a large excess of pyridine (Exp Control 1, Fig. 3).
Since temperature is expected to have a positive influence on the esterification reaction, three temperatures, superior to critical
I' / '\
'
1
-- - - - --t- - 1-- - - - -1 -t-- --->-- - - - -1-1----el,e\l-l-.- ;SS?--.;S<----
-2,a.1s
-l,G4 -Ca.ntrol 1 l.Oo!l4 -1,Ci!"-1-
r
-
1,.::is 1.055 f- --0,900- - ---
1
Exp1 fap.2 1'dry" "weru {_lôllrJfllflTLf 8i()li9nin�-
-
-E>:p3 E>:p4 E>:pS {6hou,s} {Whau,s} (SO'C/
\._ �4ha°? 2.6�0
- l,'6i'J-),57 � -f--f---
'-'""'
/80'C) Exp7 (lOO"C) -t,75 -1.69--
' -E�p8 hpQ 124 hrwrs (6 ™Jurs +Py,/ +Py1} -1,756 l,66f_
-- -t,Oll - T -E>:p10 bp11 t1 hoor (l hour, -+Pyr) w)thoufpy,i:lrifluenci!'oj tfii!' mOOtull of the ùtita1 sompte
Influence of the rmctir,n lriJluenœof ftii!' h!m�rotul? E/lrd of p)Aridin,r ers a ,ct.a/1,111 tl'me afth� reacti,on
■ Ali'4l/Al.510K=-Ovibr,:itionof eilipho,ti� &el:'lV1 grour,.] ■ A1200/Al.510 jC:,ü vibrntion of êlr'OmLltiC ilCClyl groupsJ
Fig. 3. Ff!R absorbance ratios of A1741 /A1510 and A1200/A1510 of acetylated Biolignin™ samples.
and 7, respectively ). Ouration of these experiments was set at 24 h. Oepending on the temperature, the pressure was adapted from 100 bar to 180 bar in order to stay in a single-phase system during the reaction (Table 1 ).
According to the ratio A1741/A1510 on the obtained ITIR spec
tra, the OS of aliphatic hydroxyl groups by acetyl groups seemed
to increase with the temperature (Fig. 3). It is interesting to note
that when the temperature of the reactor was set to 100 °C, the ratio A1741 /A1510 was lower than the one of the experiment proceeded at
80 °C (A
1741 /A1510 = 1.579 and 1.675, respectively) . However, the OS
of aromatic hydroxyl groups seemed to increase with the tempera
ture. Indeed, the ratio A1200/A1510, was higher on the ITIR spectrum
of Exp7 than on the spectra of the previous experiments. A shoul der band at v"" 1760 cm-1 also appeared (not shown), this last
band was attributed to the C=O vibration of aromatic acetyl groups. Finally, the intensity of the band assigned to free phenolic groups
(v"" 1220 cm-1) decreased (not shown) and the broad band corre
sponding to the hydrogen bonded -OH ( v"" 3 400 cm-1) had nearly
disappeared on the ITIR spectrum of the BioligninTM acetylated at
100 °C. Then, it seemed that the sum of aliphatic and aromatic acetyl
groups increased with the temperature during the reaction. From these results, the temperature of the reaction was set to
100 °c for the following experiments.
3.1.3. Effect of pyridine as a catalyst
Without any catalyst, the acetylation of the BioligninTM in a sc
CO2 reactor required 24 h of reaction to obtain a OS of hydroxyl groups close to the one obtained after 7 2 h of reaction in conven tional media (Exp Control 1, acetic anhydride/pyridine 1: 1 v/v). The use of a catalyst may considerably reduce this reaction time. As it was used in acetylation of Iignin in conventional media, pyri dine was chosen as the catalyst of the reaction. Thus, 100 µL of pyridine were added to the acetic anhydride at the beginning of the reaction. The kinetics of the reaction was studied : The exper iments 8, 9 and 10 were respectively stopped after 24, 6 and 1 h
of reaction (Table 1 ). The recovered acetylated Biolignin TM sam
pi es were then analyzed by ATR-ITIR. After 24 h of reaction, it seemed that the catalyst did not allow the recovery of an acetylated
BioligninTM sample with a dramatically higher OS of its hydroxyl
groups compared to the same experiment without catalyst (Exp 8
compared to Exp7, Fig. 3). The OS obtained after 1 and 6 h ofreaction
(Expl 0 and 9, respectively) seemed to be almost identical of the one observed after 24 h of reaction. These values were very similar to
th ose observed on Biolignin TM sampi es acetylated in conventional
media (Fig. 3). Thus, with pyridine as a catalyst, the reaction time
could be easily reduced to 1 h under the above se-conditions. To check the catalytic effect of pyridine, a control experiment
(Expl l) wasconducted in thesame conditions asExp10(1 h, 100°C,
180 bars) without pyridine. As shown in Fig. 3, the OS of the acety
lated Biolignin TM seemed to be lower in absence of pyridine (Expl 1
compared to ExplO).
The catalytic effect of pyridine for the acetylation of Biolignin TM
under se-conditions is then demonstrated.
The OS observed on acetylated BioligninTM samples after 24h
of reaction and under the applied se-conditions (100cc, 180bar),
were close whatever pyridine was added or not. Considering that few hydroxyl groups were still free, it is possible that the steric hindrance and/or the conformation of Iignin fragments prevent a higher substitution of the hydroxyl groups. Thus, the presence of a catalyst cannot improve the substitution of these hydroxyl groups. This could exp Iain that the OS of Exp8 (with pyridine) was close to the one observed in Exp7 (without pyridine).
According to the ITIR analyses, the best supercritical conditions
defined by the above experiments were 100 °c, 180bar, 1 h ofreac
tion in presence of pyridine as a catalyst (100 µL). Fig. 4 gave an
overview of the ITIR spectra of BioligninTM before acetylation, sc
acetylated BioligninTM with non-optimized conditions (Exp3, 6h,
5 0 °C; 100 bar, without catalyst) and sc-acetylated Biolignin TM with
optimized conditions (Expl 0, 1 h, 100 °C; 180 bar, with pyridine as
a catalyst).
The ITIR analyses gave a global view of the OS of the acety
lated Biolignin TM hydroxyl groups. However the Jack of accuracy of
this kind of analysis did not allow a reliable quantification of the
BioligninTM functional groups. To quantify the functional groups,
the acetylated BioligninTM samples were analyzed by quantitative
1741
1823 1711
11
Biolignin TM before acetylation
1510
12 0 12
Exp10: Dry Biolignin™ after se.CO, acetylation (1h, 100'C, 180bar, with pyridine cal.)
Exo3: Drv Biolionin TM alter se-CO, acetvlalion (6h. 50°C, 1 00bar, without catalvst)
112 11Dl 1600 140J 1(0J
cm-1 IDJ 74
Fig. 4. ATR-FTIR spectra of initial Biolignin™ and acetylated Biolignins™ from Exp3(non-optimized se-conditions) and 10 (optimized se-conditions).
3.2. Quantification of the functional groups in the acetylated
Biolignin™ samples by 31 P NMR
Quantitative 31 P NMR is a method of choice to quantify func
tional groups in lignins (Pu et al., 2011 ). Indeed, in addition to the
quantification of some functional groups, this technique gives pre cious information on the distribution of the free phenolic hydroxyls
in the three main units of the Biolignin TM (i.e. p-hydroxyphenyl (H),
guaiacyl (G), and syringyl (S)-units).
Table 3 summarizes the results of the quantitative 31 P NMR
analysis of some phosphitylated Biolignin™ samples before and
after acetylation. Before acetylation, the Biolignin™ samples con
tained 3.14mmol/g offree hydroxyl groups. The hydroxyl content was in accordance with the one indicated in the literature for
.,;
-�
-;;; C "' <>: � z o.. � -0.,
C .§ 2J Cl) -0 V, "' V, 6 :Jl C·a
-�
ci al -0 2J "' Cl) u "' -0 C "' -0.,
0::::a
0 6 C ::, 0 Cl) ê: 0 u C. ::, ., 0 :a -d "' >, ... ;r: N 0 u 2 ê: 0 u .... c·a
-� ci al -0 Cl) 0::::a
0 6 C =i a, 00 o<i NN ci C')T""'O t.e o r---ot.eoo rri N
"<l'O�tJO�O�,_OO"<l'o<iN�\JO�
OOOOO'lOONOONO'lNOOO
ci ci c:i c:i � ci ci ci ci ci ci r-,.: c:i u-i ci u-i
fi
-�
fi·a
C·a
? ::, ? ;r:'-'
Vl .5 .5 .5 ;r: ;r: ;r: 0 1 0 1 0 1 -;;; -;;; -;;; ::, ::, ::, -0 -0 -0 00 .,... ·tn 1./1 "V] N "V] N O .,... MC.0 CJl.f1 QJr-,. aJOOU7 N.,...O:::NO:::r--0:::aoo.,... oo�,....:�o�ooo r-. N ;r: 0 u -� ;r: .i:: .e-0 1 -;;; -;;; -;;; ::, ::, -0 -0 ·tn rr, "V] Cl)"' Cl) <>: a, <>: o<i oo<i QJ C. 6 :Jl ... 0 � ci 6 É, ;r: 0 -� ci C.,
C. � ;r: 0-�
ci C Cl) .i:: C. -;;; ::, � Cl) <>: o<iwheat straw lignins (Crestini and Argyropoulos, 1997; Yang et al.,
2011) and more specifically for wheat straw Biolignins™ (Delmas
et al., 2011; Arshanitsa et al., 2013). The hydroxyl content of
Biolignin™ included 0.95 mmol/g of aliphatic hydroxyl groups and
2.19 mmol/g of phenolic hydroxyl groups (Table 3).
The 31 P NMR results highlighted the presence of non-acetylated
hydroxyls even when the Biolignin™ samples were convention
ally acetylated (Table 3). Indeed, after acetylation, Controls 1, 2
and 3 still contained 10.8%, 17.4% and 21.5% of free hydroxyl groups, respectively. More than the half of these free hydroxyls was composed of primary aliphatic hydroxyls. In ail conventional ester ification procedures and supercritical conditions tested, it seemed nearly impossible to acetylate ail aliphatic hydroxyls. The opti mized supercritical experiment (Expl 0) gave the best results: after reaction, Jess than 8.0% of the hydroxyl groups were still free (Table 3), i.e., Jess than when using conventional procedures. How ever, once again, these free hydroxyls were mainly composed of aliphatic hydroxyls (75.0%). This unexpected result draw atten tion on the pertinence of the hydroxyl group quantification of
Biolignin™ by the very common GC-FID method, often quoted in
the literature. Indeed, this technique implies the acetylation (usu ally in conventional media) of lignin samples before the analysis. The GC-FID chromatograms allow the quantification of released acetyl groups which correspond to free hydroxyl groups of the
unmodified sample (Mansson, 1983). As the Biolignin™ seemed
to be only partially acetylated using conventional procedures, we can wonder whether the quantification by this technique is really effective to assess the whole hydroxyl content.
Focusing on experiments using conventional procedures, it seems that the conditions inducing the higher degree of sub stitution were those of Control 1 (72 h, room temperature,
anhydride/pyridine 1: 1, v/v). In this case, 31 P NMR analysis of the
three acetylated Biolignin™ samples indicated that DS(Control
1) > DS(Control 2) > DS(Control 3) (89.2%, 82.6% and 78.6%, respec tively). These results seemed coherent in regard to the quantity of pyridine used. Indeed, pyridine was added in large excess, as sol vent and catalyst, in Control 1 and 2 whereas it was added only in catalytic quantity in Control 3. It can be deduced that in solvent media, pyridine plays an actif role as a catalyst but also as a sol vent.
According to the 31 P NMR quantification, the ratio of free phe
nolic H, G and S-units in the unmodified Biolignin TM is 1 /6/3. After
acetylation of the Biolignin™ samples, using conventional proce
dures and in se-conditions, 100.0% of the phenolic hydroxyls from H-units and from 72.9 to 100.0% of the phenolic hydroxyls from
S-units were acetylated (Table 3). The phenolic hydroxyls from G
units were the only ones for which ail the tested experiments did not allow a complete acetylation. For the experiments conducted in solvent media, the best G-phenolic hydroxyls acetylation was obtain in Control 1, with 92.2% of G-phenolic acetates at the end
of the reaction. The best sc-experiment 10 (ExplO, Table 3) slightly
improved the degree of substitution until obtaining 95.1% of G phenolic hydroxyls acetylated at the end of the reaction.
Expl 0 and Control 3 experiments shared the same experimental parameters (100 °c, 1 h of reaction, 3 drops of pyridine as catalyst of the reaction), except that ExplO was performed under supercrit ical condition whereas Control 3 was conventionally conducted. lt is then very interesting to especially focus on these two experi ments and compare their results. At the end of the reaction, the
DS of hydroxyl groups of the acetylated Biolignin™ in Control 3
was considerably lower than the one in Expl 0 (78.5% of hydro xyls acetylated in Control 3 against 92.1% in Expl0). In addition to contain a significant amount of free aliphatic hydroxyls (13.8% of the total aliphatic hydroxyls), only 91.3% of S-phenolic hydroxyls of Control 3 were acetylated, which is the second lowest DS of S
phenolic hydroxyls after the one of Exp4 (Table 3). In the case of
-Conttol2 -Conttol3 -ExplO 0,00 20,00 40,00 60,00 80,00 nmi:i@ratur@(a C) 100,00 120.00 140,00
./
1
( Ti
T
!i=99
°C
T!i��11��c
;;:t:.
✓
...
:cT
i=ll0
°C
✓
-Unmodificd B:olignin. -Controll -Control2 -Control3 -E,plO 80,00 90,00 100,00 110,00 TemJJe rature {'"C) IW,00 130,00Fig. 5. DSC thermograms of initial and acetylated BioligninTM samples.
These results showed that, in addition to be a quicker and a more user-friendly procedure, the reaction under supercritical con
ditions allowed a better acetylation of the BioligninTM sample.
In sc-Exp12 (Table 1 ), the temperature of the reaction was
increased to 150 °C in order to check if a higher temperature could
improve the DS of the Biolignin TM hydroxyl groups compared to
Exp10. It appeared that this increase of the temperature did not
allow better acetylation. On the contrary, the modified Biolignin TM
of Exp12 seemed to be slightly less acetylated than the one of
Exp10 (Table 3). Thus, in supercritical conditions, increasing the
temperature up to 100 °Chas a reverse effect: instead ofimproving the DS ofhydroxyl groups, it seemed to decrease it.
It is noteworthy that, physically speaking, conventional acet
ylation of the Biolignin TM was completely different from the
one under se-conditions. Indeed, in conventional procedure, the
BioligninTM sample is insoluble at the beginning. Then, the "modi
fied" BioligninTM sample becomes gradually soluble in the medium
until reaching a complete solubility at the end of the reaction. Finally, after extraction, purification and solvent evaporation, the
Under se-conditions, the Biolignin TM /acetylated Biolignin TM sam
pi es always remain solid during their chemical transformation. Oespite these huge physical differences, similar OS of hydroxyl groups were obtained with the two studied procedures (conven tional and se-conditions), even if those obtained in sc-optimized experiments could be slightly higher. However, according to the
procedure proceeded, the acetylated BioligninTM samples had a
different behavior: conventionally acetylated BioligninsTM were
soluble in a variety organic solvents (acetone, 1,4-dioxane, THF,
etc.) while sc-acetylated BioligninsTM were only slightly solu
ble in these solvents. Sorne physical properties of the acetylated
Biolignin TM sampi es might be impacted by these chemo-physical
differences. Then, the thermal properties of each sample were eval uated by Oifferential Scanning Calorimetry (OSC).
3.3. Thermal properties of the acetylated Biolignin TM samples
The thermal properties of the initial and acetylated BioligninTM
samples were measured by
ose. ose
is the most widely acceptedmethod for determining the glass transition temperature (Tg) of
lignin or modified lignin samples (Glasser, 2000). The Tg of dry
lignin is often difficult to detect due to the complex structure of this polymer. However, it is sometimes possible to detect the
range of the change in the curve (Fox and McOonald, 2010). When
lignin is subjected to a OSC scan, an endothermic enthalpy relax
ation process usually occurs and may affect the Tg determination
measurement. For this reason, it is often recommended to subject the sample to an initial scan (above its Tg) in order to elimi
nate the stored thermal history within the polymer amorphous
non-equilibrium configuration (Cui et al., 2013). Each sample was
thus subjected to an initial OSC scan from 30 °c to 145 °c under nitrogen atmosphere to anneal the polymer. A preliminary scan confirmed that no endothermic or exothermic reactions occurred below 145 °C.
The thermal analysis of the studied sampi es is shown in Fig. 5.
A small endothermic peak at 125 °C, present on ail recorded ther mograms, is an artifact due to the coefficient of expansion of the Al
pans (Al: ~24 ppm/K,
ose
sensor ~9 ppm/K).A preliminary
ose
scan from 30 °C to 400 °C allowed us to identify a large exothermic peak between 220 °c and 280 °c on ail OSC profiles (not shown). This large exothermic peak might be attributed to the breaking of the side chains of lignin fragments (Vallejos et al., 2011 ).
The glass transition region reported in the literature for several
types of lignins is between 90 °c and 180 °c (Lisperguer and Perez,
2009). The Tg of initial Biolignin TM was identified at 110 °C. This
value is in accordance with the reported Tg of organosolv lignins
(Sammons et al., 2013). Except for the sample Contrai 3, the acety
lated Biolignins™ exhibited a T
g lower than the initial Biolignin™
(Fig. 5 ). This result confirmed previous studies on the decreasing of
the glass transition temperature when lignin is esterified (Fox and
McOonald, 2010).
In the Iiterature, it is shown that the greater the number of car bon atoms in ester substituents of lignin, the greater the lignin
ester Tg reduction (Ghosh, 1998; Fox and McOonald, 2010). The
reduction of glass transition temperature was explained by the increase of the polymer free volume and by the disruption of hydro
gen bonds within the lignin polymer (Glasser et al., 1984). Indeed,
this leads to increase the mobility within the lignin molecules and hence the reduction of the glass transition. In the same way, Gif fard et al. patented the mixing of two lignin esters with a different
number of carbon atoms (Giffard et al., 2010). They showed that
the increase of the lignin ester with the higher number of car
bon atoms led to a decrease of Tg of the resulting mixed lignin
ester. To our knowledge, there is no study on the effect on Tg
related to the OS of hydroxyl groups of lignin esters. However, considering our results, it seems consistent to say that the more
a lignin is acetylated, the more the Tg of the resulting lignin ester
is decreased. The measured Tg illustrated in Fig. 5 were in line
with this hypothesis. Indeed, according to the previous results, the
evaluation of the OS of hydroxyl groups ofBiolignin™ esters indi
cated that OS(ExplO) > OS(Control 1) > OS(Control 2) > OS(Control
3). Thus, Tg(ExplO) < Tg(Control 1) < Tg(Control 2)< Tg(Control 3).
The Tg of Expl O was determined as 99 °C, which is much lower
than the Tg of the other experiments (between 108 °C and 11 O °C).
If we consider that the decrease of Tg is linearly linked with the OS
of lignin hydroxyl groups, the OS of Expl O compared to the one of
the other experiments (Table 3) cannot explain such a difference.
The phenolic hydroxyl groups of Exp10 were almost completely acetylated (98.0%) while the best conventional acetylation yielded a maximum acetylation of 96. 7% for the phenolic hydroxyl groups of
the Biolignin TM sample (Control 1 ). The increase of mobility within
the lignin ester molecules is mainly due to the decrease of H-bonds
involving phenolic hydroxyl groups (Glasser et al., 1984). Then, the
decrease of residual phenolic OH in Expl O may parti ail y exp Iain the
decrease of Tg. However, a deeper studywould be needed to confirm
this hypothesis. It is also possible that the procedure of acety
Iation directly affect the Tg of the acetylated Biolignin ™. Indeed,
Tg is closely related to the presence of H-bonds and the mobility
within the lignin. As the sample remained in its solid state dur ing the acetylation under se-conditions, the H-bond interactions of
sc-acetylated Biolignin™ may be lower than the ones of conven
tionally acetylated Biolignin™. This could also explain the lower
Tg obtained in ExplO sample compared to the one of Contrais 1, 2
and 3.
4. Conclusion
The acetylation of the organosolv lignin under se-conditions compared to conventional acetylation presents numerous advan tages. Firstly, a considerable reduction of the reaction time has been demonstrated in this work (1 h compared to few days in the most of case). Moreover, the use of pyridine was dramatically reduced. The measurement of free residual hydroxyl groups after acety Iation indicated that, under the optimized se-conditions, 92% of the hydroxyl groups were acetylated against around 89% in con ventional media. Thus, the degree of substitution (OS) of hydroxyl groups could be higher under se-condition media compared to con ventional conditions. When a production process is envisaged, a very important advantage arises from the elimination of complex extraction/purification steps. In this case, a very "clean" product can be easily recovered by evacuation of carbon dioxide and unreacted anhydride, when return to atmospheric conditions.
On a physical point of view, the acetylation reaction of the
Biolignin™ under se-condition was different than the one obtained
by the conventional procedures where the Biolignin™ sample
became gradually soluble in the medium until reaching a com plete solubility at the end of the reaction. Under se-condition,
the BioligninTM/acetylated BioligninTM samples always remained
in their solid state during their chemical transformation. In spite of this huge physical difference during the reaction, the OS of
hydroxyl groups of acetylated BioligninTM seemed to be approx
imately the same. However the procedure induced a different
physical behavior. The conventionally acetylated Biolignin TM sam
pi es were soluble in a variety of organic solvent (THF, 1,4-dioxane,
acetone, etc.) while the acetylated BioligninTM samples under se
condition were poorly soluble in the same solvents. Finally, the study of the thermal behavior of the samples indicated that lignins acetylated under se-conditions presented a glass transition tem perature lower than conventionally acetylated Iignins.
Aclmowledgements
The authors thank the CIMV Company for providing the wheat straw lignin used in this work. The authors are also grateful to Dr. Pierre Lavedan and Dr. Marc Vedrenne for their precious help in the
establishment of the quantitative 31 P NMR procedure.
References
Argyropoulos, D., 1994. Quantitative phosphorus-31 NMR analysis of lignins, a new tool for the lignin chemist.J. Wood Chem. Technol. 14 (1 ), 45-63.
Arshanitsa, A., Ponomarenko, J., Dizhbite, T., Andersone, A., Gosselink, R., van der Putten,J., et al., 2013. Fractionation oftechnical lignins as a tool for improvement oftheir antioxidant properties.J. Anal. Appl. Pyrol. 103, 78-85.
Benjelloun-Mlayah, B., Delmas, M., 2011. US Patent WO 2011/154293 Al. Benjelloun-Mlayah, B., Delmas, M., Avignon, G., 2009. US Patent 2009/0065158 Al. Calvo, L., de Loos, T., 2006. High pressure vapour-liquid equilibria of the binary and some of the ternary and multicomponent mixtures of the carbon diox ide + acetic anhydride+ a-methylbenzyl alcohol + acetic acid + a-methylbenzyl acetate system Experimental and modelling results. Fluid Phase Equilibr. 244, 179-187.
Camy, S., Montanari, S., Rattaz, A., Vignon, M., Condoret, J.-S., 2009. Oxidation of cellulose in pressurized carbon dioxide.J. Supercrit. Fluids, 188-196.
Cateto, C., Barreiro, M., Rodrigues, A., Brochier-Salon, M., Thielemans, W., Belgacem, M., 2008. Lignins as macromonomers for polyurethane synthesis: a comparative study on hydroxyl group determination. J. Appl. Polym. Sei. 109, 3008-3017.
Crestini, C., Argyropoulos, D., 1997. Structural analysis of wheat straw lignin by quantitative 31 P and 2D NMR spectroscopy. The occurence of ester bond and
a-0-4 substructures.J. Agric. Food Chem. 45, 1212-1219.
Cui, c., Sadeghifar, H., Sen, S., Argyropoulos, D., 2013. Toward thermoplastic lignin polymers, Part li: Thermal and polymer characteristics of Kraft lignin and deriva tives. Bioresources 8 ( 1 ), 864-886.
Delmas, G.-H., Benjelloun-Mlayah, B., Le Bigot, Y., Delmas, M., 2011. Functionality of wheat straw lignin extracted in organic acid media. J. Appl. Polym. Sei. 121, 491-501.
El Mansouri, N.-E., Salvado, J., 2007. Analytical methods for determining functional groups in various technical lignins. lnd. Crops Prod. 26, 116-124.
Fox, C., McDonald, G., 2010. Chemical and thermal characterization of three indus trial lignins and their corresponding lignin esters. Bioresources 5 (2 ), 990-1009.
Ghosh, 1., 1998. Blends of Biodegradable Thermoplastics with Lignin Esters. Virginia Polytechnic Institute and State University, VA, USA.
Gifford, A., Westland,J., Neogi, A., Ragan, K., 2010. US Patent 2010/0152428 Al. USA. Gilarranz, M., Rodriguez, F., Oliet, M., Garcia, J., Alonso, V., 2001. Phenolic OH group estimation by FTIR and UV spectroscopy. Application to organosolv lignins. J. Wood Chem. Technol. 21 (4), 387-395.
Glasser, W., 2000. Classification of lignin according to chemical and molecular structure. In: Glasser, W.G., Northey, R.A., Shultz, T.P. (Eds.), Lignin: Historical, Biological, and Materials Perspectives. American Chemical Society, Washington, DC, pp. 216-238.
Glasser, W., Barnett, C., Rials, T., Saraf, V., 1984. Engineering plastics from lignin. li. Characterization of hydroxylalkyl lignin derivatives. J. Appl. Polym. Sei. 29 ( 5 ), 1815-1830.
Jasiukaityte, E., Kunaver, M., Crestini, C., 2010. Lignin beaviour during wood liquefaction-characterization by quantitative 31 P, 13 C NMR and s1ze exclus10n
chromatography. Catal. Today 156, 23-30.
Lisperguer, J., Perez, P.U., 2009. Structure and thermal properties oflignins: charac terization by infrared spectroscopy and differential scanning calorimetry. J. Chil. Chem. Soc. 54 ( 4), 460-463.
Mansson, P., 1983. Quantitative determination of phenolic and total hydroxyl groups in lignins. Holzforschung 37 (3), 143-146.
Muljana, H., Picchioni, F., Knez, Z., Heeres, H., Janssen, L., 2011. Insights in starch acetylation in sub- and supercritical C02• Carbohydr. Res 346, 1224-1231. .
Olsson, S., 2011. The use of esterified lignin for synthesis of durable composites. In: 7th Meeting of the Nordic-Baltic Network in Wood Material Science and Engineering (WSE), Oslo, pp. 173-178.
Pu, Y., Cao, S., Ragauskas, A., 2011. Application of quantitative 31 P NMR in
biomass lignin and biofuel precursors characterization. Energy Environ. Sei. 4, 3154-3166.
Sammons, R., Herper, D., Labbé, N., Bozell, J., Eider, T., Rials, T., 2013. Character ization of organosolv lignins using thermal and FT-IT spectroscopie analysis. Bioresources 8 (2), 2752-2767.
Singh, R., Singh, S., Trimukhe, K.D., Pandare, K.V., Bastawade, K.B., Gokhale, D.V., Varma, A.J., 2005. Lignin-carbohydrate complexes from sugarcane bagasse: preparation, purification, and characterization. Carbohydr. Polym. 62 ( 1 ), 57-66.
Thielemans, W., Wool, R., 2005. Lignin esters for use in unsaturated thermosets: lignin modification and solubility modeling. Biomacromolecules 6, 1895-1905.
Vallejos, M., Felissia, F.C., Zambon, M., Ramos, L., Area, M., 2011. Chemical and physico-chemical characterization oflignins obtained from ethanol-water frac tionation of bagasse. Bioresources 6 (2), 1158-1171.
Yalpani, M., 1993. Supercritical fluids: puissant media for the modification ofpoly mer and biopolymers. Polymer 34 (5), 1102-1105.
Yang, Q,, Wu, S., Lou, R., LV, G., 2011. Structural characterization oflignin from wheat straw. Wood Sei. Technol. 45, 419-431.
Young, J., DeSimone, J., Tumas, W., 2003. In: DeSimone, J., Tumas, W. (Eds.), Green Chemistry using Liquid and Supercritical Carbon Dioxide. Oxford University Press, New York.
Zhang, M., Ogale, A., 2013. Acetylated-lignin as a biopolymer precursor for carbon fibers. In: 245th ACS National Meeting and Exposition, New Orleans, LA, Umted States, POLY-483.