HAL Id: hal-01593333
https://hal.archives-ouvertes.fr/hal-01593333
Submitted on 26 Apr 2019
HAL is a multi-disciplinary open access
archive for the deposit and dissemination of
sci-entific research documents, whether they are
pub-lished or not. The documents may come from
teaching and research institutions in France or
abroad, or from public or private research centers.
L’archive ouverte pluridisciplinaire HAL, est
destinée au dépôt et à la diffusion de documents
scientifiques de niveau recherche, publiés ou non,
émanant des établissements d’enseignement et de
recherche français ou étrangers, des laboratoires
publics ou privés.
The importance of surface energy in the dispersion
behaviour of talc particles in aqueous media
Laurence Galet, Carol Goalard, John A. Dodds
To cite this version:
Laurence Galet, Carol Goalard, John A. Dodds. The importance of surface energy in the dispersion
behaviour of talc particles in aqueous media. Powder Technology, Elsevier, 2009, 190 (1-2), pp.242-246.
�10.1016/j.powtec.2008.04.086�. �hal-01593333�
The importance of surface energy in the dispersion behaviour of talc particles in
aqueous media
Laurence Galet
⁎
, Carol Goalard, John Allan Dodds
Ecole des mines d'Albi-Carmaux, UMR CNRS 2392, Campus Jarlard 81013 Albi cedex 09, FranceA B S T R A C T Keywords: Dispersion kinetics Work of adhesion Talc Surface energy Agitation power Specific area
The dispersion of powders in liquids is an operation used in many industries, which depends on parameters involving both the process (stirring power, temperature and reactor geometry) and the material (the powder, the liquid and the powder/liquid interface). Even though dispersion operations have been the object of several investigations, the importance of the various parameters and especially the physicochemical properties is rarely treated. This paper presents an experimental study of the kinetics of talc dispersion in water based on prior determination of powder properties (particle size, density, surface area and surface free energy), which are used to calculate the different work functions involved in dispersion (adhesion, immersion and spreading). Experiments are presented using an optical fibre sensor to determine the dispersion kinetics of talc in water as a function of stirring power and powder concentration. These results are found to correlate with the energy calculated to be required to cross the liquid–gas interface.
1. Introduction
The literature on dispersion is not extensive. Schubert[1] inves-tigated the subject when considering the instantisation of powdered food products. The wetting of instant powdered milk was studied on the basis of parameters such as the effect of the fat content of the milk on the rate of wetting. The effect of agglomeration was also discussed and related to the change in the wetting characteristics. In previous papers, we have studied the dispersion behaviour of powders (cocoa and talc) and the influence of powder modifications by wet granulation on dispersion[2–4].
A paper published by Buckton[5]on the wetting of a powder by a liquid defined different aspects of the work involved. He divided the process of wetting an individual cubic particle into the following three stages: (1) Adhesion of the powder, which is related to the interaction between the two phases coming into contact. (2) Immersion where the powder particles crosses the vapour/liquid interface. (3) Spreading of the powder through the liquid, which is the detachment of the particle from the interface.
These considerations are used in the study reported here for which talc has been chosen because it is widely used in many industrial sectors such as paper, paints, ceramics, cosmetics and pharmaceutics. Moreover, talc is an insoluble and hydrophobic powder, which is hard to disperse in water. Three samples of talc with different particle sizes have been chosen in order to understand the influence of particle size
and specific area on the kinetics of dispersion and above all on the powder/liquid interactions. After determination of the physical properties of these three talc samples, we present the experimental study of dispersion kinetics and examine influence of stirring power and powder concentration.
2. Materials and methods 2.1. Talc particles
Talc, chemical formula Mg3Si4O10(OH)2, is a hydrated magnesium
sheet silicate with a lamellar structure. Fine talc powders with tight particle size distributions are generally made by jet milling using an integral turbo classifier [6]. As grinding can change the surface properties of particle we have used a single type of talc mined in France (Talc 00 from Talc de Luzenac, France) separated into size fractions by means of an Alpine 50 ATP turbo classifier. The particle size distributions of the talc powders obtained in this way have been determined using a Malvern Mastersizer 2000 (dry dispersion in air), Fig. 1. The true solid density of the powder was obtained using a Micrometrics AccuPyc 1330 helium pycnometer. The BET specific area was determined using a Micromeritics Asap 2010 with argon. Talc properties are collected inTable 1. A SEM picture of Talc 1 is shown in Fig. 2.
2.2. Surface free energy and work of dispersion
As mentioned in the Introduction, it is important to have very good data on the surface properties, and in particular the surface
⁎ Corresponding author.
energy of a powder, to quantify the work necessary to wet the particles. The methods used for this were: Steven's immersion method, sessile drop measurements with an extrapolation using Zisman's method, capillary rise analysed using the Washburn equation, and dynamic vapour sorption (DVS). These methods have shown that the three samples of talc have the same surface energy values, confirming that the separation did not modify the surface properties of the talc[7].
We report here the results of dynamic contact angle measure-ments with pure water (performed with a tensiometer ILMS-GBX). The capillary rise method involves measuring the rate of penetration of liquid into a powder bed. The Poiseuille and Laplace equations are combined to form the Washburn equation:
m2
t ¼C q2gcosh
2g ð1Þ
where: m=mass of liquid (kg), t=time (s), C=constant (m5), q=liquid
density (kg m− 3), g =liquid surface tension (J m− 2), h=contact angle
(°), g=viscosity (Pa s). The surface energies of the liquids used were measured at 20 °C. The liquid mass that penetrated the powder bed as a function of time was recorded using a Kruss K12 tensiometer. The value of the “constant C” is obtained by using a perfectly wetting liquid and the value of cosθ determined from Eq. (1).
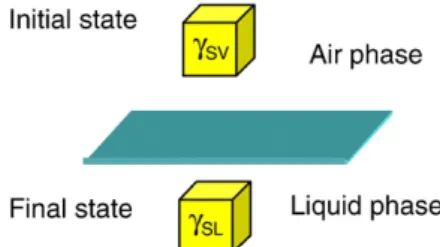
These contact angles are used to calculate the work of dispersion, consisting in the variation of the free energy between the final and the initial states of the talc particles (Fig. 3). Using the Young equation Eq. (2), the work of dispersion WdisEq. (4) depends on the surface tension
of the liquid dispersion and the contact angle between the liquid and the solid. The values of θ and so with the work of dispersion, are identical for the three size of talc (Table 1).
gSV¼ gSLþ gLVcosh ð2Þ
Wdis¼ gSL% gSV ð3Þ
Wdis¼ %gLVcosh ð4Þ
2.3. Measurement of dispersion kinetics
The dispersion experiments of talc powder in water were performed in a 4 baffled stainless steel reactor (15 cm diameter)
with a 6 cm diameter dispersion stirrer. A fibre optic sensor was used to measure the rate of dispersion of talc in water. This device was developed at Polytech'Marseille for the measurement of particle concentrations[8]. The technique is based upon the back-scattering of light by the particles. The fibre optic sensor comprises a bundle of seven fibres. The central fibre brings light from a LED source and the six other fibres are used to detect the backscattered light (Fig. 4). The fibre optic sensor is used in conjunction with a signal conditioner and a PC with Labview® data acquisition software (Fig. 5). The volume analysed by the sensor depends on the suspension concentration, 5 to 10 ml. Preliminary studies show that the position of the sensor in the reactor have no influence on a relative study of the dispersion kinetics. In our experiments the sensor was located 2 cm from the bottom of the reactor. The linearity of sensor response with solid concentration was validated and the sensor calibrated to determine the response to a given concentration of powder. The response when the powder is fully dispersed is required in order to be able to normalise results as fractional dispersion values. The calibration of the captor was therefore made at the maximum stirrer speed. The response obtained from the calibration curve for a given mass concentration powder is considered to be the maximum response for that concentration as the agitation power was at a maximum. This maximum response is referred to as R∞. During the dispersion of the powder in a liquid, the
response of the powder R is merely an arbitrary voltage and must be related to the concentration of dispersed particles if the dispersion profile is to be developed. The extent of dispersion, X(t) is defined as: X tð Þ ¼R tRð Þ
l ¼
C tð Þ
Cl ð5Þ
X tð Þ ¼ A 1 % exp %ktð ð ÞÞ ð6Þ X(t) gives an extent of dispersion based on the response of the powder relative to the theoretical maximum response. The experi-mental curves can be fitted to a two parameter exponential model given in Eq. (6): were k (s− 1) represents the dispersion rate of the
Table 1
Talc samples properties and talc/water interactions Classifier
speed (rpm) d(0.5) (μm)
Density
(g/cm3) Surface area(m2/g) Contactangle (°±1) Work of dispersion(mJ/m2±1.3)
Talc 1 (7000) 13.1 2.79 3.1
Talc 2 (9000) 8.7 2.79 4.5 88 −2,5 Talc 3 (11000) 5.9 2.79 5.2
Fig. 2. SEM photograph of Talc 1.
Fig. 3. The final stage of solid particle is characterised by γSL.
particles at the beginning of the dispersion and A corresponds to the final stage of the dispersion (seeFig. 6). A approaches 1 when all the particles are dispersed in the liquid[3].
The stirrer speed was measured with a tachymeter (Compact Instruments) and the stirrer power dissipated in the liquid was then calculated with Eq. (7)[9,10]: P=Power dissipated (W), Np=Power number (0.5), ρ=Liquid density (kg m− 3), N=Agitation speed (s− 1),
d=Stirrer diameter (m).
P ¼ NpqN3d5 ð7Þ
3. Results and discussion
Experiments on the dispersion rate of the three types of talc powder in water have been made with the operating conditions summarised inTable 2.
At low stirrer powers the dispersion of talc particles was not always complete (A is less than 1). This leads us to work with the k
values for dispersion rate results rather than with the end point parameter A and the time to reach it. The dispersion kinetics of Talc 1 (Fig. 7) show that when higher powder concentrations are used the dispersion is slower. That is, k decreases and the dispersion time increases. The same behaviour is observed with Talc 2 and Talc 3 for all the agitation speeds (curves not shown).
The k values calculated from experimental curves are plotted as a function of the power agitation for the five concentrations of Talc 1 inFig. 8. The comparison between the three talc samples is shown in Fig. 9. The k is smaller for Talc 3 than for the Talc 2 and Talc 1, if comparisons are made at the same stirrer power and at the same concentration. The speed of dispersion decreases when the particle size increases.
The S-shape curves of the dispersion rate k as a function of the stirrer power can be divided into three zones (Fig. 10). Low stirrer powers give a dispersion rate near zero with most of the powder staying at the surface of the liquid. There is hardly any wetting and hardly any dispersion. When the stirrer power is increased, k begins to increase, first slowly from stirrer power given as Pmin, then more
quickly. In the final part of the curve the power reaches a stable k value (kmax). A point can be identified where the tangent at the inflexion
point of the curve cuts the asymptote kmax, at a power called Popt. It is
found that Pmin is constant for all the concentrations and slightly
different for each talc sample.
The study of kmaxas a function of concentration is in the form of a
decreasing exponential. The three talc samples present the same behaviour. Another important point is the optimum stirrer power required for dispersion corresponding to the values of Popt. The
experimental Poptvalues are given inTable 3. For stirrer powers less
than this value, dispersion is less efficient, whereas use of stirrer powers greater than this brings no improvement in dispersion. If we express this stirrer power in terms of solid surface to be wetted, it is possible to see that the optimum power agitation Poptis the same
whatever the talc. Also the higher the talc concentration the greater the surface to be wetted and the greater the power Poptrequired to
reach kmax. There are more particles to disperse, so the power
necessary to disperse them is higher. Talc particles have to be wetted to initiate dispersion and this phenomenon is related to the specific area to be wetted. The greater the surface to be wetted, the greater is the power necessary to disperse talc particles. This relation is shown inFig. 11where the optimum power agitation Poptis plotted versus the
total work of dispersion for the three talc samples. Wtot (mJ) is
calculated with Eq. (8): Wdiswork of dispersion was calculated before
Fig. 4. Schematic view of the optical fibre sensor.
Fig. 5. Schematic view of the experimental set up.
Fig. 6. Experimental kinetic dispersion and its fit with Eq. (6).
Table 2 Experimental conditions Parameters Conditions Powder concentration (%) 0.5 1.0 1.5 2.0 2.5 Agitation power (W) 0.26 0.67 1.51 2.71 4.94 7.60 10.78 15.12 Temperature (°C) 20 Volume of liquid (l) 1
from Eq. (4) (mJ/m2) and the total surface of the talc particles for each
concentration, C, concentration (g/l) and S, specific surface (m2/g):
Wtot¼ Wdisd Cd S ð8Þ
Fig. 11shows a good correspondence between the total work of dispersion and the optimum agitation power. This relation shows that the mechanical agitation necessary to disperse the talc is proportional to the solid surface to be wet by the liquid. In Fig. 12, another representation is made with PoptTotal (W m2), the total optimal
agitation power calculated with Eq. (9):
PoptTotal ¼ Poptd Vd Cd S ð9Þ 4. Conclusion
In this paper, we report an experimental study of the dispersion kinetics of talc in water, using three samples differing only by their specific surface area. The dispersion kinetics have been determined as a function of the mass concentration and as a function of the agitation speed. All the curves can be fitted to an exponential model. From this mathematic model, we determine the characteristic dispersion speed k (s− 1). For each talc, we observe a relation between k and the
agitation power P. We also determine an optimum agitation power Poptfor which the dispersion is complete.
The results show a clear relation between this optimum agitation power and the total work of dispersion Wtot(mJ) calculated from the
surface tension of the water, the dynamic contact angle between the talc and the water and the total surface of the particles. We observe a linear relation between PoptTotal (W m2) the total optimum agitation
power and the work of dispersion Wtot..
This study shows the importance of the total surface of the powder particles to be wetted in a dispersion and suspension process. Further work is underway to study the effect of the surface tension of the liquid phase and thus extend this result. Different solids varying in their
Fig. 7. Dispersion kinetics of Talc 1, Agitation power 0.67 W.
Fig. 8. k (s− 1) parameter for Talc 1 as a function of the power agitation.
Fig. 9. k (s− 1) parameter for Talc 1, Talc 2 and Talc 3 at the concentration of 0.5% as a
function of the power agitation.
Fig. 10. k (s−1) parameter for Talc 1 as a function of the agitation power. Definition of P opt.
Table 3
Popt=Optimum power agitation (W)
Concentration(%) Talc 1 Talc 2 Talc 3
0.5 7.77 7.01 5.67
1 5.35 4.89 4.47
1.5 4.66 3.96 3.86
2 4.05 3.87 3.64
2.5 3.94 3.56 3.52
hydrophilic properties are also being studied to further generalize these observations.
This approach will be important for the formulation and develop-ment of powder preparations.
References
[1] H. Schubert, Instantization of powdered food products, International Chemical Engineering 33 (1) (1993) 28–44.
[2] T.O. Vu, L. Galet, D. Oulahna, J. Fages, Improving the dispersion kinetics of a cocoa powder by size enlargement, Powder Technology 130 (2003) 400–406. [3] L. Galet, T.O. Vu, D. Oulahna, J. Fages, The wetting behaviour and dispersion rate of
cocoa powder in water, Food and bioproducts processing 82 (C4) (2004) 298–303. [4] C. Goalard, A. Samimi, L. Galet, J.A. Dodds, M. Ghadiri, Characterization of the dispersion behaviour of powders in liquids, Particle and Particle Systems Characterization 23 (2006) 154–158.
[5] G. Buckton, Interfacial phenomena in drug delivery and targeting, in: A.T.F.a.G. Gregoriadis (Ed.), Drug Targeting and Delivery, Harwood academic publishers, 1995.
[6] L. Godet, Broyage fin du talc par jet d'air opposés, Doctorat Génie Chimique-Génie des procédés, Institut National Polytechnique de Lorraine (2001).
[7] C. Goalard, Etude physico-chimique du procédé de dispersion des poudres libres et agglomérées en milieu liquide, Doctorat Sciences des Procédés, Génie des Procédés, Institut Polytechnique de Toulouse (2005).
[8] L. Bergougnoux, J.L. Firpo, J. Misghuich-Ripault, Characterization of an optical fiber bunble sensor, Review of scientific instruments 69 (5) (1998) 1985–1990. [9] R. King, Mechanical aspects of mixing, Chapter 13, in: N. Harnby, M.F. Edwards,
A.W. Nienow (Eds.), Mixing in the Process Industries, Second edition, Butter-worth-Heinemann, 1992.
[10] M. Roustan, Agitation Mélange, Caractéristiques des mobiles d'agitation, For-mulaire J 3 8O2, Techniques de l'Ingénieur.