HAL Id: hal-02414437
https://hal.archives-ouvertes.fr/hal-02414437
Submitted on 3 Mar 2020
HAL is a multi-disciplinary open access
archive for the deposit and dissemination of
sci-entific research documents, whether they are
pub-lished or not. The documents may come from
teaching and research institutions in France or
abroad, or from public or private research centers.
L’archive ouverte pluridisciplinaire HAL, est
destinée au dépôt et à la diffusion de documents
scientifiques de niveau recherche, publiés ou non,
émanant des établissements d’enseignement et de
recherche français ou étrangers, des laboratoires
publics ou privés.
Experimental and numerical thermo-mechanical analysis
of the influence of thermoplastic slabs installation on the
assessment of their fire hazard
Chloé Vincent, Stéphane Corn, Claire Longuet, Laurent Aprin, Guillaume
Rambaud, Laurent Ferry
To cite this version:
Chloé Vincent, Stéphane Corn, Claire Longuet, Laurent Aprin, Guillaume Rambaud, et al..
Ex-perimental and numerical thermo-mechanical analysis of the influence of thermoplastic slabs
instal-lation on the assessment of their fire hazard. Fire Safety Journal, Elsevier, 2019, 108, pp.102850.
�10.1016/j.firesaf.2019.102850�. �hal-02414437�
Experimental and numerical thermo-mechanical analysis of the influence of
thermoplastic slabs installation on the assessment of their fire hazard
Chloë Vincent
a, Stéphane Corn
a,∗, Claire Longuet
a, Laurent Aprin
a, Guillaume Rambaud
b,
Laurent Ferry
aaIMT Mines Alès, 6 Avenue de Clavières, F-30319, Alès, France bCEA, DAM, GRAMAT, F-46500, Gramat, France
Keywords: Fire behavior PMMA Thermo-mechanical analysis Slump Collapse
Finite element simulation A B S T R A C T
This work aims at determining the influence of orientation and dimensions of structural samples on the mea-surement of their burning properties and therefore on the assessment of fire hazard. Poly (methylmethacrylate) (PMMA) slabs are tested thanks to a new experimental setup specially designed to study the combustion of large samples exposed to medium to high radiative heat fluxes. The experimental results evidence a relation between the heat release rate (HRR) and structural phenomena such as mechanical instability, slump, collapse and material flow. The understanding of the dimensions-behavior relationship is completed by finite element si-mulations of the conducted experiments. The thermo-mechanical sisi-mulations consist in the sequence of a transient thermal computation up to a given heating time followed by an eigen buckling calculation, all en-capsulated in a parametric study of that heating time. The evolution of the buckling critical load factor as a function of heating time allows predicting for samples of different sizes the time needed to buckle. These si-mulations corroborate the experimental results, namely that buckling occurs sooner for thin or large samples, which elucidates the discrepancies between the fire response assessed in vertical and horizontal sample or-ientations.
1. Introduction
Thermoplastic polymers are widely used in industry and everyday life, e.g., in furniture, interior decoration. Being combustible materials, they contribute to the fire hazard. The vertical configuration of plastic items is recognized to emphasize hazard by increasing the burning rate [1,2]. Most studies about the burning of vertically oriented slabs have concerned PMMA (poly (methylmethacrylate)) because it exhibits a non-charring (complete) combustion, which can be considered as a well-known and simple decomposition mechanism. A lot of attention was paid to flame spread and the influence of sample geometry (thickness, width, leading edge) was studied in downward [3,4] or upward [5–7] configuration. Correlations were established between flame spread rate [8,9] or flame height and heat flux [8,9]. More re-cently, Pizzo et al. [10] studied the combustion of thick clear PMMA slab in vertical position. Most of these studies were performed with relatively thick samples of PMMA. However, the thickness of sample has an influence on the burning kinetics. Paul [11] performed studies with vertical PMMA sample on cone calorimeter and showed the effect of thickness on the heat release rate. As the sample thickness is
increased, the kinetics was slowed down and approached that of a steady-state burning. Vovelle et al. [12] tested five thicknesses (0.6, 1.0, 1.5, 3.0 and 5.0 cm) of PMMA samples on Tewarson calorimeter and showed that the rear face temperature variation is strongly dependent on the thickness of the specimens. The other important geometric parameter studied by Pizzo et al. [6] was the width of PMMA slab. They measured the local burning rate of vertical slabs with an experimental video technique. They showed that the local steady-state burning is not width-dependent for slabs of width greater or equal than 5 cm. For widths below 5 cm the local burning rate increased with the width due to an increase of the net heat feedback.
Upon heating, thermoplastics exhibit the specific feature to evolve from an elastic solid at room temperature to a low viscosity liquid at pyrolysis temperature. Glass transition and melting temperatures are known to be the key parameters for this evolution. In the event of a fire and especially in vertical configuration, the viscoelastic behavior of thermoplastic polymers is likely to induce phenomena such as bubbling and dripping that may interfere with the burning behavior and thus modify the fire growth. Zhang et al. [13] showed that the melting be-havior significantly affects upward flame spread since a pool of melt
∗Corresponding author. IMT Mines Alès, Centre des Matériaux des Mines d'Alès, 6 avenue de Clavières, F-30319, Alès, France.
E-mail address:stephane.corn@mines-ales.fr(S. Corn).
The purpose of radiative fluxmeters is to detect infrared radiation emitted by a surface. For measuring radiative heat fluxes, CAPTEC brand radiative fluxmeters were used. Their sensitivity of these
fluxmeters was 13.3 μV(W−1 m−2).
A calibration test was performed on RAPACES to check that the distribution of the heat flux received by the sample was nearly homo-geneous: for a surface of 40 × 40 cm2, the heat fluxes were measured
between 78 and 82 kW/m2 for a radiant panel set at 100% of the
nominal intensity (Fig. 2).
Type K thermocouples were used for measuring the surface tem-perature. These thermocouples can measure temperatures as high as 1200 °C. The objective consisted of correlating the variation of the temperature gradient with the sample thickness.
The mass loss was monitored as a function of time (measurement frequency 0.1 s) using a KERN weighing scale (0–20 kg ± 0.05 g).
A SERVOMEX 4100 series gas analyzer quantified the concentra-tions of O2, CO2and CO during the combustion of the material. This
device is used to determine the heat release rate of the material (de-noted HRR).
To study more accurately the slumping kinetics, sample slump was caught by video camera and further analyzed. Since slump was ob-served to be relatively homogeneous along the sample width, it was decided to define the slump rate SR(t) at a given time t as:
=
SR t h h t
h
( ) 0 ( )
0 (1)
Where h(t) is the sample height at time t and h0the initial height.
During the tests with RAPACES, sample orientation was vertical, facing heat source. The sample is a homogeneous square plate of PMMA side (height) h and thickness e. The beginning of the PMMA slab slump is noted by the user. The onset time of the slump is taken when the sample is reduced by 0.5 cm high.
2.3. Materials
Experimental measurements were conducted with PMMA. According to Bal and Rein [22], PMMA is an interesting material for investigating the combustion of a solid. Many experimental data, nu-merical studies and properties are listed in the literature [23–25]. PMMA used in this study is an Altuglas® clear PMMA grade (supplied by AbaquePlast, France), it does not contain any flame retardant and the thermophysical properties (Table 1) were determined experimentally in laboratory.
Fire tests were carried out with three area samples (100, 400 and 1600 cm2) with four thicknesses (2, 4, 10 and 20 mm) PMMA samples.
Samples were placed in vertical orientation and the radiative heat flux of RAPACES was set to 50 kW/m2. The repeatability of the analysis was
tested by duplication of measurements samples (Figure AM 1 in the Additional material section).
3. Results and discussion
3.1. Experimental results 3.1.1. Fire behavior1
Fig. 3shows that the fire test can be decomposed in six steps. At the beginning, the PMMA slab (represented by a dotted blue square) is positioned in the sample holder (Step 1). Before ignition, the rising temperature generates a structural instability of sample leading to its warping as shown by the variations of light reflection (see Step 2). Thereafter, PMMA starts bubbling (Step 3). When fuel volume and temperature reach the adequate conditions, piloted ignition occurs at the top of the plate (Step 4) and progressively propagates down to the
1Definition of different terms used in this part: Melting is the transition to the
liquid state (viscous). Dripping is the presence of liquid droplets that fall down from the sample - Collapse is to fall down suddenly - Slump is to collapse heavily
was formed at the bottom of a vertical burning slab. Sherratt [14] studied the effect of the flow behavior of the thermoplastic melt on the dynamics of fire growth. The study showed that a PMMA slab burnt in vertical position exhibits a dripping that generates a pool fire. The fire growth seems to be largely controlled by the pool that is fed by two mechanisms: dripping and slumping. Xie et al. [15] investigated the effect o f t hickness o n t he c ombustion b ehavior o f t wo thermoplastic polymers (polypropylene and polystyrene). They concluded that the pool fires of thinner sheets develop faster than those of thicker ones. Ohlemiller et al. [16] investigated also the fire behavior of vertical slabs of thermoplastics exposed to a constant heat flux. They modeled the mass loss due to the melting and gasification. A similar approach was carried out by Zhang et al. [17]. Butler et al. [18] developed an ex-perimental method to extrapolate viscosity of thermoplastic polymers at high temperatures and used these values in a numerical model able to simulate dripping. Besides, there have been few studies about the in-fluence o f slumping o n fi re re sponse. Krämer et al. [1 9] studied the structural collapse of flexible p olyurethane f oam s lab d uring a hor-izontal burning test in cone calorimeter. For this test, the collapse oc-curred in a thin layer formed at the sample surface due to the limited heat conduction into the foam.
The objective of this work consists of understanding the influence of the dimensions of vertically oriented PMMA slabs on their burning behavior. The fire response was assessed in terms of ignition time, mass loss rate and heat release rate. A particular attention was paid to the influence o f t he p olymer c ollapsing o n i ts g lobal fi re be havior. The collapsing was experimentally monitored thanks to a video analysis while thermal data were logged. The Finite Element Model developed in Comsol Multiphysics® software allows simulating the fire response of a vertically oriented PMMA slab. Both the thermal and mechanical physics are solved together. Numerical results evidence the relationship between the heat propagation in the specimen and its mechanical buckling caused by the loss of rigidity of the material.
2. Description of experiments
2.1. Experimental setup
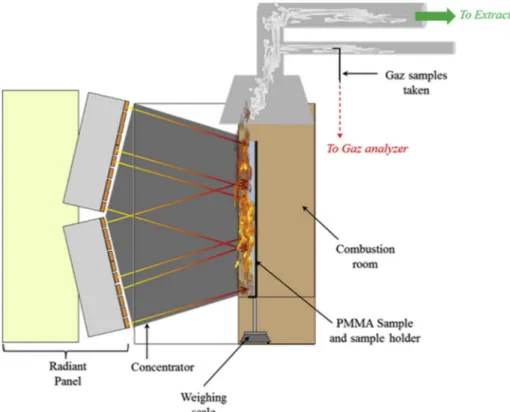
A novel experimental device was designed at IMT Mines Alès to study the combustion of large samples exposed to radiative heat fluxes up to 80 kW/m2. Fig. 1 gives a schematic representation of this setup
[20]. The radiative source consists of two 60 kW panels with a total emitting surface of 1 m2 corresponding to a maximum emitted heat flux
of120 ± 2 kW/m2. Each panel is equipped with a series of 3 kW
short-wave infrared (IR) tungsten lamps with a color temperature of 2400 K with a maximum radiation near 1.2 μm. The lamp spectrum varies in a range between 0.5 μm (visible) to 4.5 μm (far IR) and depends on the relative intensity of radiant panel. Panels are slightly titled from the vertical (13°) to focus the radiative heat flux o n t he vertical sample located at 80 cm from the source. Four polished stainless steel plates constitute a tunnel between the source and samples to radiative heat flux f rom s ource t o s ample l ocation. T he c ombination o f t he con-centrator with the radiant panel provides a new device: RAPACES (RAdiant PAnel Concentrator Experimental Setup) [20,21].
2.2. Experimental devices
Fire testing is analyzed in two modes, (i) observation and (ii) more quantitative characterization. The observation is a qualitative char-acterization; it allows visualizing the state of progress of thermal de-gradation (gas bubbles formation, release of fuel vapors, slump of PMMA …). For the quantitative characterizations, fluxmeter, thermo-couples, weighing scale and gas analyzer were used.
bottom. Then, the decrease of the material stiffness is so huge that the plate collapses under its own weight (Step 5). In last step, the viscosity of PMMA becomes so low and it flows in the receptacle positioned under the slab (Step 6). This phenomenon leads to a pool fire con-comitantly with the burning of the collapsed plate. Fire continues until fuel depletion.
The next part of the paper focuses on the effect of variation of geometric parameters (surface area and thickness of the sample) causes
a change in fire behavior of PMMA slabs.
3.1.1.1. Effect of sample surface area. Fig. 4 presents the heat release rate (HRR) curves of three PMMA samples with the same thickness (i.e. 4 mm) and various surface areas (i.e. 100, 400 and 1600 cm2) exposed
to 50 kW/m2. In those experiments, piloted ignition is initiated at the
top of the sample (the igniter location was kept constant). Results show that sample surface area has no significant influence on PMMA ignition time. Whatever the surface exposed to the radiative source, the ignition time of transparent PMMA was 75 s ± 2 s.
After ignition, HRR curves exhibit a single peak of high intensity typical of a non-flame retarded polymer.
A first difference associated to sample surface area lies in the slope of the HRR curve before the peak. This effect seems to be linked to flame propagation. The flame of the small sample (100 cm2) spreads
instantaneously over the whole sample surface while flames takes ap-proximately 30 s to spread over the entire material for the two other (Figure AM 2 in the Additional material section).
The second difference between smaller and larger samples is the magnitude of their HRR peak. For 100 cm2and 400 cm2samples, the
magnitude of the HRR peak is 976 kW/m2± 40 kW/m2 while, for
1600 cm2, it is 24% lower. This difference may be attributed to PMMA
collapse. Indeed, for small samples, a progressive and slow slump is observed that is to say, the surface exposed to the radiative source is gradually reduced. On the opposite hand the 1600 cm2sample suddenly
collapses. In less than 30 s, the surface exposed to IR lamps goes from 1600 cm2to 250 cm2, which may influence the maximum of heat
re-lease.
The last difference concerns the end of the combustion. The inter-pretation of this last step is still not clear, however, it was remarked that during this period PMMA flows in the form of droplets in the re-ceptacle placed below. The flow is more important for large samples, particularly due to their weight. By contrast, the percentage of residue ξ is equal to 0%, which means that the combustion of PMMA remains complete.
Fig. 1. Schematic representation of RAPACES (side view).
Fig. 2. Distribution map of heat flux received by the sample. Table 1
Set of experimental and numerical parameters values for clear PMMA.
Parameters Values
Density, ρ (kg/m3) 1190 (manufacturer data)
Average molecular weight, M (g/mol) 3 000 000 [26] Glass transition temperature, Tg(°C) (DSC)
115 (DMA)135
Thermal conductivity, k (W/m.K) 0.20
3.1.1.2. Effect of sample thickness. Fig. 5 shows the HRR curves of 100 cm2PMMA samples exhibiting various thicknesses, i.e. 2, 4, 10 and
20 mm submitted to a 50 kW/m2heat flux. It can be observed that thin
samples degrade faster than thicker ones. It is also observed that thick samples exhibit a lower HRR peak than thin samples.
Paul [11] studied the effect of sample thicknesses (from 1.5 mm to 25 mm) on the shape of the HRR curve. The study showed that very thin samples (1.5 mm and 3 mm) exhibit a very fast burning kinetics with high HRR peaks. When the thickness increases, burning velocity de-creases. For the 20 mm thick sample, a steady state burning occurs as proved by the HRR plateau between 300 and 1000 s.
A second effect of thickness is the speed of PMMA slab slump. Hence, for thin samples, the PMMA slab slump takes place quickly and the sample flows as droplets in the receptacle. By contrast, for thick
samples, the PMMA slab slump occurs later in the test and the sample does not flow.
3.1.2. Temperature
Fig. 6shows the evolution of front (exposed face) and rear (un-exposed face) temperatures of PMMA sheets before the ignition. The increase rate of temperature at the unexposed face is higher for thinner samples, because the heat transfer from the exposed face is shorter in that case.
3.1.3. Slump
3.1.3.1. Effect of sample surface area. Fig. 7shows the slump of PMMA samples of two surface areas (100 cm2 and 1600 cm2) for a given
thickness of 4 mm. The slump rate (SR) was determined according to equation(1). As an example, after 120 s of testing, a 10 cm high sample
Fig. 3. Steps of PMMA degradation during a fire test.
has a SR of 0% while for a large sample, a SR of 73% is observed as shown inFig. 7.
Fig. 8 shows the kinetics of PMMA sample slump for the three chosen sample surface areas. For this, the slump rate was plotted in function of time and compared with the heat release rate. For each sample surface area, the slump starts just before the HRR peak, i.e. long time before flameout. It can be noticed that slump occurs after a shorter period of time for large surface area samples. Moreover, in the latter case, slump occurs very suddenly. In all cases, the SR curve exhibits two zones, which are particularly obvious for the 1600 cm2sample. In a first
step the plate slumps brutally loosing circa 80% of its height. The second step corresponds to a slower decrease of sample height until the
end of combustion. For the 100 and 400 cm2samples, this second step
emerges as a shoulder at the end of the curve. It was remarked that the second step begins when the sample starts dripping. The times taken for the beginning of the second step for the 100, 400 and 1600 cm2samples
are 125, 152 and 165 s respectively. Thus, it may be assumed that there is an influence of slump upon polymer dripping. Therefore, it can be concluded that slump (i) is largely affected by the sample surface area and (ii) has a significant impact on the burning rate.
3.1.3.2. Effect of sample thickness. Figure AM 3 (in the Additional
material section) presents photographs of 2 mm and 20 mm thickness PMMA sheets, sandwiched between two metal grids, 50 s after their inflammation. The 2 mm thick plate has already slumped and there is only 50% of surface exposed to the radiative source. Regarding the 20 mm thick plate, 100% of the surface is still exposed to the radiative source, since PMMA sheet has not yet slumped at that time.
Fig. 9shows that the time marking the onset of PMMA slab slump exhibits a monotonic but non-linear increasing trend according to the material thickness. It should be noted that, for the thickest sample, the decrease of the rigidity specimen is concomitant with a partial melting of the exposed polymer surface. In this case, both phenomena may af-fect the beginning of slump. To evaluate the efaf-fect of the slump in the combustion dynamics, the time to HRR peak was also shown inFig. 9. Slump always starts before the HRR peak, regardless of the thickness. Moreover, as mentioned above, the slump of thin samples is faster than that of thick samples. Given the surface variation observed during the slump, it appears obvious that this phenomenon plays a role in the combustion dynamics of material and in particular in the magnitude of the HRR peak.
3.1.3.3. Effect of sample orientation. In the previous section, it was
surmised that slab slump plays an important role in the burning rate of vertically oriented slabs. To verify the hypothesis, the comparison between vertical and horizontal configurations of sample was necessary. Fig. 10 presents the HRR curves for vertically and horizontally oriented PMMA samples with two different sample surface areas (100 cm2and 400 cm2) and the same thickness (2 mm).
The results show that a PMMA sheet which burns in horizontal position and thus cannot undergo slump, exhibits a significantly higher HRR peak. Besides, in vertical position the dynamics of fire growth seems to be largely controlled by the collapse and the dripping. This phenomenon seems to be emphasized with increasing sample surface area. For a vertically oriented 400 cm2surface area slab, the sample
burns 1.5 times longer than a horizontally oriented sample. Moreover, the HRR peak is 35% higher in a horizontal test (for a surface area equal to 400 cm2). The other parameter evaluated is the FIGRA (FIre Growth Fig. 6. Monitoring of front and rear temperatures for three different thicknesses
samples.
Fig. 7. Pictures of PMMA slump for two different surface areas of sample after
120 s of testing.
Fig. 8. Monitoring of PMMA slump for three different sample surface areas and
comparison with HRR curves.
Fig. 9. Relation between the sample thickness, the beginning of PMMA slump
RAte) index, which quantifies the acceleration of energy production. It is defined as the maximum value of the function (HRR/elapsed time of the test).
According to EN 13501–1 [27], the higher the FIGRA index, the greater the risk. It is therefore observed that understanding the phe-nomenon of PMMA slump is essential since this phephe-nomenon affects the FIGRA index, particularly for large sample surfaces (400 cm2). In
ver-tical orientation, the FIGRA is 4.8 kW/m2. s whereas in horizontal
or-ientation, this index is equal to 6.8 kW/s, a difference of about 30%. The last parameter tested is the MARHE (Maximum Average Rate of Heat Emission) corresponding to the average value of the HRR. This index shows once again the interest of understanding the phenomenon of subsidence of PMMA since for a surface area of 400 cm2, a difference
of 24% is noted between the two orientations. The preceding results highlight that sample in vertical orientation exhibit lower FIGRA and MARHE. This can be attributed to the fact that, for a given thickness, high surface area samples are more sensitive to slumping and this phenomenon tends to reduce HRR as it occurs. Furthermore, the Total Heat Release (THR) is not impact by the variation of sample config-uration. All data are presented in supporting material (Table AM 1 in the Additional material section). Therefore, these comparisons confirm that the slump of PMMA slab induces an effect on the combustion ki-netics.
3.2. Simulation results
Regarding the supposed influence of slump on the burning rate of PMMA samples, an attempt was made to simulate their thermo-me-chanical response. However, slump that occurred in the experiments is a complex phenomenon that combines elastic instability (buckling), large mechanical deformations and viscous solid-liquid modifications (dripping). Indeed, during a fire test with RAPACES a part of the in-cident heat flux is absorbed by the polymer causing an increase of the sample temperature. When a polymeric material overcomes its glass transition temperature Tg, a rheological change that results in a drastic
loss of its mechanical rigidity is observed. In this so-called rubbery state, the polymer exhibits a greater deformation capacity under me-chanical loading. A vertical slender structure (such as a plate or a beam) submitted to its own weight may buckle when its rigidity decreases and reaches a critical value. An example of buckling is shown schematically in Figure AM 4 (in the Additional material section).
The proposed hypothesis is that slump observed during burning was initiated by the buckling of the plate under its own weight, i.e. an elastic instability in compression that triggers significant flexural de-flection, and therefore the following analyses focuses on the calculation of buckling for the tested plates.
To achieve the calculations, two approaches were conducted based on (i) a preliminary analytical model and (ii) a numerical finite ele-ments model.
3.2.1. Analytical approach
First, the critical elastic modulus value Ecleading to the buckling of
the plate was determined by a preliminary analytical approach, as-suming that the elastic modulus of the material is homogeneous throughout the volume of the plate. In this model, the square plate is considered as a vertical homogeneous beam of rectangular cross-section (whose width to thickness ratio is high) with its lower end being clamped. For a cantilever beam submitted to an axial compressive load per unit length p, the classical Euler's theory for buckling [ [28]], [ [29]] provides the following expression of critical load per unit length
pc:
=
p EI
h
c 3 (2)
with E is the elastic modulus (N/m2or Pa), I the beam cross-section
second moment of area (m4), h the beam height (m) and β = 7.837 is a
constant value (first positive root of the Bessel function involved in the resolution of Euler's differential equation) [ [28]].
In the case of a vertical beam submitted to its own weight, the load per unit length is ρgS, with ρ the density of the material (kg/m3), g the
acceleration of gravity (9.81 m/s2), and S the beam cross-section area.
Moreover, for a beam of rectangular cross-section of thickness e (m), Equation (2)leads to the following expression of the critical elastic modulus Ec, which is the value of the elastic modulus such as the weight
per unit length ρgS meets the critical load per unit length pc:
= E g h e 1.53 C 3 2 (3)
Within the validity of this approach, a vertical plate having its elastic modulus E lower than Ecshould buckle under its own weight.
Equation(3)is useful to bring to the fore the influence of the dimen-sions and density of the plate and confirms that the rigidity required to maintain the stability of the plate increases with its height and de-creases with its thickness.
Table 2summarizes the results for Ecvalues according to Equation
(3). Unsurprisingly, it confirms that all the samples stand mechanically stable before heating, because Ecis found for each geometry to be much
lower than the elastic modulus of PMMA (3 GPa at 20 °C, manufacturer data). Knowing that PMMA elastic modulus decreases with increasing temperature,Table 2highlights that higher samples or thinner ones are likely to buckle sooner during the fire test than the shorter ones since they require a higher critical elastic modulus to stand stable. Thus, when a high or thin sample will be heated it will reach this critical value within a shorter period.
This preliminary approach enables estimating the propensity of vertical plates to buckling according to their height and thickness. However, due to radiating conditions, it is expected that the tempera-ture within the sample submitted to heating is non-homogeneous and thus the elastic modulus. Therefore, for a better description of slump it is relevant to consider a thermo-mechanical coupled problem. Because
Fig. 10. Comparison of HRR curves when the sample is oriented horizontally or
vertically for two sample surface areas (100 cm2and 400 cm2).
Table 2
Summary of calculated Ecvalues depending on sample thickness and sample
height.
For sample height = 10 cm For sample thickness = 4 mm
Thickness (mm) Ec(MPa) Height (cm) Ec(MPa)
2 4.50 10 1.10
4 1.10 20 7.90
10 0.18 40 63.5
m.K.
In order to account of the possible thermal variations through the thickness of the sample, a parallelepiped volume was considered and meshed. Hexahedral elements based on quadratic interpolation were used. The quality of the mesh and its fineness were set so that they had no significant influence on the accuracy of the numerical results. Because of the possible temperature gradient, the number of elements through the thickness was carefully evaluated: numerical simulations conducted for a 100 × 100 × 10mm “thick” plate with successive me-shes having 2, 4 and 6 elements through the thickness led to less than 3% difference between the buckling times computed with the two finest meshes, which validated the choice of a 4 elements through the thickness mesh (exhibiting a total of 3664 elements) for all the simu-lations.
3.2.2.2. Heat transfer simulation. In order to compute the temperature
distribution inside the plate (Fig. 6), transient simulations were performed using the “Heat Transfer” module of Comsol Multiphysics®. It can be seen onFig. 11that simulated evolutions of front and rear temperatures over time are in very good agreement with the corre-sponding temperatures measured during tests in RAPACES (Fig. 6). Given the good correlation between experiment and simulation for surface temperatures (Figure AM 6 in the Additional material section), we allow ourselves to extract the simulated temperature gradients within the thickness for the three thicknesses tested and it was not necessary to include evolution of thermo-physical properties of PMMA in the simulation. Fig. 11, which shows the variation of temperature from the center point of the front face to the center point of the back face, confirms that the 4 and 10 mm thick samples can be considered as thermally thick since at time-to-ignition. A lower temperature gradient is found for 2 mm thick compared to other thicknesses. The temperature
at the rear face has increased at time-to ignition it means that the as-sumption of semi-infinite medium is not respected.
In the following, temperature gradients within the thickness will be used as input data of thermo-mechanical simulation with the aim to model the PMMA slump according surface area and thickness of sample.
3.2.2.3. Thermo-mechanical modeling. The thermo-mechanical modeling developed for this study in Comsol Multiphysics® extends the analytical approach: the objective consists in taking into account the heterogeneity of the elastic modulus inside the plate, which is due to the local variations of the temperature during the test. The inputs of the finite element model, including the geometric features and the mesh definition, are based on the foregoing heat transfer simulation. The main output of this simulation is the assessment of the heating time that leads to the mechanical instability (i.e. the buckling) of the sample during the fire test.
The key input data in this simulation is the sensitivity of the local elastic modulus of PMMA to the temperature. In order to acquire this data, a Dynamic Mechanical Thermal Analysis was conducted with a Metravib DMA50 testing machine. For this, a rectangular PMMA sample (30 × 9.73 × 3.72 mm) was measured in the tension/com-pression mode at the frequency of 1 Hz and a heating ramp of 1 °C/min was applied up to 300 °C (maximum temperature of the testing ma-chine). The evolution of E' (storage elastic modulus) as a function of temperature is shown in Figure AM 7 (in the Additional material sec-tion).
In view of this DMA curve, four zones are observed:
- Between 80 °C and 105 °C, the polymer is in the glassy state and therefore its elastic modulus is high (1 GPa).
- Between 105 °C and 145 °C, a drastic drop of the elastic modulus (from 109Pa to 3.106Pa) is observed. This corresponds to the glass
transition temperature of the polymer (i.e., 120 °C).
- Between 145 °C and 250 °C, the polymer becomes flexible, it is the rubbery plateau. The length of the plateau depends on the number of entanglements per macromolecule [32–35]. The studied PMMA has a high molecular weight, which justifies that the rubbery pla-teau is particularly long.
- Between 250 °C and 280 °C, the elastic modulus of PMMA decreases significantly. This terminal zone corresponds to the beginning of PMMA flows (viscous fluid behavior).
This evolution of the elastic modulus according to temperature is inserted in the mechanical model as an explicit function. The me-chanical physics of the model is completed by setting the gravity as a vertical volumic force, the lower edge of the volume being clamped.
The strategy chosen for this thermo-mechanical simulation consists in performing a transient thermal computation up to a given heating time, followed by a calculation of linear buckling, encapsulated in a
Fig. 11. Temperature gradients simulation for three thicknesses tested.
of the complexity induced by the coupled physics and the transient effects, the second approach uses a finite element analysis, which was conducted with the Comsol Multiphysics® software.
3.2.2. Approach by finite element analysis
3.2.2.1. Parameters of the numerical model. The thermal conditions of
the numerical model performed with Comsol Multiphysics®, which comply with the real conditions of a RAPACES test, are exposed in Figure AM 5 (in the Additional material section). All the faces of the plate are diffusive with an emissivity set at 0.86 (manufacturer data). Convection is considered on all sides with a convection coefficient
hc = 10 W/m2. K (data commonly used for a vertical wall with a natural
flow o f a ir a nd w ith t emperatures c lose t o t he a mbient temperature (300 K) [30,31]. The front face of the PMMA plate is exposed to a constant heat flux (50 kW/m2), and the rear face is not insulated. The
temperature of the external environment is set at 25 °C. Thermophysical parameters of PMMA considered in the simulation, which were measured in laboratory, are set by the user: densityρ = 1190 kg/m3;
parametric study of that heating time. Modeling is achieved using an elastic behavior because the objective is to simulate the beginning of slumping that occurs well before polymer flow and dripping. Moreover, the evolution of the elastic modulus with temperature is taken into account.
The finite element approach, unlike the analytical approach, con-siders a possibly heterogeneous distribution of the elastic modulus within the thickness of the sample by integrating in the numerical si-mulation its dependence on the local temperature calculated at any point of the volume.
The problem of linear buckling in finite element analysis is solved in two steps. Firstly, a linear static analysis of the plate submitted to its own weight is carried out to calculate a pre-stressed reference state. Let
P0be the corresponding set of nodal loads, and Pc= λ P0the critical
load state to calculate, where λ is a scalar multiplier. The total stiffness matrix K for the full geometrically nonlinear problem can be considered as a sum of two contributions. One is the ordinary stiffness matrix of the linear problem, KL, and the second is a nonlinear addition, KNL, which is
approximated to be proportional to the load, so that (Eq 4):
= +
K KL KNL( )P0 (4)
The buckling modes are then calculated in a second step by solving the eigenvalue problem formed by the homogenous equation (Eq 5):
+ =
K K P x
( L NL( ))0 0 (5)
The solutions of (5) are a series of eigenvalues λ and the corre-sponding eigenvectors x. The lowest positive eigenvalue, named the critical load factor (CLF), thus corresponds to the ratio between the buckling load and the reference load. Accordingly, the structure would buckle under its own weight if the eigenvalue problem results in a value of the CLF lower than or equal to 1. Besides, the eigenvector x asso-ciated to the CLF informs about the nature of the buckling deformation, which proved to be a flexural deformation for each simulation carried out in that study.
Fig. 12shows the evolution of CLF as a function of the heating time for the three tested thicknesses (for a 10 cm square plate) and for the three tested surface areas (for a 4 mm thickness). Expectedly, the CLF decreases with the heating time, starting with CLF values greater than 1 for each geometry which reflects their initial mechanical stability. The buckling is supposed to occur when the CLF reaches 1 (i.e., when log CLF = 0), which is highlighted by the dashed lines inFig. 12.
These thermo-mechanical simulations confirmed that the more the sample is thin or large the sooner the buckling occurs.
Fig. 13compares the experimental and simulated times for which the sample slump is likely to occur. Through the correlation is not perfect experimental values and simulation results should similar trends, despite their correlation is not perfect. Indeed, the simulation underestimates the beginning of the PMMA slump. For the 2 and 4 mm thick samples, experimental values correlate fairly well with the si-mulated ones. In contrast, for the 10 mm thick sample, the model overestimates the slump time of PMMA. This could be due to the temperature rise in the closed combustion chamber of RAPACES under these particular conditions: the test is very long (> 1000s), which, in turn, would alter the rear temperature compared to that set in the model. Thus, this temperature increase may decrease faster the rigidity of the PMMA plate and actually make it buckle sooner than expected by simulation. The present model is a first approach and its limitations are the evolution of Cp, k, ρ as a function of temperature, the material
viscosity, the temperature of the combustion chamber, the flame ra-diation, the development of the boundary layer and the spectral char-acteristics.
4. Conclusions
In this work, the influence of sample dimensions (thickness and surface area) on the combustion of vertically oriented clear PMMA slabs was investigated using a new experimental device called RAPACES. It was shown that time-to-ignition was only affected by sample thickness.
Fig. 12. Time evolution of the buckling coefficient for (a) the different thicknesses (with S = 100 cm2) and (b) the different samples surface areas (with e = 4 mm).
Fig. 13. Comparison between experimental and simulated PMMA plate collapsing times for (a) the different thicknesses (for a 10 cm square plate) and (b) the
was completed using the Comsol Multiphysics® finite elements soft-ware. The thermo-mechanical simulations confirmed that the more the sample is thin or large the sooner the buckling occurs. This model proposes a simplified view of the test and does not take into account a number of phenomena such as (i) the material heating by the flame beyond the ignition time, (ii) the dripping of the polymer and (iii) the heating of the combustion chamber. However, it is a first step in the simulation of the material slump and the evaluation of its influence on the combustion dynamics. As a perspective of this study, the modeling of the post-buckling response could be addressed by a non-linear structural analysis that takes into account the large mechanical strains and the coupling with fire behavior.
Acknowledgments
The authors are grateful to the French Alternative Energies and Atomic Energy Commission for the financial support and helpful col-laboration on this research program. Authors are also thankful to the technicians of IMT Mines Alès for technical aid during the development of RAPACES apparatus.
Supplementary data to this article can be found online athttps://doi.org/10.1016/j.firesaf.2019.102850.
Nomenclature
Letter Description Unit
CLF Critical Load Factor
Cp Specific heat J/kg.K
SR(t) Slump rate %
DMA Dynamic Mechanical Analysis
e Thickness m
E′ Storage elastic modulus Pa
Ec Critical elastic modulus Pa
FIGRA Fire Growth Rate index kW/m2.s
g Acceleration of gravity m2/s
HRR Heat release rate kW/m2
hc Convection coefficient W/m2.K
h0 Initial sample height m
h(t) Sample height m
IR Infrared
k Thermal conductivity W/m.K
K Stiffness matrix of the structure
Kc Geometric stiffness matrix
M Average molecular weight g/mol
MARHE Maximum Average Rate of Heat Emission kW/m2
PMMA Polymethylmethacrylate
RAPACES Radiant Panel Concentrator Experimental Setup
S Surface m2
Tg Glass transition temperature °C
Greek letter Description Unit
λ Multiplier of the reference load
ρ Density kg/m3
ξ Residue %
References
[1] K. Tsai, Orientation effect on cone calorimeter test results to assess fire hazard of materials, J. Hazard Mater. 172 (2009) 763–772.
[2] Q. Xie, R. Tu, N. Wang, X. Ma, X. Jiang, Experimental study on flowing burning behaviors of a pool fire with dripping of melted thermoplastics, J. Hazard Mater. 267 (Feb. 2014) 48–54.
[3] M.B. Ayani, J. a. Esfahani, R. Mehrabian, Downward flame spread over PMMA sheets in quiescent air: experimental and theoretical studies, Fire Saf. J. 41 (2) (Mar. 2006) 164–169.
[4] J. Gong, X. Zhou, J. Li, L. Yang, Effect of finite dimension on downward flame spread over PMMA slabs: experimental and theoretical study, Int. J. Heat Mass Transf. 91 (Dec. 2015) 225–234.
[5] J.L. Consalvi, Y. Pizzo, B. Porterie, J.L. Torero, On the flame height definition for upward flame spread, Fire Saf. J. 42 (5) (2007) 384–392.
[6] Y. Pizzo, et al., Experimental observations on the steady-state burning rate of a vertically oriented PMMA slab, Combust. Flame 152 (3) (Feb. 2008) 451–460. [7] Y. Pizzo, J.L. Consalvi, P. Querre, M. Coutin, B. Porterie, Width effects on the early
stage of upward flame spread over PMMA slabs: experimental observations, Fire Saf. J. 44 (3) (2009) 407–414.
[8] Y. Hasemi, Thermal modeling of upward wall flame spread, Fire Saf. Sci. 1 (1986) 87–96.
[9] J. Quintiere, M. Harkleroad, Y. Hasemi, Wall flames and implications for upward flame spread, Combust. Sci. Technol. 48 (3–4) (Jul. 1986) 191–222.
[10] Y. Pizzo, et al., Steady and transient pyrolysis of thick clear PMMA slabs, Combust. Flame 162 (1) (2015) 226–236.
[11] K. Paul, Cone calorimeter : initial experiences of calibration and use, Fire Saf. J. 22
On the contrary, HRR was significantly dependent of both the thickness and the surface area of the sample. This dependence was tightly related to particular events such as slump of the slabs or dripping occurring during the combustion.
A particular attention was paid to slump whose kinetics was de-termined by video analysis. It was demonstrated that slump of PMMA slabs was influenced by both their thickness and their surface area. This was assumed to be linked to the evolution of the mechanical properties of the plate during the fire t est. T he P MMA s lab s lump a ffects the magnitude of the HRR peak owing to the decrease of the surface area exposed to the incident heat flux.
To validate the hypotheses, a numerical model was proposed for simulating the thermo-mechanical behavior of a PMMA plate.
Two approaches were conducted (i) a preliminary analytical mod-eling and (ii) a numerical finite elements simulation. The first approach enables estimating the propensity of vertical plates to buckling ac-cording to their height and thickness. However, in this approach, the temperature variation and the rheological change of the material are not considered. To take into account the temperature distribution in a slab and the consequent local variations of stiffness, a second approach
(1994) 67–87.
[12] C. Vovelle, R. Akrich, J.-L. Delfau, S. Gresillaud, Influence of the thickness on the thermal degradation of PMMA, Fire Safety Science- Proceedings Of the First International Symposium, 1985, pp. 473–482.
[13] J. Zhang, T.J. Shields, G.W.H. Silcock, Effect of melting behaviour on upward flame spread of thermoplastics, Fire Mater. 21 (December 1995) 1–6 1997.
[14] J. Sherratt, The Effect of Thermoplastics Melt Flow Behaviour on the Dynamics of Fire Growth, PhD thesis Univ. Edinburgh, 2001.
[15] Q. Xie, H. Zhang, L. Xu, Large-scale experimental study on combustion behavior of thermoplastics with different thickness, J. Thermoplast. Compos. Mater. 22 (2009) 443–451.
[16] T. Ohlemiller, J. Shields, Aspects of the fire behavior of thermoplastic materials, NIST Tech (2008) Note.
[17] J. Zhang, Y. Wang, X. Lu, J. Yu, Study on melting behavior of polymers during burning, Fire Saf. Sci. (2005) 637–646.
[18] K.M. Butler, A numerical model for combustion of bubbling thermoplastic materials in microgravity, NIST Interagency/Internal Rep 1493 (2002) 158 NISTIR 6894. [19] R.H. Krämer, M. Zammarano, G.T. Linteris, U.W. Gedde, J.W. Gilman, Heat release
and structural collapse of flexible polyurethane foam, Polym. Degrad. Stab. 95 (6) (2010) 1115–1122.
[20] C. Vincent, et al., Multi-scale experiments of household materials burning, Chem. Eng. Trans. 43 (2015) 2419–2424.
[21] C. Vincent, Caractérisation du comportement au feu des matériaux de l’habitat : Influence de l’effet d’échelle, Thèse de Doctorat, Université de Montpellier, 2016. [22] N. Bal, G. Rein, Numerical investigation of the ignition delay time of a translucent
solid at high radiant heat fluxes, Combust. Flame 158 (2011) 1109–1116.
[23] J.E. Mark, Physical Properties of Polymers Handbook, second ed., Springer S, 2006. [24] J.P. Trotignon, J. Verdu, M. Piperaud, A. Dobraczynski, Précis de “Matières
plas-tiques : Structures-propriétés, mise en oeuvre, normalisation”, 5ème édition, Afnor-Nath, 1994 Paris.
[25] R. Lyon, M. Janssens, Polymer Flammability, (2005) Springfield.
[26] Altuglas International, “Brochure Technique : Plaques coulées et extrudées.” pp. 1–17.
[27] Afnor, NF EN 135011 Classement au feu des produits et éléments de construction -Partie 1 : Classement à partir des données d’essais de réaction au feu, (2013). [28] S.P. Timoshenko, J.M. Gere, Theory of Elastic Stability, second ed., McGraw Hil.,
New York, 1961.
[29] G. Greenhill, Determination of the greatest height consistent with stability that a vertical pole or mast can be made, and of the greatest height to which a tree of given proportions can grow, Proc. Camb. Philol. Soc. IV (1881) 65–74. [30] D. Statler, R. Gupta, A finite element analysis on the modeling of heat release rate,
as assessed by a cone calorimeter, of char forming polycarbonate, Proceedings Of the COMSOL Conference, 2008.
[31] W. Al Hadad, Y. Jannot, D. Maillet, Modélisation du transfert de chaleur dans un demi-échangeur, Congrès Français de Thermique SFT 2015, 2015.
[32] H.-H. Kausch, N. Heymans, C.J. Plummer, P. Decroly, Matériaux Polymères: Propriétés Mécaniques et Physiques, (2001) Lausanne.
[33] Anton Paar, Application Note Physica Rheometers, (2006).
[34] C. Stamboulidès, Rheology and Processing of Molten Poly(methyl Methacrylate) Resins, Aristotle University of Thessaloniki, Greece, 2002.
[35] C. Pandis, et al., Glass transition and polymer dynamics in silver/poly(methyl methacrylate) nanocomposites, Eur. Polym. J. 47 (8) (Aug. 2011) 1514–1525.