HAL Id: hal-02960216
https://hal-mines-albi.archives-ouvertes.fr/hal-02960216
Submitted on 4 Nov 2020HAL is a multi-disciplinary open access archive for the deposit and dissemination of sci-entific research documents, whether they are pub-lished or not. The documents may come from teaching and research institutions in France or abroad, or from public or private research centers.
L’archive ouverte pluridisciplinaire HAL, est destinée au dépôt et à la diffusion de documents scientifiques de niveau recherche, publiés ou non, émanant des établissements d’enseignement et de recherche français ou étrangers, des laboratoires publics ou privés.
Rheological characterization of sludge in divided
granular-like and pasty states using a granular rheometer
Mohamed Mouzaoui, Martial Sauceau, Laurent Devriendt, J.C. Baudez,
Patricia Arlabosse
To cite this version:
Mohamed Mouzaoui, Martial Sauceau, Laurent Devriendt, J.C. Baudez, Patricia Arlabosse. Rheolog-ical characterization of sludge in divided granular-like and pasty states using a granular rheometer. Powder Technology, Elsevier, 2021, 378, Part A, pp.521-527. �10.1016/j.powtec.2020.09.070�. �hal-02960216�
1
Rheological characterization of sludge in divided granular-like
and pasty states using a granular rheometer
M. Mouzaoui1,2, M. Sauceau1, L. Devriendt1, J.C. Baudez2,3 and P. Arlabosse1
1Université de Toulouse; Mines Albi; CNRS; Centre RAPSODEE, Campus Jarlard, F-81013 Albi, France. 2Irstea, UR TSCF, Domaine des Palaquins, F-03150 Montoldre, France.
3IMT Lille Douai, Direction de la Recherche et de l’Innovation, F-59508, Douai, France.
Corresponding author: Prof. Patricia Arlabosse Phone: +33563493237
Mail: Patricia.Arlabosse@mines-albi.fr
ABSTRACT
Structural changes during sludge treatments impact flowability and raise severe technical issues. In this study, the sludge consistency is analysed using the thread rolling test. Transition from pasty to granular-like material occurs at a total solid (TS) content of 43 wt. %. A granular rheometer is used to characterize sludge’s flowability over a wide range of TS content. The typical powder-like behaviour is recorded whatever the TS contents. All the shear stresses/consolidations curves exhibit a linear increase, highlighting the contribution of frictional interactions. Fitting the Mohr-Coulomb failure criterion to these curves emphasizes a substantial rise of frictional interactions from 43 wt.%. Flow functions are determined from the Mohr's circle stress analysis. According to the classification of powder flowability, sludge behaviour is analogous to that of very cohesive powders for 25.5 < TS < 43 wt.% while for lower and higher TS contents, the material behaves like cohesive powders.
2
1. Introduction
Municipal sewage sludge are a by-product from the treatment of urban wastewater. Large volumes are produced annually throughout the world [1, 2]. Stringent regulation, higher wastewater treatment coverage and advanced processes implementation will further increase the production in the coming years. Accordingly, sludge management is an important issue. Thanks to their high organic content, energy recovery from incineration, pyrolysis or gasification is a promising route for large municipal wastewater treatment plant [3, 4]. However, raw sludge contain a large amount of water (up to 98 wt. %) and, even if a variety of technologies exist to concentrate the sludge, the total solid (TS) content after mechanical dewatering reaches 18 to 35 wt. % [5]. A minimum of 60 wt. % is expected for co-incineration with municipal solid waste while more than 85 wt. % is needed for pyrolysis and gasification [3, 6]. As a consequence, thermal drying is essential to increase the TS content to the necessary technical threshold, prior to any thermal valorisation. During the drying process, sludge consistency progressively changes from paste-like to granular-like state, that generally appears at a TS value of 50 to 60 wt. % [7–9]. In the meanwhile, the sludge pass through a highly cohesive phase, often referred to as “plastic state” [7, 9-10]. At lab scale, the transition from plastic to granular-like state, called the plastic limit, can be characterized through one of the Atterberg limits tests, known as thread rolling test [12].
All these structural and textural changes impact sludge flowability and raise severe technical issues for handling, pumping and conveying the sludge, in the dryer itself but more often in the whole sludge processing line. But despite this, only few publications are devoted to the rheological characterization of paste-like and plastic sludge, mainly because of the difficulties to carry out relevant measurements [13-17]. Recently, Mouzaoui et al. [18] succeeded to investigate the rheological behaviour of sludge up to its plastic limit (TS=43 wt. %), using a conventional rotating rheometer and without any physical pre-treatment. They highlighted the existence of a frictional contribution, evidenced by the onset of dilatancy, above 14 wt. % TS. Dilatancy is normally a feature of compacted dense granular materials when sheared. In powder technology, the standard method to characterize the flowing properties is the shear testing. Many commercial shear testers have been developed. Among them, the Jenike cell, the Schulze ring cell and the FT4 tester are extensively used [19–21], either for dry and wet granular packings. The overall principle is to consolidate the sample, by applying a given normal load, and then to induce shearing at very low rotational speed on the upper layer of the material bed until the medium yields. Compared to conventional rotating rheometers,
3
jamming of coarse particles in small gap, slippage or fracture usually observed with highly concentrated materials and particle migration from the free surface are avoided in shear cells, thanks to the large sample volume, the confined geometry (cylindrical cell closed by a helical blade) and the overall principle of the testing method which seeks to determine the rupture stress. In addition, the testing procedures are well-documented, and the method enables to rank the flowability of different materials, which is very helpful in complex problems encountered in engineering practice.
Peeters et al. [22] first proposed the use of a shear tester outside the world of powder technology and developed a homemade shear tester, based on the Jenike shear test, for mapping changes in adhesion properties and stickiness during drying. Li et al. [23] have extended this approach to the characterization of cohesion properties. The main limitation to these homemade shear testers for sludge is that the sample is manually consolidated to a single normal stress. In powder technology, running the shear test at different levels of consolidation gives the “yield locus” that characterizes the relationship between the shear stresses at the transition from no-flow to flow and the applied normal stresses. The shear resistance at zero normal stress, also called the cohesion [24-26], can be deduced from this curve. Additionally, fitting Mohr stress circles to the yield locus gives themajor consolidation and the unconfined yield strength, whose ratio quantifies the flow function ffc [20, 27]. Based
on this index, a classification of powder flowability has been established [20, 28] and has nowadays become a standard. The higher the flow function (ffc), the better the flowability (Table 1).
Table 1
Despite the above-mentioned limitation, applying shear testing outside the world of powder handling gave promising results. Peeters et al. emphasized that the adhesive force required to cause slipping onto the contact surface reaches a maximum when the sludge is partially dried in the range from 25 to 40% TS [22]. Increasing the dryness decreases these adhesive forces with a steep slope until 50% TS. Li at al. noticed a similar evolution of the cohesive forces but the maximum was shifted to higher TS content [23]. The shear stress needed to start flowing was approximately 5,400 Pa for a consolidation stress of 4,200 Pa. Sewage sludge are complex mixture of bacteria and fine particles inserted in a matrix of extracellular polymeric substances (EPS) which glues together the different solids components and entraps the water. With increasing TS, the formation of an entangled network of polymers (10< TS< 25%) followed by the gelation of these polymers (25 < TS < 40%) explain the gradual increase of
4
the adhesive and cohesive forces [22]. Above the plastic limit, voids formation reduces both the material cohesion and its adhesiveness on contact surfaces, explaining the decrease of the corresponding shear stress.
The aim of the present study is to move one step forward by applying a commercial shear tester to characterize sludge’s flowability, based on ffc values, over a wide range of TS content. To confirm the relevance of the approach, a comparison between the rupture stresses and yield-like stresses required to initiate the flow, measured with a conventional rotating rheometer in the paste-like regime, is proposed in the first section. Then, the commercial shear tester is used to investigate the evolution of the flow function both in the pasty and the granular-like regimes.
2. Material and methods 2.1 Sludge origin and conditioning
The dewatered digested municipal sewage sludge was sampled at the wastewater treatment plant (WWTP) of Albi city (France) at the outlet of the centrifuge. Its initial TS, determined by drying the wet sample at 105°C for 24 hours [32], was 20 wt. %. Samples of higher TS contents ranging from 20 to 43 wt. % have been prepared by lab centrifugation (at 30000 rpm or 108800 g) for 30 minutes to 24 hours at controlled ambient temperature. To obtain higher TS content (up to 48 wt. %), part of the 43% wt. sludge was let at room temperature for 4 to 8 hours for natural drying. The volatile solid (VS) content was determined after igniting the dry solids at 550 °C for 2 h [32]. The VS content of the raw sludge was equal to 63 wt. % TS. Centrifuge did not alter this macroscopic parameter [18].
2.2 Sludge texture
Standardised soil mechanics tests can be used to determine the transitions between the liquid, pasty (or plastic) and semi-solid (or divided granular-like) states [12]. Visually, the pasty raw sludge was well beyond the liquid state. Consequently, only the plastic limit (TSP), that
corresponds to the concentration at which the sludge can no longer be rolled into threads of 3 mm in diameter and 10 cm in length without breaking into pieces, was determined using the thread method. The transition from plastic to divided granular-like states occurred at TSP=43 wt. %. Figure 1 highlights the changes in texture due to the increase in TS content.
Figure 1
5
Above the plastic limit (TS > TSP), rheological measurements can only be performed with a granular rheometer but, below the plastic limit (TS < TSP), conventional rotating rheometers can also be used. Therefore, both devices are used in this study to characterise the rheological behaviour of the pasty sludge (20 wt. % < TS < TSP). The two devices with the experimental
protocols implemented are described in the following.
2.3.1 Granular rheometer
FT4 rotational rheometer (Freeman Technology, UK) was used to carry out the experimental tests in shear measurements. Measurements were carried out in a cylindrical glass cell of 25 mm in diameter and 10 mm in height (Figure 2-a). The cell was filled to capacity with sludge, as shown in Figure 2-b. To create a uniform packing throughout the sample, remove any variability during the preparation and thus improve results reproducibility, a pre-consolidation stress σc (without any rotation) was applied for 60 s (Figure 2-c) before every test.
Figure 2
After this conditioning process, the measurement test may begin. A normal consolidation stress σi, lower than the conditioning pre-consolidation stress σc, was applied. Then, the consolidated sample was submitted to a constant angular velocity of 18°/min (figure 2-d) and the shear stress signal τ (ratio of the torque to the sheared surface) was recorded versus time. A schematic diagram of the shear cell measurements is presented in Figure 3. The shear stress increases until a maximum shear stress is observed (Figure 3 left). The peak corresponds to the rupture stress τsi, which characterizes material failure and flow at the considered consolidation σi [33]. After the failure, the rotation and the normal load were cancelled. The
sample was replaced and conditioned. This procedure was repeated with increasing consolidations (σi), all being smaller than the pre-consolidation (σc).Visually, no phase separation between total solids and water occurs in the treated samples, even if water migration through the sample, at a microscopic scale, can arise. As the sludge was taken in the WWTP after conditioning and mechanical dewatering and centrifuged again in the lab (using a very high centrifugal force) to further increase its TS contents, it may be assumed that all the moisture was fully entrapped in the flocs and the applied normal loads were too low to cause any phase separation. However, upon completion of any rheological test, the moisture content was rechecked. No significant variation was found.
6
The different pairs (τsi, σi) constitute the so-called yield locus (YL), for a given pre-consolidation σc (Figure 3 right). Below YL, the material does not flow while, above the
curve, the shear force is high enough to overcome the material shear strength and the material flows. The loci of (τsi, σi) can be linear or non-linear [34]. For instance, many rocks exhibit a non-linear behaviour [35]. However, the Coulomb’s criterion [36], equivalent to the assumption of a linear Mohr envelope, is recommended as a first order approximation to their behaviour [37], as long as a limited range of mean stress is considered. For many particulate solids, YL is normally found to show a small curvature, convex upwards, and a straight line is a sufficient approximation [38]. Fitting the Mohr-Coulomb failure criterion to the yield locus (Equation 1) gives the cohesion C (defined as the shear resistance at zero normal stress [24– 26]) and the static friction coefficient µ.
τsi =µ σi + C Equation 1
To rank sludge flowability according to their TS content, the flow function ffc, defined as the major consolidation σ1′ to the unconfined yield strength σc′ ratio (Equation 2), may be used.
ffc =σ1′/σc′ Equation 2
σ1′ and σ c
′ are determined by fitting Mohr stress circles to the yield locus (Figure 4). σ 1 ′ is
obtained by drawing a large Mohr circle which passes through the last point of the yield locus and is tangent to it. σc′ is equal to the diameter of the Mohr-circle passing by the origin and tangent to the yield locus.
Figure 4
2.3.2 Conventional rotating rheometer
Rheological measurements on the pasty samples were performed with a stress-controlled RS600 instrument (HAAKE), piloted by RheoWin software and equipped with a normal force (Fn) sensor. Serrated parallel plates geometry (with radius R=10 or R=17.5 mm) was used to
avoid wall slip (Figure 5). A constant gap of 2 mm was maintained for all the tests.
Figure 5
A preliminary constant dynamic strain (γ~0.3 %) in the linear viscoelastic range was applied for at least 300 seconds to relax stresses generated by loading the sample between the parallel plates [24]. Then, a stress sweep, corresponding to 0.1 to 1000 %, was applied at 1 Hz. The normal stress (σ = Fn/πR2) was recorded in parallel with viscoelastic properties. To avoid
7
fracturing, the stress sweep was performed according to the experimental procedure of surface correction developed by Mouzaoui et al. [18]. This procedure consists of applying a stress sweep in successive steps of constant dynamic stress of increasing intensity. Prior each constant stress step, a step at a reference state defined by a constant dynamic rotational angle 𝜙𝑟𝑒𝑓 is applied. The latter corresponds to a constant dynamic reference strain 𝛾𝑟𝑒𝑓=0.3 %
chosen in the linear viscoelastic plateau (LVE), where, by definition, stress and strain are proportional. By applying this reference state, fractures lead to a decrease of the corresponding stress and complex modulus (stress and strain ratio). As the complex modulus must be identical at the reference state before and after fractures, the surface really sheared (S) can be calculated, allowing the correction of the stress τ and the corresponding strain γ.
To obtain the yield-like stress for a given TS content, the normal stress (σ) and the viscous (or dissipation) modulus (G’’) are plotted versus the corrected stress (τ). Both signals start to decrease simultaneously when the shear stress exceeds a critical shear stress τc. This critical shear stress could be reasonably assumed as a yield-like stress. For a valid comparison with τsi (i.e. the rupture stress measured with the granular rheometer under a given consolidation σi), the normal stress on the conventional rotating rheometer is recorded and its value used to
consolidate the material in the granular rheometer. The procedure is repeated for the various TS contents.
3. Results and discussion
3.1. Comparison of the minimum stresses required to initiate sludge’s flow in the pasty regime
As long as the sludge remains pasty (i.e. below the plastic limit TSP=43 wt. %), both
commercial rheometers may be used to characterize sludge’s rheological properties and a comparison can be provided. The rupture stress τs and the yield-like stress τc both represent the minimum required shear stress for the sludge to start flowing. For a correct comparison, the same consolidation σ has to be applied on the sludge samples. Table 2 provides the normal stresses recorded during the stress sweep measurements on the conventional rotating rheometer and used for consolidating the sample in the granular rheometer for the various TS contents investigated.
8
Figure 6 displays the evolution of τs and τc with TS. In the range of TS investigated, similar shear stresses are measured with the two rheometers. Consequently, the use of the FT4 rheometer outside the world of powder technology seems to be fully relevant.
Figure 6
The empirical correlation of Eilers [39], defined by Equation 3, is classically used to fit experimental solid-like properties (yield stress, viscous and elastic moduli, consistency index) of dense suspension and granular pastes [40–42].
τc = b (1 + 1.25 TS 1 − TS TSm ) 2 Equation 3
Where b is a constant and TSm is the solids content corresponding to the maximum concentration of solids. Its value depends on the shape and size of the particles in the suspension.
In this study, values of TSm=55 wt. % and b=0.008 kPa are found to best fit the experimental data. Assuming the sludge to be a two phase mixture (water and total solids) in the range of TS investigated, the maximum packing fraction, defined as the volume fraction of solids at which the suspension cannot flow and viscosity tends to infinity, can be deduced from TSm (Equation 4): ϕ𝑚 = 1 1 + ρs ρw ∙ 1 − TSm TSm Equation 4
Where ρs and ρw are the densities of the solid and liquid fractions, respectively. A value of
ρs=1700 kg/m3, measured with a helium pycnometer (Micromeritics Accupyc II 1340), is used in the present study.
The maximum packing fraction ϕm reaches 42 %. This is much lower than the maximum volume fraction of 64% classically found for compact random packing of uniform hard spheres [43–45] but very close to the value of 45% obtained for fresh tricalcium silicate paste [46], for instance. Such low value is not surprising since sludge can be regarded as entangled deformable network of extracellular polymeric molecules that clumps together bacteria and others fine particles.
3.2. Investigation of sludge’s flowability using the FT4 granular rheometer 3.2.1. Determination of the optimal pre-consolidation 𝛔𝐜
9
The same procedure has to be applied for all the samples, whatever their pasty or semi-solid texture, in the range of TS contents investigated (48 to 20 wt. %). To identify a pre-consolidation (σc) that could be applied for all the samples, and thus the range of the applied consolidations (σi), various values of σc, ranging from 20 to 90 kPa, were tested. After conditioning the sample, a consolidation equal to the value of σc was applied to the sample
and the shearing test performed. Only the sludge having the lowest and highest TS contents (20 wt. % and 48 wt. %, respectively) were characterized. The shear stress signals are plotted in Figure 6 for various values of σc. For the granular-like sludge with TS = 48 wt. % (Figure
7, left), the typical powder-like behaviour is recorded whatever the applied consolidation: the shear stress increases as a function of time until a maximum and then progressively decreases before tending toward a plateau [21, 33, 47]. For the pasty sample with TS = 20 wt. % (Figure 7, right), instabilities in shear stress measurements occur from 40 kPa. The material resists until it is not strong enough to support the applied load. As a result, the pasty sludge escape the measurement cell (Figure 7, right-insert) and fill the gap between the glass cell and the mobile device. This induces an additional resistance to flow, leading to the increase of the shear stress τ. Therefore, σc was taken equal to 30 kPa.
Figure 7
Left: divided granular-like sludge (TS=48 wt. %); Right: pasty sludge (TS=20 wt. %).
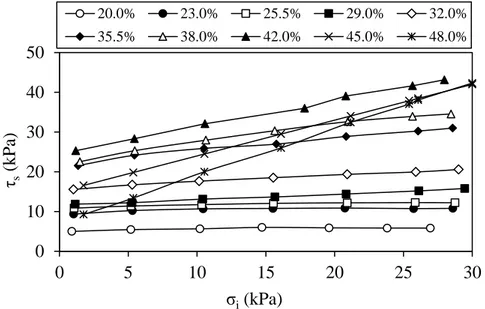
3.2.2. Influence of the solids content on the rupture stress
Figure 8 shows the rupture stress (τs) versus the normal stress (σ𝑖) for various TS contents
between 20 and 48 wt. %. All the curves exhibit a linear increase, highlighting a frictional behaviour similar to that of powders and granular materials.
Figure 8
The same data may be plotted from a different perspective. Figure 9 highlights the evolution of the rupture stress with TS content for two different consolidations (σi=5 and 16 kPa,
respectively) with the purpose of studying the influence of consolidation on the sludge’s resistance to flow. The higher the rupture stress τs for a given consolidation, the less likely it is that the material will yield. The pattern is similar to the one already observed by Li et al. [23]. At low solid content (TS < 25.5 wt. %), the EPS network is dense and stiff [48] but the resistance to flow remains weak. The entrapped water, available in large quantity in sludge flocs, plays a lubricant role between solids. With the increase of the TS content, sludge shows increasing resistance to flow. Peters et al. [49] suggest that gelation occurs, reducing the
10
macroscopic mobility of the 3D interconnected EPS network. With increasing TS contents, the dimension of the branched polymer structures increases and the EPS matrix is able to withstand fairly high shear stress. When the TS content reaches the plastic limit (TSP=43 wt. %), the structure has reached maximum rigidity and the resistance to flow
achieves a maximum. The maximum shear stress, that is needed to cause the transition from no flow to flow, is equal to 25 and 36 kPa for σi=5 and σi=16 kPa, respectively. The higher the consolidation, the higher the rupture stress is. The maximum achieved for σi=5 kPa is 5 times higher than the value reported by Li et al. [23] for nearly the same consolidation. However the inorganic fraction in Chinese sludge is often much higher (between 61 and 68% TS for the samples used in [23], compared to 37% TS in the present study) and increasing the inorganic content of the sludge decreases the sludge stickiness [48]. A similar influence on the cohesive forces may reasonably be expected. Above the plastic limit, voids and cavities form and a drastic decline of the resistance to flow with TS content is observed.
Figure 9
3.2.3. Influence of the solids content on sludge’s flowability
In order to go further, the Mohr-Coulomb failure criterion (Equation 1) and Mohr stress circles were fitted to the yield locus. Values of the cohesion C and the friction coefficient µ
are reported in Figure 10 and Table 3, together with the flow function ffc. The dash line in Figure 10 corresponds to the plastic limit.
Figure 10
Cohesion increases progressively with TS content as long as sludge remains pasty and then decreases sharply above the plastic limit. As might be expected [50-51], cohesion and flow function are inversely correlated, whatever the sludge texture. To reduce the complexity of the shear cell data, Wang et al. [51] highlight that the flow function is inversely proportional to a dimensionless cohesion, defined as the ratio of the cohesion C to the initial consolidation stress σc, the proportionality coefficient being an equipment characteristic. Here, as the same
consolidation stress was used whatever the sludge sample, the flow function is directly inversely proportional to the cohesion. According to the standard classification of powder flowability [20, 27, 28], the behaviour of the pasty sludge in the range from 23 to 43% is similar to that of very cohesive powder while, at lower TS content or above the plastic limit, the material behaves like cohesive powders.
11
The friction coefficient is a monotonically increasing function of theTS content in the whole range of concentration. The increase of TS content results in a gradual decrease in lubrication between sludge components. This favours the direct frictional contacts between the finite branched polymer structures and particulate solids, which results in the increase of the friction coefficient. A substantial rise of frictional interactions occurs from approximately 43 wt.%. When cavities and voids form into the sludge for TS > TSP, a granular phase appears. The
surface roughness of the sludge particles leads to a greater increase of the friction coefficient.
4. Conclusion
In this work, the rheological behaviour of a sludge is analysed by using a granular rheometer in a TS range of 20-48 wt. %, the transition between pasty and divided granular-like states occurring at around 43 wt. %. The comparison of the minimum required shear stresses for the sludge to start flowing, determined either using a conventional rotating rheometer or a commercial shear tester, confirms that applying shear testing for sludge characterization is fully relevant. In the range of TS content investigated, the yield locus, that characterizes the evolution of tangential stresses at the transition from no-flow to flow with applied normal stresses, can be modelled using the Mohr-Coulomb failure criterion. This highlights the existence of a continuous network of polymer structures and solid particles in contact, with frictional interactions controlling the apparent behaviour of both the pasty and the granular-like sludge. These frictional interactions increase with TS content but a substantial rise occurs from 43%. Flow function values were determined by fitting the yield locus with Mohr stress circles. Below 25.5% and above TSP = 43%, the sludge behaves like cohesive powders according to the standard classification of powder flowability. In the range from 25.5 to approximately TSP= 43%, the sludge behaviour is analogous to that of very cohesive powders. These results pave the way for a rheophysical classification of sludge according to their TS content.
5. References
[1] A. Kelessidis, A.S. Stasinakis, Comparative study of the methods used for treatment and final disposal of sewage sludge in European countries, Waste Manage. 32 (2012) 1186-1195. https://doi.org/10.1016/j.wasman.2012.01.012
[2] G. Yang, G. Zhang, H. Wang, Current state of sludge production, management, treatment and disposal in China, Water Res. 78(2015) 60–73.
https://doi.org/10.1016/j.watres.2015.04.002
12
sludge thermal processing : from drying to thermal valorisation, in: E. Tsotsas, A.S. Mujumdar (Eds.), Modern Drying Technology - Volume 4: Energy Savings, Wiley-VCH Verlag GmbH & Co, Weinheim, 2012: pp. 295–329.
[4] D. Panepinto, S. Fiore, G. Genon, M. Acri, Thermal valorization of sewer sludge: Perspectives for large wastewater treatment plants, J. Clean. Prod. 137(2016) 1323-1329. https://doi.org/10.1016/j.jclepro.2016.08.014
[5] G.H. Chen, P.L. Yue, A.S. Mujumdar, Sludge dewatering and drying, Dry. Technol. 20 (2002) 883–916. https://doi.org/10.1081/DRT-120003768
[6] D. Fytili, A. Zabaniotou, Utilization of sewage sludge in EU application of old and new methods: A review, Renew. Sustain. Energy Rev. 12 (2008) 116–140.
https://doi.org/10.1016/j.rser.2006.05.014
[7] J.H. Ferrasse, P. Arlabosse, D. Lecomte, Heat, momentum, and mass transfer measurements in indirect agitated sludge dryer, Dry. Technol. 20 (2002) 749–769. https://doi.org/10.1081/DRT-120003755
[8] T. Ruiz, C. Wisniewski, Correlation between dewatering and hydro-textural characteristics of sewage sludge during drying, Sep. Purif. Technol. 61 (2008) 204–210.
https://doi.org/10.1016/j.seppur.2007.07.054
[9] C. Charlou, M. Sauceau, P. Arlabosse, Characterization of residence time distribution in continuous paddle dryer, JRS&T 10(3) (2013) 117-125
[10] T. Kudra, Sticky region in drying-definition and identification, Dry. Technol. 21 (2003) 1457–1469. https://doi.org/10.1081/DRT-120024678
[11] L. Bennamoun, P. Arlabosse, A. Léonard, Review on fundamental aspect of application of drying process to wastewater sludge, Renew. Sustain. Energy Rev. 28 (2013) 29–43. https://doi.org/10.1016/j.rser.2013.07.043
[12] ASTM D4318-17e1, Standard Test Methods for Liquid Limit, Plastic Limit, and Plasticity Index of Soils, ASTM International, West Conshohocken, 2017. DOI: 10.1520/D4318-17E01
[13] G. Agoda-Tandjawa, E. Dieudé-Fauvel, R. Girault, J.C. Baudez, Using water activity measurements to evaluate rheological consistency and structure strength of sludge, Chem. Eng. J. 228 (2013) 799–805. https://doi.org/10.1016/j.cej.2013.05.012
[14] P. Battistoni, Pre-treatment, measurement execution procedure and waste characteristics in the rheology of sewage sludges and the digested organic fraction of municipal solid wastes, Water Sci. Technol. 36 (1997) 33–41. https://doi.org/10.1016/S0273-1223(97)00666-5
[15] J.C. Baudez, J.C. Megnien, E. Guibelin, Pumping of Dewatered Sludge : Slipping or Flowing Behavior ?, Chem. Eng. J. 295 (2016) 494–499.
https://doi.org/10.1016/j.cej.2016.03.071
[16] J.C. Baudez, P. Coussot, Rheology of aging, concentrated, polymeric suspensions: Application to pasty sewage sludges, J. Rheol. 45(5) (2001) 1123–1139.
https://doi.org/10.1122/1.1392298
[17] F. Chaari, G. Racineux, A. Poitou, M. Chaouche, Rheological behavior of sewage sludge and strain-induced dewatering, Rheol. Acta. 42 (2003) 273–279.
https://doi.org/10.1007/s00397-002-0276-5
[18] M. Mouzaoui, J.C. Baudez, M. Sauceau, P. Arlabosse, Experimental rheological procedure adapted to pasty dewatered sludge up to 45 % dry matter, Water Res. 133 (2018) 1–7. https://doi.org/10.1016/j.watres.2018.01.006
[19] R.E. Freeman, Measuring the flow properties of consolidated, conditioned and aerated powders - a comparative study using a powder rheometer and a rotational shear cell, Powder Technol. 174 (2007) 25–33. https://doi.org/10.1016/j.powtec.2006.10.016
[20] A.W. Jenike, Storage and flow of solids, University of Utah, Salt Lake City, 1964. [21] J. Schwedes, D. Schulze, Measurement of flow properties of bulk solids, Powder
13
Technol. 61 (1990) 59–68. https://doi.org/10.1016/0032-5910(90)80066-8
[22] B. Peeters, R. Dewil, J.F. Van Impe, L. Vernimmen, I.Y. Smets, Using a Shear Test-Based Lab Protocol to Map the Sticky Phase of Activated Sludge, Environ. Eng. Sci. 28 (2011) 81–85. https://doi.org/10.1089/ees.2010.0168
[23] B. Li, F. Wang, Y. Chi, J.H. Yan, Adhesion and Cohesion Characteristics of Sewage Sludge During Drying, Dry. Technol. 32 (2014) 1598–1607.
https://doi.org/10.1080/07373937.2014.910522
[24] C.A. Coulomb, Sur une application des règles maximis et minimis a quelques problèmes de statique, relatives à l’architecture, Acad Sci Paris Mem Math Phys. 7 (1776) 343–382. [25] J. Heyman, Coulomb’s Memoir on Statics: An essay in the History of Civil Engineering, New edition, Imperial College Press, London, 1972.
[26] R.M. Nedderman, Statics and kinematics of granular materials, Cambridge University Press, Cambridge, 1992.
[27] A.W. Jenike, Gravity Flow of Bulk Solids, University of Utah, Salt Lake City, 1961. [28] J. Thomas, H. Schubert, Particle Characterisation, in: Int. Congr. Part. Technol., Nuremberg, Germany, 1979: pp. 301–319.
[29] M. Leturia, M. Benali, S. Lagarde, I. Ronga, K. Saleh, Characterization of flow
properties of cohesive powders: A comparative study of traditional and new testing methods, Powder Technol. 253 (2014) 406–423. https://doi.org/10.1016/j.powtec.2013.11.045
[30] J.P. Lopes Neto, A.S. Meira, J.W.B. do Nascimento, J.P. Lopes Neto, A.S. Meira, J.W.B. do Nascimento, Flow properties and pattern flow prediction of food industrial powders, Eng. Agric. 37(4) (2017) 627–636. http://dx.doi.org/10.1590/1809-4430-eng.agric.v37n4p627-636/2017
[31] Y. Liu, X. Guo, H. Lu, X. Gong, An investigation of the effect of particle size on the flow behavior of pulverized coal, Procedia Eng. 102 (2015) 698–713.
https://doi.org/10.1016/j.proeng.2015.01.170
[32] E.W. Rice, R.B. Baird, A.D. Eaton, L.S. Clesceri, Standard Methods for the Examination of Water and Wastewater - Method 2540.G Total, Fixed, and Volatile Solids in Solid and Semisolid Samples. American Public Health Association, Washington DC, 2012
[33] K. Johanson, Y. Rabinovich, B. Moudgil, K. Breece, H. Taylor, Relationship between particle scale capillary forces and bulk unconfined yield strength, Powder Technol. 138 (2003) 13–17. https://doi.org/10.1016/j.powtec.2003.08.037
[34] O. Mohr, Welche Umstände bedingen die Elastizitätsgrenze und den Bruch eines Materials? Zeit des Ver Deut Ing 44 (1900) 1524–1530 (in German).
[35] J.C. Jaeger, N.G.W. Cook, Fundamentals of Rock Mechanics, 3rd edition, Chapman & Hall, London, 1979.
[36] C.A. Coulomb, Sur une application des règles maximis et minimis à quelques problèmes de statique, relatives à l’architecture. Acad Sci Paris Mem Math Phys 7 (1776) 343–382 (in Franch).
[37] K. Mogi, Experimental rock mechanics. Taylor & Francis Group, London, 2007
[38] IChemE, Standard Shear Testing Technique for particulate solids using the Jenike shear cell. A report of the EFCE working party on the Mechanics of Particulate Solids, The
Institution of Chemical Engineers, Rugby, 1989
[39] H. Eilers, The viscosity of the emulsion of highly viscous substances as function of concentration, Kolloid-Zeitschrift. 97 (1941) 313–321.
[40] C. Hanotin, Rhéophysique des suspensions granulaires vibrées, Thèse de doctorat en Mécanique et Energétique, Université de Lorraine, 2014 (in French).
[41] P.M. Mwasame, N.J. Wagner, A.N. Beris, Modeling the effects of polydispersity on the viscosity of noncolloidal hard sphere suspensions, J. Rheol. 60 (2016) 225–240.
14
[42] A. Singh, P.R. Nott, Experimental measurements of the normal stresses in sheared Stokesian suspensions, J. Fluid Mech. 490 (2003) 293‐320.
https://doi.org/10.1017/S0022112003005366
[43] G.D. Scott, D.M. Kilgour, Density of random close packing of spheres, J. Phys. D Appl Phys. 2 (1969) 863.
[44] J.G. Berryman, Random close packing of hard spheres and disks, Phys. Rev. A. 27 (1983) 1053–1061.https://doi.org/10.1103/PhysRevA.27.1053
[45] J.D. Bernal, J. Mason, Co-ordination of randomly packed spheres, Nature. 188 (1960) 910–911. https://doi.org/10.1038/188910a0
[46] S. Mansoutre, P. Colombet, H. Van Damme, Water retention and granular rheological behavior of fresh C3S paste as a function of concentration, Cem. Concr. Res. 29 (1999) 1441– 1453. https://doi.org/10.1016/S0008-8846(99)00129-5
[47] R. Collet, Critères de malaxabilités des milieux granulaires humides, Thèse de doctorat en Génie des procédés et de l’environnement, Institut National Polytechnique de Toulouse, 2010 (in French).
[48] I. Seyssiecq, J.H. Ferrasse, N. Roche, State-of-the-art: rheological characterisation of wastewater treatment sludge, Biochem. Eng. J. 16 (2003) 41–56.
https://doi.org/10.1016/S1369-703X(03)00021-4
[49] B. Peeters, effect of activated sludge composition on its dewaterability and sticky phase, PhD Thesis in Chemical Engineering, Leuven university, 2011.
[50] Y. Wang, R.D. Snee, W. Meng, F.J. Muzzio, Predicting flow behavior of pharmaceutical blends using shear cell methodology: a quality by design approach, Powder Techno. 294 (2016) 22-29
[51] Y. Wang, S. Koynov, B.J. Glasser, F.J. Muzzio, A method to analyze shear cell data of powders measured under different initial consolidation stresses, Powder Techno. 294 (2016) 105-112
15
List of Tables
Table 1. Classification of powder flowability according to the ffc value.
Table 2. Values of the normal stress for various TS contents during stress sweep measurement on the conventional rheometer.
Table 3. Evolution of the cohesion, the friction coefficient and the flow function with the solids content.
16
Table 1. Classification of powder flowability according to the ffc value.
Flowability index
Flow behaviour Examples References
ffc < 1 Not flowing - -
1 < ffc < 2 Very cohesive
Nano-sized powder of carbon black Leturia et al. [29]
Flacked oat Lopes Neto et al. [30]
2 < ffc < 4 Cohesive
Coal with diameter < 17.7 µm Liu et al. [31]
Corn-starch Lopes Neto et al. [30]
4 < ffc < 6 Easy-flowing
Coal with 17.7 < diameter < 141.3 µm Liu et al. [31]
Flacked corn Lopes Neto et al. [30]
ffc > 10 Free-flowing
Coal with diameter < 141.3 µm Liu et al. [31]
PVC powder Leturia et al. [29]
Table 2. Values of the normal stress for various TS contents during stress sweep measurement on the conventional rheometer.
TS (wt. %) 20.0 23.0 25.5 26.3 29.0 35.5 42 σ (kPa) 11 20 24 27 34 60 100
Table 3. Evolution of the cohesion, the friction coefficient and the flow function with the solids content.
TS (wt. %) 20.0 23.0 25.5 29.0 32.0 35.5 38.0 42.0 45.0 48.0 C (kPa) 5.3 9.9 11.3 13.0 15.8 21.0 22.9 24.9 15.0 7.2 µ (-) 0.03 0.04 0.04 0.14 0.16 0.31 0.43 0.67 0.90 1.17
17
List of Figures
Figure 1. Influence of the TS content on the texture of the sludge (on the left side, the raw pasty sludge and, on the right side, the semi-solid sludge at 48 wt.%)
Figure 2. FT4 granular medium shear cell, sludge preparation and shearing procedure.
Figure 3. Descriptive diagram of the shearing test.
Figure 4. Determination of the major consolidation σ1′ and the unconfined yield strength σc′.
Figure 5. Pasty sludge (TS=20 wt. %) sheared between parallel plates. Figure 6. Comparison between τc and τs.
Figure 7. Shear stress versus time for different normal stresses. Left: divided granular-like sludge (TS=48 wt. %); Right: pasty sludge (TS=20 wt. %).
Figure 8. Rupture stress (τs) as a function of the consolidation (σi) for various TS contents between 20 and 48 wt. %.
Figure 9. Shearing strength of the sludge as a function of TS content, for two different normal stresses.
Figure 10. Variation of the friction coefficient, the cohesion and the flow function according to the solids content.
18
Figure 1. Influence of the TS content on the texture of the sludge (on the left side, the raw pasty sludge and, on the right side, the semi-solid sludge at 48 wt.%)
Figure 2. FT4 granular medium shear cell, sludge preparation and shearing procedure.
TS=20 % TS=48 %
σc
a b c d
σ𝑖
19
Figure 3. Descriptive diagram of the shearing test.
Figure 4. Determination of the major consolidation σ1′ and the unconfined yield strength σc′.
Figure 5. Pasty sludge (TS=20 wt. %) sheared between parallel plates.
τsi (kPa ) σi(kPa) Yield locus τs4n τs1 C τs2 τs3 time Rupture stress τsi σ3 σc σi σ1 σ2 σ4 τsi τ σ1 σ2 σ3 σ4 ≤ Mohr circles σc′ σ1′ gap=2 mm
20
Figure 6. Comparison between τc and τs.
Figure 7. Shear stress versus time for different normal stresses 1 10 100 1000 10 20 30 40 50 τc and τs (kP a) TS (wt. %) τc τs model 0 20 40 60 80 τ (k Pa ) time (s)
40 kPa 70 kPa 90 kPa
0 2 4 6 8 10 12 τ (k Pa) time (s)
21
Figure 8. Rupture stress (τs) as a function of the consolidation (σi) for various TS contents between 20 and 48 wt. %.
Figure 9. Shearing strength of the sludge as a function of TS content, for two different normal stresses. 0 10 20 30 40 50 0 5 10 15 20 25 30 τs (kPa) σi(kPa) 20.0% 23.0% 25.5% 29.0% 32.0% 35.5% 38.0% 42.0% 45.0% 48.0% 0 10 20 30 40 10 20 30 40 50 τs (kPa) TS (wt. %) 5 kPa 16 kPa
22
Figure 10. Variation of the friction coefficient, the cohesion and the flow function according to the solids content.