Marc Hooghe
2014
Ruth Dassonneville
Party Members as an Electoral Linking Mechanism
An Election Forecasting Model for Political Parties in Belgium, 1981-2010
Party Politics, accepted
ABSTRACT
While party membership figures are clearly in decline in several Western countries, different interpretations have been offered on the likely consequences of this trend. Some authors stress that members have lost most of their importance for political parties that increasingly rely on professionalized campaign techniques. Other scholars have expressed concern about the decline of party membership. They emphasize the fact that party members continue to function as an important linkage mechanism providing a structural alignment between the party and society (and thus also to potential voters). By means of an election forecasting model for Belgium, we test whether party membership figures still can be related to election results. Results show that party membership has a strong effect on election results, and furthermore, that this relation does not weaken during the period under investigation (1981-2010). The analysis also demonstrates that forecasting models can also be used in a complex multiparty system like Belgium.
KEYWORDS
Introduction
In almost all Western democracies, political parties are rapidly losing members (Mair and van Biezen 2001; Whiteley 2011). The statistical evidence suggests that the phenomenon can be documented in most countries, while the various party families all seem to be equally affected (Dalton et al. 2000). The decline, furthermore, does not remain limited to passive membership but is also clearly present among the formerly active party members (Knut and Saglie 2003; Whiteley 2009). While all the statistical evidence suggests that there is indeed an erosion of party membership, there is an ongoing debate within the academic literature about the likely consequences of this trend. Some authors assume that this trend is just another indication for the structural evolution toward a cartel party or a professional-electoral party. Other authors, however, are concerned about the possible consequences of this trend, and they argue that a solid membership basis remains an important electoral and social linkage mechanism for political parties (Scarrow 1996; Whiteley 2009). This latter claim, however, often remains unsubstantiated. Whiteley (2009: 254), e.g., notes that the percentage of the population that is a member of a political party, is positively correlated with government effectiveness in that country. The study, however, does not detail a causal mechanism that could help us explain this relation.
In this article, we propose a much more direct test of the linkage argument. If members really present an important social anchorage element for political parties, one should observe a close relation between membership trends and electoral outcomes. In that case, the fewer members a political party has, the less likely it is that a political party will be able to reach out to society and gain votes. If, on the other hand, the professionalization thesis would be correct, we should observe that membership figures lose their predictive power with regard to election results. In
that case, parties increasingly rely on marketing strategies, professional and personalized election campaigns to mobilize voters, and they are no longer in need of having access to a large body of party members and supporters.
In order to test the impact of party membership on electoral outcomes, we will rely on the relatively new technique of election forecasting, that, as far as we know, never has been used for this purpose (Lewis-Beck 2005; Lebo and Norpoth 2011). More specifically, we will use the case of Belgian political parties in this article, first, because Belgium is a rather mainstream European country with regard to membership rates and electoral volatility, and second, because for Belgian political parties, we have access to three decades of time series on party membership and electoral results, and these time series data are essential if we want to use election forecasting as a technique.
In the remainder of this article, we first briefly review the literature on the importance of party membership as a linkage mechanism. Subsequently we explain data and methods, where we clarify in more detail the still new method of election forecasting. After presenting the results of the analysis, we reflect on the relevance of our findings for the debate about the role of party members in contemporary political parties.
Do political parties still need members?
The observation that political parties tend to lose members rapidly, must be considered against the background of a structural transformation of political parties in Western democracies. Political parties evolve toward a more professionalized political organization, that is aimed primarily at winning elections and securing elected office. This evolution has been described in
terms of a cartel party (Katz and Mair 1995, 2009) but also as a trend toward professional-electoral parties (Panebianco 1988). Although there is a persistent debate within the literature about the exact characteristics and consequences of this transformation, most authors agree on the fact that political parties gradually move closer to the state apparatus, as parties increasingly become dependent on government resources for their day to day functioning. They are therefore less dependent on their membership base than in more traditional mass-membership political parties. This process also leads to changes within the party organization, as professionals gain influence within the party, and the role of volunteers, militants and party members is strongly reduced. This trend toward professional-electoral parties, or cartel parties, in the long run might even strengthen the structural position of political parties as the parties can consolidate their position as power brokers within the political system. Most authors working in this line of the literature therefore do not treat the decline of membership figures as something that is inherently problematical. In the past political parties developed new organizational forms in order to respond to structural changes in society, and it is assumed that the current changes can also be regarded as rather functional for the long-term survival of political parties. With regard to electoral outcomes, the assumption is that highly professionalized and centralized campaigns can be just as effective as traditional grass-roots based campaigning (Farrell 1996). Even if parties tend to lose members, new campaign techniques would still enable them to reach out to new voters and to win elections.
Rather in contrast with this assumption is the position taken by a number of authors, highlighting the continued importance of grassroots membership for the functioning and the legitimacy of political parties (Scarrow 1996; Whiteley 2011). According to these authors, members remain an
campaigns and by providing a structural linkage mechanism to society in general (Spier and von Alemann 2008).
Party members contribute in various ways to the electoral success of political parties. First, they provide a form of legitimacy, as the presence of the members makes clear that the party is not just some elite initiative but is rooted within society (Scarrow and Gzegor 2010). Second, it can be safely assumed that the members themselves are very likely to vote for their political party, thus providing a relatively safe reservoir of votes. Third, during electoral campaigns, members can also be called upon to get involved in campaign strategy. Exactly the fact that they are not political professionals, and usually well connected within their own community, might make their message even more effective (Scarrow 1996, 2000). Despite the fact that campaigning is now largely media-oriented, and is heavily professionalized, Whiteley (2009: 255) argues that volunteers (who are most likely also party members) remain crucial to explain electoral success: “It is fairly clear that the political parties need their volunteers to be effective and that if action is not taken to reverse the current trends then governance in Britain will suffer in the long run.”
Especially in the United Kingdom there is quite some empirical research available on the relation between party membership and electoral outcomes. It is expected that party members are very likely to be mobilized during an election campaign, and that they will take part in various activities of their political party. As such, the presence and the participation of party members is seen as a crucial element to explain electoral success (Whiteley and Seyd 1998). Other research, however, points to the importance of centralized targeting (Denver and Hands 2004). Given the characteristics of the British electoral system, central party offices will decide to target resources to specific constituencies, while other constituencies, either because they are considered as safe
seats or because the party does not have a change anyhow to gain a seat, are not considered as a priority. This intervention from the central party office can reinforce and amplify in a dramatic manner the effectiveness of the efforts of local campaign volunteers, and as such, it points to the importance of professionalised campaign management. It is clear however, that the findings of these British studies cannot be generalized toward other political systems, as they focus heavily on constituencies with strongly contested seats. Given the characteristics of the British electoral system, political parties might indeed decide to spend a considerable amount of resources to these swing constituencies. It remains to be investigated, however, whether a similar logic also is applicable for proportional electoral systems with multi-member constituencies.
This review of the literature leads to two competing and contradictory hypotheses. The cartel party thesis assumes that party membership gradually becomes less important, and might even have lost all of its meaning for the electoral success of political parties. The linkage assumption, on the other hand, implies that the level of party membership still remains important for political parties as members remain an important electoral resource for political parties. Using data from Belgium for the period 1981-2010, the aim of the current article is to investigate the validity of both hypotheses in this specific political system. Belgium offers an ideal testing ground for our hypotheses. First, the Belgian electoral system is extremely proportional, thus counterbalancing the current dominance in the literature of case studies in majoritarian systems. Second, since Belgium has a very comprehensive system of party financing, it can be assumed that the trend toward a professionalization of party politics is clearly present within the Belgian party system (Hooghe et al. 2006).
Election forecasting
The technique of election forecasting will be used to test these two competing hypotheses. The theoretical foundation of this technique is that the electoral result of a political party can be seen as the result of a popularity function and economic circumstances (Beck 2005; Lewis-Beck and Jêrôme 2010; Lewis-Lewis-Beck and Tien forthcoming). The first paper that tried to forecast election results in a theoretically based way, was published in 1950 (Whiteley et al. 2011). Since then, there has been a boom of election forecasting models in the United States. Europe, on the other hand, is somewhat lagging behind in the application of this technique. Only in some of the major European democracies forecasting models have been developed (Beck 2005; Lewis-Beck and Jêrôme 2010). Those efforts show that forecasting models have to be adapted to the specific electoral context of each country (Bellucci 2010; Fisher et al. 2011; Lebo and Norpoth 2006; Nadeau et al. 2010; Norpoth 2004; Norpoth and Gschwend 2010). While there are now a number of election forecasting studies available for Europe, these tend to remain concentrated on two party-systems.
The popularity function in this model is routinely operationalized by including information about electoral or political polls. This, however, is also one of the main points of criticism toward this technique. First, not all political systems have access to reliable time series of public opinion polls, and this reduces the potential scope of this technique rather dramatically. Furthermore, we also know that the quality of commercially available polls tends to vary quite strongly depending on the professional standards of the polling agency involved (Fisher et al. 2011). Given the theoretical claims of the literature, this dependency on the quality of commercially available data is troublesome, and there is a need to have access to an alternative operationalization of the popularity function.
In this article, we propose therefore to operationalize the popularity function in the equation by figures on party membership, a step that thus far has not been taken in this emerging line of the literature. This step has two major advantages. First, there is a theoretical relevance, as it allows us to assess whether party membership is indeed related to the popularity of a party in society at large. Does the number of party members inform us about the anchorage of a political party within society? Second, there is a methodological advantage. The main criticism toward the current use of prediction techniques is that they are to some extent tautological, as they use election polls to ‘predict’ real elections. If, however, we replace election polls by party membership as an independent variable, tautological relations are no longer present, and this strengthens some of the claims that have been made with regard to the theoretical validity of these models.
It has to be noted in this regard, that the technique of election forecasting is clearly rooted in the literature on economic voting (Lewis-beck and Stegmaier 2007). Following the tradition inaugurated by V.O. Key (Key 1966), the incumbent party or candidate is believed to be rewarded for economic prosperity and punished for an economic downturn (Lewis-Beck 2006). The central equation for most forecasting models is therefore:
Voteincumbent = Popularityincumbent + Economy + error [Eq. 1]
As the incumbent’s vote share is seen as a linear function of both elements, the model can be estimated by means of an Ordinary Least Squares regression (Lewis-Beck 2005).
The model only applies to incumbent parties that can be credited, or blamed for economic shifts (Anderson 2007). The most straightforward use of the model, therefore occurs in two-party systems, where one political party is incumbent, and the other is seen as the opposition or
challenging party. Applying the model in more complicated party systems, entails a number of problems and challenges (Bélanger et al. 2010). For most voters, accountability is much more difficult to assess if they are confronted with coalition governments (Arzheimer and Evans 2010). As a consequence, forecasts within multiparty systems usually focus on one single party, either the lead party or another party. Another question is whether all relevant parties can be included in a single forecasting model. In the current paper, we opt for an equation in which the dependent variable is the vote share of each incumbent, i.e., governing coalition party separately. We do not include the summed vote share of the parties in office, but we include all parties as individual cases. The unit of observation is thus the electoral score of one specific incumbent party during a specific election. By including several parties per election, we arrive at a sufficient number of observations to develop a stable forecasting model.
Within the federal country of Belgium there are two completely segregated electoral and party systems. With the exception of the inhabitants of the bilingual greater Brussels area, Belgian citizens can only vote for political parties of their own language group (Deschouwer 2009). For the sake of clarity, we only include one party system in this study, the Dutch-language region. Not only is this the largest community within Belgium (ca. 60 per cent of the population), furthermore since 1974 the Prime Minister of the country has always been a Dutch-speaking politician, so for the inhabitants of this region it should be more straightforward to assess who can be held “responsible” for conducting government affairs. Moreover, a focus on one region allows us to include regional election results in the dataset, enlarging the number of cases for the analysis. Within the Belgian federal system, regional elections are considered first order elections. When regional and federal elections are organized on the same day, the parties’ vote shares for both levels are remarkably similar (Deschouwer 2009).1
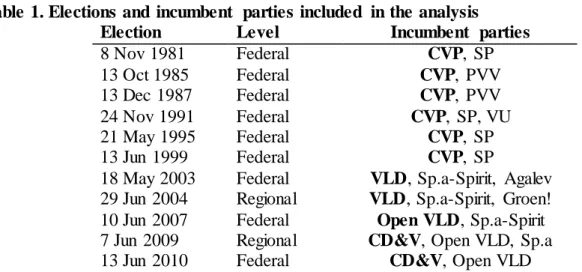
For the dependent variable we focus on the vote shares of Dutch language incumbent parties, either in federal or in regional elections. Because the Belgian electoral system is quite proportional, forecasting vote shares as such is relevant and useful. There is no need to include an extra step and to forecast seats in parliament (Fisher et al. 2011). As we have time series available since 1981, all electoral scores of incumbent parties during the past three decades (n= 26) can be included in the model. The elections included are the federal elections of 1981, 1985, 1987, 1991, 1995, 1999, 2003, 2007 and 2010. Moreover we add the regional elections of 2004 and 2009. When regional and federal elections were organized on the same day (this was the case for the elections of 1995 and 1999), we included only the federal election results. The parties included are those that belonged to the governing coalition before election day. It has to be observed that during this period, the majorities on the federal and the regional level were identical, so that for the model, and for most voters, it should not be a problem to determine who were the incumbent parties (Table 1).2 In total this means we have 26 observations of incumbent
political parties, during the period 1981-2010.
Table 1. Elections and incumbent parties included in the analysis
Election Level Incumbent parties
8 Nov 1981 Federal CVP, SP 13 Oct 1985 Federal CVP, PVV 13 Dec 1987 Federal CVP, PVV 24 Nov 1991 Federal CVP, SP, VU 21 May 1995 Federal CVP, SP 13 Jun 1999 Federal CVP, SP
18 May 2003 Federal VLD, Sp.a-Spirit, Agalev 29 Jun 2004 Regional VLD, Sp.a-Spirit, Groen! 10 Jun 2007 Federal Open VLD, Sp.a-Spirit 7 Jun 2009 Regional CD&V, Open VLD, Sp.a
13 Jun 2010 Federal CD&V, Open VLD
Party in bold: party of the Prime Minister. CVP and CD&V: Christian -Democrats, PVV and (Open) VLD: Liberals; SP and SP.a(-Spirit): Socialists; Agalev and Groen: Greens. Source: Deschouwer 2009.
Constructing the model
Following the assumptions of election forecasting, we need information about a popularity function and an objective economic indicator to be able to predict the vote share of incumbent parties. In accordance with our main research question, and in order to test the impact of party membership, we first use the absolute number of party members for every party that is included. These data were obtained from the study by Quintelier and Hooghe (2010), building on the documents that were published every year in the Belgian political science journal Res Publica. These figures were obtained directly from the administrative staff of the Belgian political parties. Although in that case there are of course concerns about the reliability of these figures, within the Belgian political science community they are usually regarded as highly reliable. First, these data are collected every year for over a thirty year period by now, and they do not show any discontinuities, despite the fact that the administrative staff of most political parties has changed several times in that period. If political parties exaggerate their membership figures, they at least do so in a remarkably consistent manner over a thirty year period. Second, for most of the major political parties, a downward trend can be observed, and there are no indications that political parties try to cover up this trend. Therefore, there are no reasons to believe that membership figures would be highly unreliable in the Belgian context.
If we assume that party members provide a linkage mechanism for political parties, ideally the measurement of the number of members should precede the electoral outcome. As there are no theoretical grounds to prefer a specific time lag, we conducted an empirical test to assess what time lag produces the strongest results. Therefore we developed a limited regression model, where we try to explain the 26 election results under observation for the membership figures with varying time lag (ranging between 0 and 4 years).
Table 2 lists the estimates of linear regression models between party membership figures and the election results. There is a declining trend of party membership figures within Belgium (Quintelier and Hooghe 2010). Because this declining trend might distort the effects of membership on election outcomes and because party popularity implies a comparison with other political parties we make use of relative party membership figures. By doing so, we can make sure that the general downward trend with regard to membership figures in Belgium does not play a role anymore in the analysis. For each party we calculate the share of party members on the total number of party members in a certain year (M). Separate regression models with membership measured at various times all produce a similar r²-value (ca. 0.680). Therefore we can conclude that using a different time lag for the membership-variable does not have a clear impact on the model fit. Since we only have membership figures from 1980 onwards, we lose some observations when we set the time lag at two years or more.3 As our aim is to develop a
forecasting model, there should be at least some time lag between the independent variable and the election result (Gibson and Lewis-Beck 2011). When we include membership information from the same year as the election, this might not always be the case. Therefore, we will use party membership measured one year before the election year (E-1) as the key popularity variable in our forecasting model.
Table 2. Optimal time lag between party membership and election results
Independent variable r² SEE B p-value N
M of election year (E) 0.694 4.074 0.642 0.000 26
M of E-1 year 0.681 4.159 0.646 0.000 26
M of E-2 years 0.687 4.059 0.638 0.000 23
M of E-3 years 0.659 4.378 0.612 0.000 22
M of E-4 years 0.668 4.320 0.602 0.000 22
Entries are the results of regression models with each time one independent variable. Dependent: election results of incumbent parties. M is the party membership figure divided by thousand. E= election year. Data can be found in appendix.
As we aim to develop a valid forecasting model, our main analysis is limited to incumbent parties. Over the past decades, it was mostly the larger and traditional parties Christian Democrats, Socialists and Liberals that were in government, however. One might question whether this overrepresentation of the larger parties does not distort the overall picture and whether the strong correlation between party membership and electoral results also holds for smaller and fringe parties. In that account it has to be noted that Greens and nationalists were also included whenever they were in government. Further, in order to judge the validity of the party membership variable as an explanatory variable for electoral results, we also tested the correlation between party membership and vote shares for all parties. These correlations now, were about equally strong as those when we limited the analysis to incumbent parties.4 We can
therefore conclude that the strong correlation between party membership and electoral results apparent in our analysis is not due to the cases selected (incumbents) for the analysis.
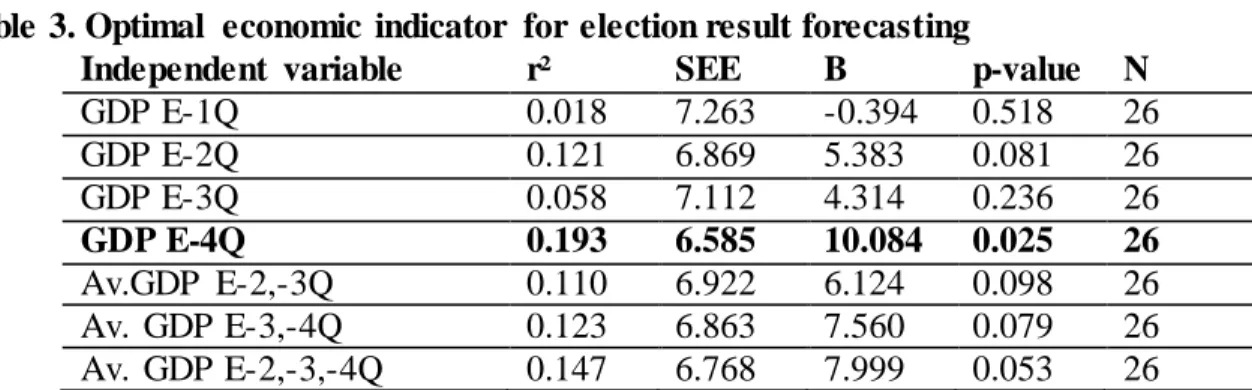
In order to include a valid economic assessment indicator, we proceed in more or less the same manner, where we include GDP growth rates (quarterly accounts measured as price indices) measured with different time lags (Table 3).5 We include national GDP rates, this is consistent
with the information most voters will receive by means of mass media reports (Geys and Vermeir 2008). As can be seen in Table 3 only the growth rate from the fourth quarter before the election proved significantly related to incumbent parties’ vote shares. Because we want to control for the impact of sudden economic crises or growth, we also tested the relation between the average GDP growth rate of different quarters and vote shares. As can be seen in Table 3, a regression with the average GDP growth rate of the second, third and fourth quarter before the election quarter results in a p-value of 0.053. As our hypothesis is one-directional, this might be considered a significant result as well.
Table 3. Optimal economic indicator for election result forecasting
Independent variable r² SEE B p-value N
GDP E-1Q 0.018 7.263 -0.394 0.518 26 GDP E-2Q 0.121 6.869 5.383 0.081 26 GDP E-3Q 0.058 7.112 4.314 0.236 26 GDP E-4Q 0.193 6.585 10.084 0.025 26 Av.GDP E-2,-3Q 0.110 6.922 6.124 0.098 26 Av. GDP E-3,-4Q 0.123 6.863 7.560 0.079 26 Av. GDP E-2,-3,-4Q 0.147 6.768 7.999 0.053 26
Entries are the results of regression models with each time one independent variable. Dependent: election results of different incumbent parties. GDP is the quarterly seasonally adjusted GDP growth rate, it is entered for one, two, three and four quarters before the election quarter respectively. Further, averages of different quarterly rates are included (indicated by Av.). E= election year. Source: Eurostat (see Appendix).
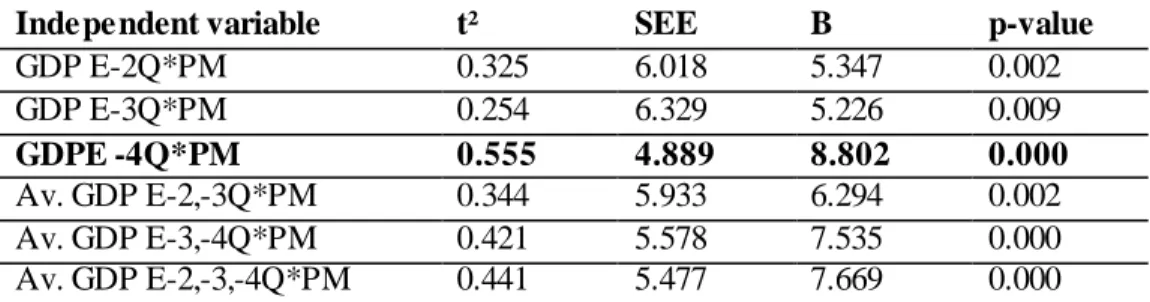
For the empirical tests in Table 3, we treated every incumbent party as equally accountable for the economy. It should be remembered, however, that in multiparty systems with coalition governments, meeting some of the standard assumptions within economic voting theory on accountability is not always straightforward (Nadeau et al. 2002; Powell and Whitten 1993). More specifically, it is not clear whether voters will attribute the responsibility for the state of the economy equally to senior and junior coalition partners. During the observation period, the largest partner in the governing coalition always was the party of the Prime Minister, thus further contributing to the visibility of that party. It is likely to assume, therefore, that mainly the party of the Prime Minister will be held responsible for the state of the economy. Research in Britain has shown that approval ratings are linked to satisfaction with the prime minister rather than to satisfaction with government as such. This indicates that the prime minister can account for a more straightforward mechanism of rewarding and punishing by the voters (Lebo and Norpoth 2011). To test whether this effect occurs, we allowed for an interaction effect between the GDP figure and whether or not the incumbent party was also the party of the Prime Minister (PM). As is clear in Table 4, all interaction terms are significantly related to incumbent parties’ vote
growth rate from the fourth quarter before the election quarter (r²=0.555). This finding leads us to include this variable, and the corresponding interaction effect, into our forecasting model.
Table 4. Optimal economic indicator – interaction effects
Independent variable t² SEE B p-value
GDP E-2Q*PM 0.325 6.018 5.347 0.002 GDP E-3Q*PM 0.254 6.329 5.226 0.009 GDPE -4Q*PM 0.555 4.889 8.802 0.000 Av. GDP E-2,-3Q*PM 0.344 5.933 6.294 0.002 Av. GDP E-3,-4Q*PM 0.421 5.578 7.535 0.000 Av. GDP E-2,-3,-4Q*PM 0.441 5.477 7.669 0.000
Entries are the results of regression models with each time one independent variable. Dependent: election results of incumbent parties. GDP is the quarterly seasonally adjusted GDP growth rate, it is entered for two, three and four quarters before the election quarter (=E) respectively. Further, averages of different quarterly rates are included (indicated by Av.). PM is a dummy, value two for the party of the prime minister and one for the other incumbent parties. Source: Eurostat, see appendix.
The empirical tests already showed that the indicator that produces the strongest results is the GDP growth rate four quarters before the election quarters (Table 3). Moreover, the interaction terms (with the PM dummy) performed even better and are strongly correlated to the incumbent’s vote shares. Therefore, in line with the option taken by Lewis-Beck and Tien (2004), we include the economic indicator (GDP E-4Q) for the forecasting model as an interactive and not as an additive term into the model.
Forecasting model
Estimation
Having found a macro-economic indicator that is significantly related to the election scores of incumbent parties and having established that membership is a good predictor for parties’ vote shares, we now proceed with the forecasting model, that takes the form:
Vote Share Incumbent Parties = M + (GDP x PM) + error [Eq. 2]
Where M is the percentage of party members for a particular party on the total number of party members within Flanders one year before the election. GDP is the seasonally adjusted GDP growth rate from the fourth quarter before the election quarter. PM is a dummy for the position of a party within government. Its value is 2 for the party of the prime minister and 1 otherwise. The vote shares of incumbent parties in the 1981 to 2010 elections were used for developing the model.
In a next step we estimate the model by means of an ordinary least squares regression. The estimates for the coefficients of the variables in the regression are then used to create the forecasting equation. The model for forecasting the electoral results of the incumbent parties is:
Vote Share Incumbent Parties = 2.324 + .475 M*** + 5.063 (GDP*PM)*** [ Eq. 3]
(1.240) (6.047) (4.241)
Adj. r² = 0.813; SEE = 3.103; D-W = 2.018; N = 26; MAE = 2.480
The numbers between parentheses are t-ratios. Sign.: ***=< 0.001; **=<0.01; *= <0.05 (one-tailed test)
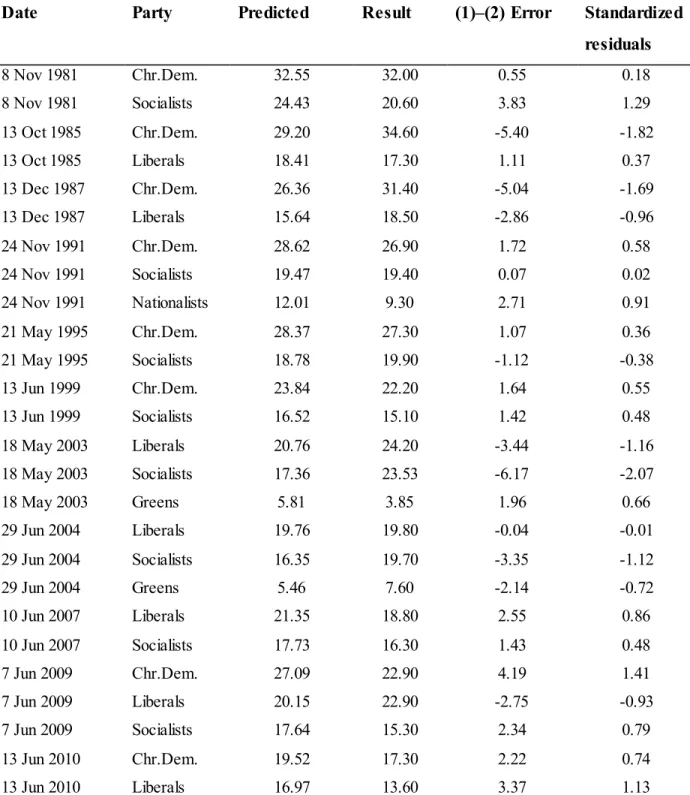
Based on the results of Equation 3, we now can predict for every one of our 26 observations the vote share of that party (Table 6). In the last column we include standardized residuals, as can be noted one prediction lies more than two standard deviations outside the expected value. The predictions of the Socialist result of 2003 can thus be considered as an outlier.
Table 6. Forecasting Electoral Results of Incumbent Parties
Date Party Predicted Result (1)–(2) Error Standardized
residuals 8 Nov 1981 Chr.Dem. 32.55 32.00 0.55 0.18 8 Nov 1981 Socialists 24.43 20.60 3.83 1.29 13 Oct 1985 Chr.Dem. 29.20 34.60 -5.40 -1.82 13 Oct 1985 Liberals 18.41 17.30 1.11 0.37 13 Dec 1987 Chr.Dem. 26.36 31.40 -5.04 -1.69 13 Dec 1987 Liberals 15.64 18.50 -2.86 -0.96 24 Nov 1991 Chr.Dem. 28.62 26.90 1.72 0.58 24 Nov 1991 Socialists 19.47 19.40 0.07 0.02 24 Nov 1991 Nationalists 12.01 9.30 2.71 0.91 21 May 1995 Chr.Dem. 28.37 27.30 1.07 0.36 21 May 1995 Socialists 18.78 19.90 -1.12 -0.38 13 Jun 1999 Chr.Dem. 23.84 22.20 1.64 0.55 13 Jun 1999 Socialists 16.52 15.10 1.42 0.48 18 May 2003 Liberals 20.76 24.20 -3.44 -1.16 18 May 2003 Socialists 17.36 23.53 -6.17 -2.07 18 May 2003 Greens 5.81 3.85 1.96 0.66 29 Jun 2004 Liberals 19.76 19.80 -0.04 -0.01 29 Jun 2004 Socialists 16.35 19.70 -3.35 -1.12 29 Jun 2004 Greens 5.46 7.60 -2.14 -0.72 10 Jun 2007 Liberals 21.35 18.80 2.55 0.86 10 Jun 2007 Socialists 17.73 16.30 1.43 0.48 7 Jun 2009 Chr.Dem. 27.09 22.90 4.19 1.41 7 Jun 2009 Liberals 20.15 22.90 -2.75 -0.93 7 Jun 2009 Socialists 17.64 15.30 2.34 0.79 13 Jun 2010 Chr.Dem. 19.52 17.30 2.22 0.74 13 Jun 2010 Liberals 16.97 13.60 3.37 1.13
Entries are the result of the regression model in Eq. 3. First: predicted result, second: real election result (source: Ministry of the Interior); next column: difference between predicted and observed resu lt, all in per cent of the vote and a standardized residual.
Although the model is based on only two independent variables, the predictions fare quite well. The percentage of party members belonging to a certain party informs us quite strongly about the likely election results of a political party in the subsequent year. Economic indicators, too, prove to have a significant effect on electoral results for incumbent parties, but that effect is clearly weaker than the information about the number of party members. The information on these two variables is sufficient to arrive at predictions with a mean absolute error of 2.480, which can be considered as very convincing.
As was already stated, most election forecasting models use election polls to operationalize the popularity function in the model. In line with the argument that party membership provides a linkage mechanism between the party and society as a whole, in this analysis we used information about party membership as an operationalization of that popularity function. The model performed remarkably well, with an explained variance of 81.3 per cent. In line with the linkage argument, put forward most strongly by Scarrow (1996), it can be observed that information about the membership base allows us to predict the electoral result of an incumbent party quite accurately.
In order to assess whether party membership is indeed a good substitute for the popularity function, we compare the performance of this model with a more straightforward replication of the Lewis-Beck government-approval model. Therefore we developed a model that includes, besides our central economic variable, polling results as the popularity function.6 Poll results are
derived from La Libre Belgique, as this newspaper provides the longest time series in election polls within Belgium. This newspaper holds a poll about vote intentions every three months since 1984 (we thus lose the two oldest cases for the analysis). We estimate the model by means of
polling results from approximately three months before the election (see Equation 4 below). As such, this time lag is comparable to what Lewis-Beck (2005) proposes.
Vote Share Incumbent P arties = 0.060 + .798 Poll*** + 4.022 (GDP*PM)** [Eq. 4] (0.032) (7.356) (3.106)
Adj. r² = 0.861; SEE = 2.741; D-W = 2.390; N = 24; MAE = 1.986
The numbers between parentheses are t-ratios. Sign.: ***=< 0.001; **=<0.01; *= <0.05 (one-tailed test)
Comparing our initial model that included party membership figures (Equation 3) with a model that includes polling results (Equation 4) further stresses the relevance of party membership figures in a forecasting model. Although the model that included polling results performed slightly better than the party membership model (higher adjuster R² and a lower MAE), both models are comparable and competitive. After this test we can conclude that party membership figures constitute a valid proxy for party popularity. Therefore, in countries where neither government approval figures nor valid polling results are available, party membership figures can be a good alternative as the popularity function in forecasting models.
The fact that we can rely on a three decade time series, on the one hand strengthens our results, as it is clear that these figures are not driven by some unique fluctuations. On the other hand, it might be argued that we only can observe an average relation, over the entire period, and that during those three decades the effect of party membership might have weakened, in accordance with the thesis that parties do become electoral-professional organizations. We therefore conducted an additional test, to assess whether the predictive power of our two independent variables becomes weaker over time. We calculated the correlation between the absolute errors of the forecasting model and the election year (1981=0; 2010= 29). This correlation is not significant (Table 7), meaning that the predictive power of the forecasting model does not decline
or increase in a significant manner over time. This test still cannot be considered as an absolute proof of the stability of the relation between membership and election results, as a declining predictive power of membership might be compensated by an increasing importance of the economy or vice versa. Therefore we also calculated correlation coefficients for the errors of forecasts with only membership (M) and the economic variable (GDP*PM) respectively with the time variable. Here too, nothing reaches conventional levels of significance. As can be observed, the errors resulting from the limited model with only party membership included as an independent variable, even tend to become smaller over time. Although this trend is not significant, we can observe that apparently party membership now allows us to make more successful predictions of electoral results than three decades ago. In any case: we do not find any indication whatsoever that party membership would become less important over time. As such this tests confirms the hypothesis about the continued importance of party membership for political parties (Scarrow 1996).
Table 7. Pearson correlations between forecasting models absolute errors and time
Model Correlation p
Error of the full model 0.033 ns 0.872 Error of the membership only model -0.177 ns 0.387 Error of the economy only model 0.054 ns 0.793
Entries are the correlation between the absolute errors resulting from a specific model, and the year of the elections (1981=0; 2010=29). N=26.
Diagnostics of the model
When using election forecasting techniques, it is customary to include robustness tests to ascertain the validity of the findings. Usually, this is done by using out-of sample predictions. By doing so, one assesses whether the model performs as good with a smaller sample size, and this helps us to ensure that results are not dependent on some outliers. As we want to assess whether
party membership can still be considered a valid predictor for electoral results, we leave the oldest cases out of the sample. We then estimate the model again with limited sample size (Table 8).
Table 8. Out-of-sample diagnostics without oldest elections
Period Sample size Adj. r² SEE MAE reduced model
1985-2010 24 0.803 3.122 2.551
1987-2010 22 0.794 2.965 2.366
1991-2010 20 0.811 2.698 2.043
1995-2010 17 0.794 2.911 2.277
Entries are test statistics for the model, while eliminating the oldest election results.
As can be observed in Table 8, eliminating the oldest election results does not have an impact on the predictions, and we can conclude that models are robust in this regard.
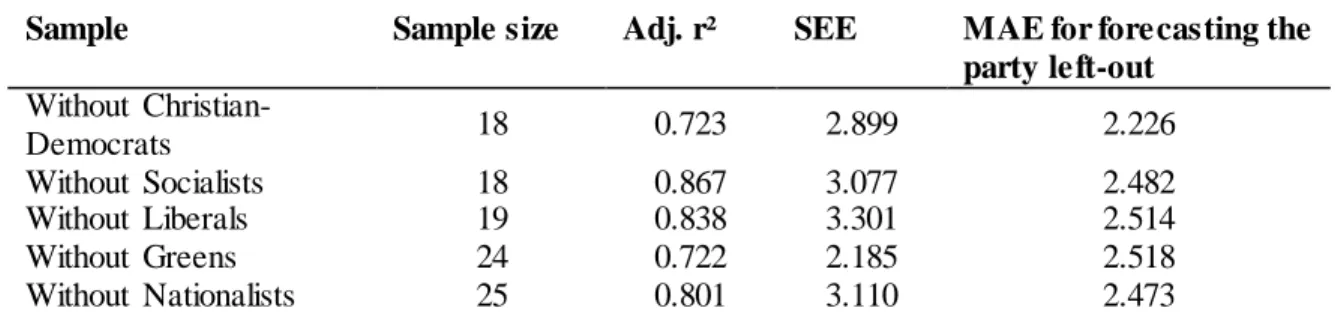
A second test is based on the same logic, but this time we leave out one specific political party (Table 9).
Table 9. Out-of-sample diagnostics and prediction errors when parties are left out
Sample Sample size Adj. r² SEE MAE for forecasting the
party left-out Without Christian-Democrats 18 0.723 2.899 2.226 Without Socialists 18 0.867 3.077 2.482 Without Liberals 19 0.838 3.301 2.514 Without Greens 24 0.722 2.185 2.518 Without Nationalists 25 0.801 3.110 2.473
Entries are test statistics for the model, while eliminating a specific political party.
Again, the model appears to be quite stable and we do not observe a substantial rise in the errors of the predictions. The model fit of the election forecasting model for Flemish incumbent parties is thus not dependent on one or more political parties.
Discussion
Do political parties still have an interest in investing in their membership? Authors like Susan Scarrow and Paul Whiteley have argued that members still provide a strong linkage mechanism to political parties, and as such cannot be replaced by more modern campaign techniques. The empirical evidence for this ‘nostalgic’ look on the era of mass parties, however, thus far has remained rather limited. In this article we have demonstrated that figures on party membership allow us to predict electoral outcomes quite precisely, at least for incumbent political parties. This suggests that members do remain important as an electoral linkage mechanism for political parties. Since we considered figures for the entire 1981-2010 period, we can even demonstrate quite clearly that during these three decades, the importance of membership figures has not declined at all. Apparently, members remain as important as ever for Belgian political parties.
A number of caveats are in order, however. It has to be remembered that the technique of election forecasting can only be used for incumbent political parties, as they, at least to some degree, can be held responsible for economic conditions. The opposite claim, that opposition parties would be rewarded for an economic downturn is not automatically warranted in the theory of economic voting. Our conclusions, therefore, apply only to coalition parties, and we do not know for the moment if opposition parties are equally vulnerable for the effects of losing members. It also has to be noted that our analysis is heavily dominated by three traditional political parties, that are responsible for the bulk of the incumbent parties in Belgium. Especially Socialists and Christian Democrats tend to be in decline, but it has to be remarked that the Liberals have hold their ground, both with regard to membership and percentage of the votes. Our results, therefore, are not the result of a general downward trend for these political parties. Nevertheless, it would be useful to investigate in other political systems whether our model is also successful in countries
where strong or emerging parties are more strongly represented in governing coalitions. Third, this test was only conducted within the Dutch-speaking party system in Belgium, and additional tests are surely necessary if we want to determine whether our findings can be generalized toward other contexts.
Nevertheless, we do believe that this approach also has a number of merits. Thus far, election forecasting models were dependent on election polls to operationalize the popularity of a political party. The current tests suggests that party membership figures are equally appropriate as a test for the popularity of a party. Theoretically, this is highly relevant as it indeed suggests that the loss of members can be equated with a loss of popularity for a political party. Again, this drives home the point that members do remain crucially important for political parties. Furthermore, this approach can help us to solve one of the weak points of the forecasting approach, i.e., that election polls are used to predict election results. If reliable party membership figures are available, these can be easily integrated in the forecasting models. As such, these findings also strengthen the theoretical assumptions of the use of election forecasting models.
References
Anderson, Christopher J. (2007) 'The End of Economic Voting? Contingency Dilemmas and the Limits of Democratic Accountability', Annual Review of Political Science 10(1):271-296.
Arzheimer, Kai and Jocelyn Evans (2010) 'Bread and Butter À La Française: Multiparty Forecasts of the French Legislative Vote (1981-2007)', International Journal of Forecasting 26(1):19-31.
Bélanger, Éric, Richard Nadeau and Michael S Lewis-beck (2010) 'Forecasting the Vote for a Third Party: The British Liberals , 1974 – 2005', British Journal of Politics & International Relations
12(4):634-643.
Bellucci, Paolo (2010) 'Election Cycles and Electoral Forecasting in Italy, 1994-2008', International
Journal of Forecasting 26(1):54-67.
Dalton, Russell, Ian McAllister and Martin Wattenberg (2000) 'The Consequences of Partisan
Dealignment', in Parties without Partisans, eds. Russel Dalton and Martin Wattenberg. Oxford: Oxford University Press.
Deschouwer, Kris (2009) The Politics of Belgium. Governing a Divided Society. Basingstoke: Palgrave Macmillan.
Farrell, David (1996) 'Campaign Strategies and Tactics', in Comparing Democracies, eds. Lawrence LeDuc, Richard Niemi and Pippa Norris. Thousand Oaks: Sage.
Fisher, Stephen, Robert Ford, Will Jennings, Mark Pickup and Christopher Wlezien (2011) 'From Polls to Votes to Seats: Forecasting the 2010 British General Election', Electoral Studies 30(2):250-257. Geys, Benny and Jan Vermeir (2008) "Institutions, Economic Performance and Political Support: New
Evidence from Belgium, 1984-2007." Wissenschaftszentrum Berlin.
Gibson, Rachel and Michael Lewis-Beck (2011) 'Methodologies of Election Forecasting: Calling the 2010 UK "Hung Parliament"', Electoral Studies 30(2):247-249.
Hooghe, Marc, Bart Maddens and Jo Noppe (2006) 'Why Parties Adapt. Electoral Reform, Party Finance and Party Strategy in Belgium', Electoral Studies 25(2):351-368.
Katz, Richard and Peter Mair (1995) 'Changing Models of Party Organization and Party Democracy. The Emergence of the Cartel Party', Party Politics 1(1):5-28.
Katz, Richard and Peter Mair (2009) 'The Cartel Party Thesis: A Restatement', Perspectives on Politics 7(4):753-766.
Key, V.O. (1966) The Responsible Electorate: Rationality in Presidential Voting 1936-1960. Cambridge: Belknap Press.
Knut, Heidar and Jo Saglie (2003) 'A Decline of Linkage? Intra-Party Participation in Norway, 1991-2000', European Journal of Political Research 42(6):761-788.
Lebo, Matthew J and Helmut Norpoth (2006) 'The Pm and the Pendulum : Dynamic Forecasting of British Elections', British Journal of Political Science 37(1):71-87.
Lebo, Matthew and Helmut Norpoth (2011) 'Yes, Prime Minister: The Key to Forecasting British Elections', Electoral Studies 30(2):258-263.
Lewis-Beck, Michael (2005) 'Election Forecasting: Principles and Practice', British Journal of Politics and
International Relations 7(2):145-164.
Lewis-Beck, Michael (2006) 'Does Economics Still Matter? Econometrics and the Vote', The Journal of
Politics 68(1):208-212.
Lewis-Beck, Michael and Bruno Jêrôme (2010) 'European Election Forecasting: An Introduction',
International Journal of Forecasting 26(1):9-10.
Lewis-Beck, Michael and Mary Stegmaier (2007) 'Economic Models of Voting', in The Oxford Handbook
of Political Behavior, eds. Russell Dalton and H.-D. Klingeman. Oxford: Oxford University Press.
Lewis-Beck, Michael S and Charles Tien (forthcoming) 'Election Forecasting', in Oxford Handbook on
Economic Forecasting, eds. Michael Clements and David Hendry. New York: Oxford University
Press.
Mair, Peter and Ingrid van Biezen (2001) 'Party Membership in Twenty European Democracies, 1980-2000', Party Politics 7(1):5-21.
Nadeau, Richard, Michael Lewis-Beck and Éric Bélanger (2010) 'Electoral Forecasting in France: A Multi-Equation Solution', International Journal of Forecasting 26(1):11-18.
Nadeau, Richard, Richard Niemi and Antoine Yoshinaka (2002) 'A Cross-National Analysis of Economic Voting: Taking Account of the Political Contexts across Time and Nations', Electoral Studies 21(3):403-423.
Norpoth, Helmut (2004) 'Forecasting British Elections: A Dynamic Perspective', Electoral Studies 23(2):297-305.
Norpoth, Helmut and Thomas Gschwend (2010) 'The Chancellor Model: Forecasting German Elections',
International Journal of Forecasting 26(1):42-53.
Panebianco, Angelo (1988) 'Political Parties. Organizations and Power'. Cambridge: Cambridge University Press.
Powell, G. Bingham and Guy D. Whitten (1993) 'A Cross-National Analysis of Economic Voting: Taking Account of the Political Context', American Journal of Political Science 37(2):391-414.
Quintelier, Ellen and Marc Hooghe (2010) "Party Membership Figures for the Flemish Region, 1981-2000." Leuven: University of Leuven.
Scarrow, Susan (1996) Parties and Their Members. Organizing for Victory in Britain and Germany. Oxford: Oxford University Press.
Scarrow, Susan (2000) 'Parties without Members? Party Organizations in a Changing Electoral
Environment', in Parties without Partisans, eds. Russel Dalton and Martin Wattenberg. Oxford: Oxford University Press.
Scarrow, Susan and Burcu Gzegor (2010) 'Declining Memberships, Changing Members? European Political Party Members in a New Era', Party Politics 16(6):823-843.
Spier, Tim and Ulrich von Alemann (2008) 'Parteimitglieder Nac Dem "Ende Der Mitgliederpartei". Ein Überblick Über Forschungsergebnisse Für Westeuropa Seit 1990', Österreichische Zeitschrift für
Politikwissenschaft 37(3):29-44.
Whiteley, Paul (2009) 'Were Have Alle the Members Gone? The Dynamics of Party Membership in Britain', Parliamentary Affairs 62(2):242-257.
Whiteley, Paul (2011) 'Is the Party Over? The Decline of Party Activism and Membership across the Democratic World', Party Politics 17(2):21-44.
Whiteley, Paul, David Sanders, Marianne Stewart and Harold Clarke (2011) 'Aggregate Level Forecasting of the 2010 General Election in Britain: The Seats-Votes Model', Electoral Studies 30(2):278-283. Whiteley, Paul and P. Seyd (1998) 'The Dynamics of Party Activism in Britain', British Journal of
Endnotes
1. Since the electoral systems in both linguistic communities of the country are completely segregated, in the current
article we limit ourselves to the Dutch language community, as the Prime Minister of Belgium has been Dutch -speaking during the entire observation period. In an alternative model, we also including the French -speaking parties. Results from these preliminary analyses suggest that for the Francophone parties too, the economic function is clearly important. Assigning the “PM-function” to a Francophone party, on the other hand, proved to be more cumbersome, and in every scenario led to a weakening of the explained variance. Therefore, in the current manuscript we decided to limit ourselves to one party system.
2. It has to be noted that in 2007 the Christian-Democrats already were the governing party in the Flemish regional
government, so for some voters it might not be clear anymore that they were an opposition party at the Federal level. Eliminating the 2007 results from the analysis did indeed lead to a stronger model (adj. r2 .851), but it did not change the overall conclusion from the analysis. It has to be noted that up to the 2004 elections, all Federal and regional governments in Belgium were symmetrical, so this potential source of confusion could not have arisen earlier
3. For the analyses with a larger time lag, we also missed party membership figures for the newer parties and thus for
cartels with these new parties too.
4. M of E: R² = 0.67 (N=66); M of E-1: R²=0.66 (N=65); M of E-2: R²=0.63 (N=59); M of E-3: R²=0.61 (N=58); M
of E-4: R²= 0.58 (N=55)
5. Some vote forecasting models also rely on unemployment rates to assess the economic situation. In an alternative
operationalization, we also included regional unemployment rates, but these figures did not lead to clear results in the analysis.
6. The central forecasting model within literature makes use of government approval data. Such data are not available
for the Belgian context, however.
Acknowledgements
We would like to thank the anonymous reviewers of this journal for their comments and constructive suggestions.