HAL Id: hal-00724397
https://hal.archives-ouvertes.fr/hal-00724397
Submitted on 20 Aug 2012
HAL is a multi-disciplinary open access
archive for the deposit and dissemination of
sci-entific research documents, whether they are
pub-lished or not. The documents may come from
teaching and research institutions in France or
abroad, or from public or private research centers.
L’archive ouverte pluridisciplinaire HAL, est
destinée au dépôt et à la diffusion de documents
scientifiques de niveau recherche, publiés ou non,
émanant des établissements d’enseignement et de
recherche français ou étrangers, des laboratoires
publics ou privés.
Rating on Quality of Experience Scale
Kun Wang, Marcus Barkowsky, Kjell Brunnström, Marten Sjöström, Romain
Cousseau, Patrick Le Callet
To cite this version:
Kun Wang, Marcus Barkowsky, Kjell Brunnström, Marten Sjöström, Romain Cousseau, et al..
Per-ceived 3D TV Transmission Quality Assessment: Multi-Laboratory Results Using Absolute Category
Rating on Quality of Experience Scale. IEEE Transactions on Broadcasting, Institute of Electrical
and Electronics Engineers, 2012, 58 (4), pp.544-557. �10.1109/TBC.2012.2191031�. �hal-00724397�
Perceived 3D TV Transmission Quality Assessment:
Multi-Laboratory Results Using Absolute Category
Rating on Quality of Experience Scale
Kun Wang, Marcus Barkowsky, Member, IEEE, Kjell Brunnström, Mårten Sjöström, Member, IEEE,
Romain Cousseau, and Patrick Le Callet, Member, IEEE
Abstract—Inspired by the rapidly increasing popularity of 3D
movies, there is an industrial push for 3DTV services to the home. One important factor for the success and acceptance by the viewers is a positive quality of experience (QoE) of the new service when delivered. The questions of how to efficiently deliver 3DTV service to the home, and how to evaluate the visual quality perceived by end users are a recent research focus. We have investigated users’ experience of stereoscopic 3D video quality by preparing two sub-jective assessment datasets. The first dataset aimed at the evalu-ation of efficient transmission in the transmission error free case, while the second focused on error concealment. A total of three subjective assessments, two for first dataset and one for the second, were performed using the Absolute Category Rating with Hidden unimpaired Reference video (ACR-HR) method. The experimental setup allows to show that the ACR-HR subjective method pro-vides repeatable results across labs and across conditions for video quality. It was also verified that MVC is more efficient than H.264 simulcast coding. Furthermore it was discovered that based on the same level of quality of experience spatial down-sampling may lead to better bitrate efficiency while temporal down-sampling is not ac-ceptable. When network impairments occur, traditional error 2D concealment methods need to be reinvestigated as they were out-performed by displaying the same view for both eyes (switching to 2D presentation).
Index Terms—3DTV, error concealment, QoE, subjective ex-periment methodology, subjective video quality assessment, video coding.
I. INTRODUCTION
T
HREE DIMENSIONAL (3D) videos are riding their suc-cess from cinema to home entertainment markets such as TV, DVD, Blu-ray, video games, etc. There is an industrialManuscript received December 05, 2011; revised February 27, 2012; ac-cepted March 01, 2012. This work has been conducted in part within the scope of the Just Explore Dimension (JEDI) ITEA2 Project, which is supported by the French industry ministry through DGCIS. In Sweden, the work was supported in part by VINNOVA (The Swedish Governmental Agency for Innovation Sys-tems), ECOC foundation, Knowledge Foundation, the EU European Regional Development Fund, Mellersta Norrland, and by Länsstyrelsen Västernorrland.
K. Wang is with the Acreo AB, Department of NetLab, Electrum 236, Kista, 16440, Sweden, and also with the Mid Sweden University, Department of In-formation Technology and Media (ITM), Sundsvall 85170, Sweden (e-mail: [email protected]).
K. Brunnström is with the Acreo AB, Department of NetLab, Electrum 236, Kista 16440, Sweden.
M. Barkowsky, R. Cousseau, and P. Le Callet are with the Image and Video-Communication (IVC) Research Group, LUNAM Université, Uni-versité de Nantes, IRCCyN UMR CNRS 6597, Polytech Nantes, 44306 Nantes Cedex 3, France (e-mail: [email protected]; [email protected]; [email protected]).
M. Sjöström is with the Department of Information Technology and Media (ITM), Mid Sweden University, Sundsvall 85170, Sweden (e-mail: [email protected]).
Color versions of one or more of the figures in this paper are available online at http://ieeexplore.ieee.org.
Digital Object Identifier 10.1109/TBC.2012.2191031
push for bringing the 3D video into the home and it has reached the early adopters, but still it is a long way to a more general embracement of the new technology. The progress is fast and nowadays 3DTV broadcasting is already available in several countries, at least for trial. A number of techniques have been in-vented and are in most cases still under fast development for rep-resenting and prep-resenting 3D videos, e.g. multi-view, 2D video plus depth, volumetric. The following study focuses on stereo-scopic 3D (S3D), which is the most common and mature tech-nology. It is widely used in current movie industry and 3DTV broadcasting.
Stereoscopic 3D videos present viewers with two similar images having a slight spatial shift of viewpoint i.e. two perspectives of the same view, that could give rise to visual disparity. Each eye will only see one of the two pictures. The Human Visual System (HVS) will then group objects together in the two images, extract corresponding points. The distances between the corresponding a.k.a. disparity are then used to create a sensation of 3D depth. In the home environment, 3DTV may require a higher resolution than SDTV (standard definition TV) [1]. Stereoscopic 3D videos have several formats such as frame sequential (e.g. frame packing) and frame compatible (e.g. side-by-side). The frame sequential format allows each view to have full HD resolution while in frame compatible format the left and right images are grouped into a single 2D HDTV frame halving the resolution. The frame sequential 3D video format was used in this study.
Often the bandwidth of transmission systems is limited. The transmission bitrates have a strong impact on the delivered video quality. Transmitting the additional view of stereoscopic videos requires more bandwidth than 2DTV transmission. In order to limit the additional bandwidth and backward compat-ible with existing 2DTV transmission network and encoding equipment, current 3DTV providers prefer to broadcast the frame compatible 3D representation.
For 2D IPTV services, often the H.264/AVC coding scheme [2] is employed. For 3DTV services today, side-by-side is used in most cases, to which H.264 is applied as a 2D encoding al-gorithm. For HD 3DTV either H.264 is used independently on each view (simulcast coding) or the inter-view redundancy is exploited by using multi-view coding, in particular MVC. The advantage of H.264/AVC is that it can be transmitted over cur-rent standard channels using existing hardware, hence it allows the broadcaster to use most of its 2D infrastructure even for 3D. However as the images of the different views are highly corre-lated, a lot of information between the two views is redundant.
MVC is one of the compression standards that uses this redun-dancy to improve coding efficiency by introducing inter-view prediction, where images are not only predicted from spatially or temporally neighboring image regions but also from corre-sponding images in adjacent views.
Besides the aforementioned hybrid video encoding tech-niques, various data processing operations such as temporal and spatial resampling are frequently used to improve the efficiency. Scalable video coding (SVC) with temporal and spatial scalability has been studied in [3], [4]. Another way is to exploit the performance of the HVS in terms of binocular fusion and disparity sensitivity in the context of asymmetric coding [4], [5].
Apart from the artifacts introduced by the source coding, the transmission network itself often introduces errors due to delay or packet loss. The impacts of network errors on 2D video quality have been discussed in many studies. The subjective experiment results from [6] showed that depending on the sce-narios the same packet loss has a significantly different impact on user perceived video quality. The relationship between bit rates and perceptual quality was investigated in [7], where the results showed that at low bit rates, even a small difference in bit rates is linked to a large difference in quality. The user expe-rience study from [8] suggests that, in packet loss environments, a certain amount of channel rate should be assigned to forward error correction or another robust response to packet loss rather than to improve the coding accuracy in H.264. The results from [9] showed that users were more annoyed by long and widely spread packet losses than bursts. When information is lost, e.g. due to dropped packets, error concealment methods are often used at the end user side to reconstruct the error affected signal. A review of error concealment methods for 2D videos can be found in [10], [11]. In the 3D case, some investigations were made by [12], [13], they showed that the effect of packet losses are more annoying in stereoscopic 3D video if a transmission distortion in one view is perceived differently from the other view. A temporal misalignment between the left and the right view may lead to rapidly increasing visual fatigue. Several influence factors for visual fatigue that may lead to headache or nausea have been presented in [14].
The perceived video quality is of highest importance for the adoption of a new technology from a user’s point of view and thus, consequently, from an industry perspective. Subjective as-sessment is commonly used to measure users’ quality of expe-rience. For the evaluation in 2D, many standards exist and they have been used over the years in small and large scale evalua-tions, e.g. by the Video Quality Experts Group (VQEG) [15]. In 3DTV, some traditional image quality parameters such as per-ceived sharpness or perper-ceived resolution could affect the users’ experience differently when compared to the same image char-acteristics in traditional 2D [16]. Some new factors in 3D video, particularly depth perception due to binocular disparity, may bring an add-on value to the perceived video quality. This added value may be expressed in terms of sense of presence and natu-ralness [17], [18]. A review of the most important influence fac-tors can be found in [19]. The binocular information, which is the key to this added value, is strongly influenced by using a cor-rect camera setup and calibration [20]. All along the transmis-sion chain, the disparity information can be considered [21]. It
has also been shown that the visual attention may change when disparity information is available and attention information may be beneficial throughout the transmission chain [22].
In this paper, users’ experience of stereoscopic 3D video quality was investigated on two subjective data sets. The two data sets were distinguished by a focusing on error conceal-ment methods in one set and a focus on different coding and transmission scenarios in the other data set. The performance of state of the art video compression standards and various pre-processing techniques were evaluated in the second experi-ment. For the second data set, two subjective assessments were conducted in two different laboratories, which gave quality judgments based on two distinct panels of observers in two different countries. The Absolute Category Rating with Hidden unimpaired Reference video (ACR-HR) assessment method was used. As described in VQEG testplan [23]: “ACR is a single-stimulus method in which a processed video sequence is presented on its own, without being paired with its unprocessed “reference” version. Each test condition is randomly presented once to each viewer. The ACR-HR test method includes the non-distorted reference version of each video sequence in order to allow judging the quality of the content itself.” In addition to answering on a general five point ACR scale, the subjects were asked to indicate visual comfort on a second scale in our experiments.
The individual studies have been published before [13] and [24]. In this paper we bring them together into a larger joint study where we are able to analyse common data collectively. This has enabled us to add more cross-lab analysis, as well as new investigation of the content influence on the perceived severity of different type of degradations.
This paper is organized as follows: In Section II, the tested method, coding and transmission scenarios, experiment setup and procedure are described in detail. The results are presented and discussed in detail in Sections III and IV, before concluding the work in Section V.
II. METHOD
Two experiments were prepared in a similar way that is used for 2D TV quality experiments for example within VQEG.
In total, 11 source stereoscopic video sequences (SRC) were extracted out of 7 different longer video clips for the subjective experiments. Each SRC was about 10 seconds long and had a higher resolution than SDTV. The sequences covered contents from low motion and low detail to high motion and high detail. The scenes are summarized in Table I.
All video sequences for the subjective experiments were pre-pared in a simulated transmission chain, as shown in Fig. 1. Sev-eral different scenarios, called Hypothetical Reference Circuits (HRC) according to the terminology of the VQEG [23] were used in creating the Processed Video Sequences (PVS).
III. ENCODING ANDTRANSMISSION
A SRC was firstly processed with spatial or temporal down-sampling (an optional step used for certain HRCs) as can be seen in Fig. 1. The spatial down-sampling was performed sym-metrically on both the left and the right view of the stereo-scopic video by using a “lanczos-3 filter” [25] in both hori-zontal and vertical direction resulting in 1/4 and 1/16 of the
res-TABLE I
SOURCEVIDEOSEQUENCES INCODINGEXPERIMENT
only used in the coding experiment, but not in error-concealment experiment
Fig. 1. General outline of the processing chain for generating test video se-quences.
olution of the original video; in the temporal down-sampling the video frame rate was reduced to 1/2 and 1/3 of the orig-inal frame rate by removing frames without filtering, which resulted in approximately 12 and 8 frames per second. Sec-ondly, the video encoding process was performed on the se-quence, the H.264/AVC video encoder in its reference imple-mentation JM 17.0 was used to create the simulcast encoded sequences, and JMVC 7.1 was used to generate multiview en-coded videos. In the packet loss experiment, realistic parameters for slightly error-prone channels were selected by having one slice extending one line of macroblocks and inserting an Im-mediate Decoder Refresh (IDR) picture each 25 frames. Both settings limit the error impact and its propagation while not se-verely reducing the coding efficiency.
The encoded bitstream was supposed to be transmitted over packet based networks. An error-free network was assumed for the coding efficiency data set and an error-prone network for the packet loss and error concealment data set. Transmission er-rors were introduced by using an improved version of the RTP (Real-time Transport Protocol) packet loss simulator “rtp_loss” provided by the Joint Video Team (JVT) in their reference soft-ware package.
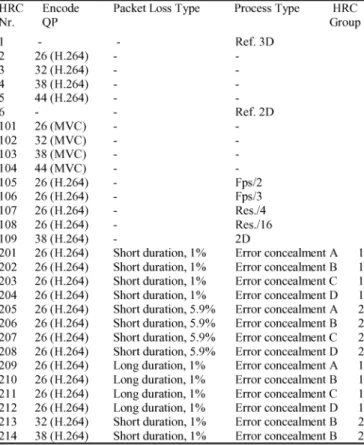
TABLE II
LIST OFPROCESSINGCONDITIONS(HRC)
Following the transmission simulation, the bitstreams were decoded, and concealed when transmission errors were in-volved. The bitstreams were decoded using JM15.1 as the more recent versions of the JM decoder available up to 17.0 were found to be incapable of decoding the error impaired bitstreams. The decoded sequences were then up-sampled to their original temporal frame rate by duplicating frames and to the full HD resolution by using Lanczos-3 filtering. This was done in order to conform to the 3D displays used in the subjective experiment, which have also Full-HD resolution.
Table II lists all HRC conditions. HRC1-6 were used in both experiments, HRC 101–109 were only used in coding efficiency experiment, and HRC201-214 were used only in the packet loss and error concealment experiment. In order to cover the range of typical coding qualities, the quantization parameter (QP) was varied from 26 to 44 with a stepsize of six. Incrementing the QP by six doubles the quantization step-size of the linear quan-tizer for the Discrete Cosine Transform (DCT) coefficients in the H.264 encoder. This also approximately halves the bitrate. Further information can be found in [9]. Please note that the bi-trate at the same QP also depends on the properties of the SRC. The fixed QP approach was preferred to fixed bitrate as it helps to cover the full range of quality for each SRC. Temporal and spatial resampling was based on the simulcast coding with QP at 26. HRC 1 was an uncompressed and undistorted video that acted as a reference 3D video to compare to the other conditions. For each source video, a corresponding 2D reference presenta-tion, HRC 6, was also introduced by duplicating the left view video and displaying the same view for the left and the right
eye. This provided a pure 2D impression with zero disparity on the 3D screen while avoiding deactivation of the shutter glasses. Most processes were symmetrically applied to both views, thus for a certain sequences the video processing was equally imposed on both the left and the right view of the S3D videos. The exception was that the packet losses were introduced only in one of the two views. The condition of having errors in only one view may occur in the context of unequal error protection scheme, e.g. one view is protected at a higher rate. It may also occur in simulcast if a large interleave interval is deliberately used for the two views. On the contrary, if errors had occurred in both views, switching to an unimpaired video for 2D would not be possible. While this has not been tested in this experiment, it could be anticipated that also in this case, the avoidance of binocular rivalry by 2D presentation would lead to a higher per-ceived quality. In order to avoid obvious patterns for the choice of the degraded view, the PVS were split in two groups in the packet loss experiment as indicated by the rightmost column of Table II. For group 1, the left view was distorted for all odd SRC and the right view was distorted for all even SRC. The inverse applies to group 2. The transmission errors were grouped as fol-lows. A “short” duration means that the bitstream was only de-graded from 39% to 58% while a “long” degradation indicates that the packets were lost in between 10% and 70% of the 10 seconds PVS. This placement ensured that the start and the end of each sequence would be unaffected by transmission errors. In the subjective experiment it is important that the observers can distinguish between content artifacts, coding artifacts and trans-mission impairments. Most of the transtrans-mission error scenarios were based on encoding at the highest evaluated video quality with a QP equal to 26. This allows for a large footroom for evaluating the quality of the introduced transmission artifacts. However, in order to learn about the relationship between quan-tization artifacts and transmission errors, HRC213 and HRC214 were included with the smallest transmission error impairment but a QP of 32 and 38.
Four different error concealment strategies were applied. Error concealment strategy “A” consists of directly playing back the decoded video. This should be considered the most computationally intensive algorithm as it involves the sophis-ticated error concealment implemented in the H.264 software, which uses spatial or spatial-temporal interpolation depending on the frame type. However, in the 3D case, only a single view was distorted and thus binocular rivalry may occur as the error concealment artifacts are visible only in one view.
Error concealment strategy “B” implements a switching to a 2D presentation when an error occurs in one view. As the other view was undistorted in our setup, this undistorted view was displayed to both eyes thus leading to a 2D impression without disparity.
In error concealment strategy “C”, the last frame that was cor-rectly received for both views displayed while the effects of the transmission errors were affecting one view. Thus, the observer watched a video which paused for a certain time, showing a 3D still image of the last correctly received frame and then the scene suddenly skipped to the next correctly received 3D frame and continues playing.
The fourth error concealment strategy “D” was similar to “C” but instead of stopping the video completely, it was assumed
that a buffer of video frames exists which contains half a second of decoded content, corresponding to 12 frames in our experi-ment. These 12 frames were slowly played back during the re-covery time of the decoder. As the exact time of the rere-covery was not known, the frames were played back with an exponen-tially increasing delay such as the last frame was displayed after 37 frames. The observer would thus see that the playback slows down, skips and then continues at normal speed.
As no error concealment would be necessary in the decoder, the methods “B”, “C”, and “D” are less computationally expen-sive than method “A”.
A. Experimental Setup
The subjective data set for coding efficiency was assessed in two distinct subjective experiments at two labs indepen-dently: at the University of Nantes IRCCyN, France (Lab 1) and Acreo AB, Sweden (Lab 2). The packet loss experiment was only conducted at Lab 1. In order to allow for cross-lab comparison, the ambient and all hardware and software at both locations and for all three subjective assessments were adjusted as similarly as possible. The lab environments adhere to the lab setup defined in the recommendation ITU-R BT.500-11 [26]. The 23” Dell Alienware OptX LCD display (120 Hz, resolution 1920 1080p) was used for displaying 3D videos in the experiment together with a pair of active shutter glasses from the Nvidia 3D vision system. The display was positioned far enough from the wall to avoid any conflicts of the displayed 3D content with the real world. The viewing distance was set to 3 times of the display height, which is the same value used in the VQEG HDTV testplan [23]. The voting interface for the viewers to rate the video quality was shown on a separate dis-play. At IRCCyN, the wall behind the screen was illuminated, the luminance level of the reflection from the gray wall was set to 50 which corresponded to 15% of the peak luminance of the display without passing the shutter glasses when they were activated. At Acreo the room illumination was set to 20 lux which is very low for the sake of avoiding reflections from the display and for disturbing observers by looking at objects other than the display. No flickering was perceived in any of the laboratories when looking through the shutter glasses. The video sequences were displayed in uncompressed format in order to make sure that all observers were given the same presentation of the same video sequence. In order to assure that no temporal distortion was introduced by the player, the videos were preloaded into the computer’s Random Access Memory (RAM) and special care was taken that the playout of twice the Full-HD resolution was performed without temporal jitter.
Prior to the subjective experiment, the observers were screened for visual acuity using a Snellen Chart, stereoscopic acuity using a Randot Stereo test and color blindness. Each experiment was divided into two sessions of approximately 50 minutes each with pauses after about 15 minutes of viewing time.
A training session was pre-conducted before the formal evaluation session so that observers would become accus-tomed to the PVSs’ characteristics and the rating interfaces. In the coding efficiency experiment both training session and rating session were using the “absolute category rating with hidden reference” (ACR-HR) method; hence the observers
had a smooth transition from training session to rating session without feeling any boundaries. In the packet loss and error concealment experiment, the Double-Stimulus Continuous Quality-Scale (DSCQS) method [26] was used for the training session. In the DSCQS method, the sequences are presented in pairs. In our case, the observers saw a degraded sequence and its corresponding unimpaired reference sequence in random order. The videos are shown to the observers sequentially with one repetition and divided by a short gray sequence, e.g. PVS, REF, PVS, REF or REF, PVS, REF, PVS. As required by the DSCQS method, the observers score on a 0-100 scale with two sliders displayed on the screen. The DSCQS method is very time consuming, in our case about 50 seconds for each trial. On the other hand, it allows the observers to compare in detail the quality degradation, therefore helping the observer to get more accustom to 3D viewing and the typical 3D degradations.
In the rating session all PVSs were presented in random order and they were rated independently on the ACR category scale which is five-point quality scale defined by ITU [27] (Excellent, Good, Fair, Poor and Bad, which are later mapped to the scores 5, 4, 3, 2, and 1 respectively). The subjective test instructions, questionnaires as well as rating interface were presented in the observers’ native language (French at the University of Nantes, and Swedish at Acreo, for international observers English was used in both labs). For each sequence, besides the evaluation for the overall video quality of 3D experience, we included a visual comfort comparison scale to evaluate the visual comfort associated with the visualization of the sequences compared to viewing on a conventional 2D television.
The subjective tests contained a total of 175 videos for the coding efficiency experiment, and 200 videos for the packet loss experiment.
In total 48 naive observers (24 at each lab) participated in the coding efficiency subjective experiment. After the experiment all observers’ votes were screened according to ITU-R BT.500 and the VQEG HDTV testplan, 2 subjects from IRCCyN and 5 from Acreo were rejected. The remaining 41 observers con-sisted of 21 male and 20 female with an average age at 27.9 years (minimum 15, median 23, maximum 64). For the packet loss experiment a total of 30 observers participated, 2 of them were rejected due to failing the stereoscopic acuity test. The ob-servers had various occupation backgrounds and they were paid for their participation in the subjective experiment.
IV. RESULTS
A. Cross-Lab and Cross Experiment Comparison
Three sets of experimental data have been collected (two data sets from the coding efficiency experiment at different labs, and one set from the packet loss experiment). The Mean Opinion Scores (MOS) were calculated, as the average of the numerical values that were assigned to the attributes of the ACR scale as described previously. Among the three experiments, 6 HRCs were common (HRC1-6) as shown in Table II; the data of those 6 HRCs from the three experiment sets were combined into one data set by linear transformation so that cross lab and cross ex-periment comparisons can be performed. For the coding effi-ciency experiment, 19 HRCs were in common (HRC101 -109).
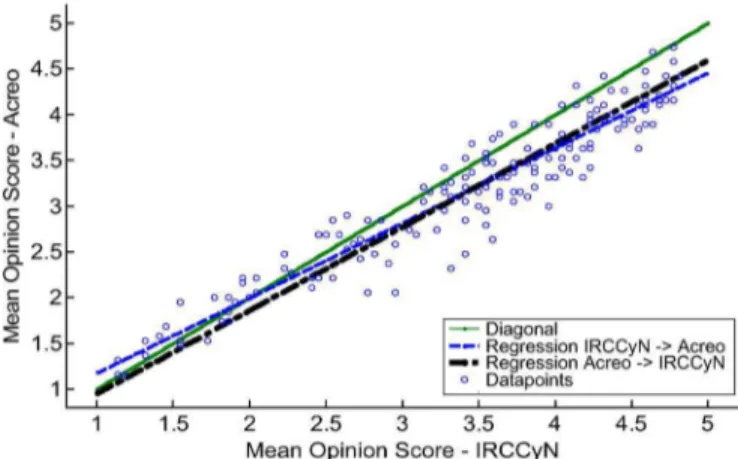
Fig. 2. Cross-lab comparison. Scatter plot of data from two labs with linear regression.
A linear fit for them was calculated for the purpose of combina-tion.
1) Cross-Lab Comparison: The coding efficiency
experi-ment can be used for a detailed cross-lab analysis. All 175 PVSs can be used. The scatter plot of the two experimental data sets in Fig. 2 displays the relationship between the scoring performing in lab 1 on the x axis in comparison with the scoring performed in lab 2 on the y axis. It can be seen that the MOS results from the two laboratories have a similar trend, though the experiments were done in different locations and different observer groups. The diagonal (solid) line is the main diagonal, which can be used as a reference. It indicates the ideal case in which the data from the two laboratories would match perfectly to each other. How-ever, the real data has a small deviation downside of the diagonal line, which mean there was a difference between the data of two labs, and the observers in Lab1 ((IRCCyN) were giving higher score than in Lab 2 (Acreo) for the same PVS in most of the cases. In fact the MOS from Lab 1 had slightly larger span from lowest 1.7 to highest 4.4 comparing to Lab 2 which spans from 1.9 to 4. The dash-dash regression line is Lab 1’s data mapped to Lab 2’s, and the dash-dot regression line shows lab 2’s data mapped to lab 1’s.
An ANalysis Of VAriance between groups (ANOVA) [28] was performed with the laboratories as one between factor and 11 SRCs times 15 HRCs as within factors. There was a signifi-cant difference in the main effect of the laboratories
(Fisher-Snedecor distribution), the significance level or critical , corresponding to a 2% chance of rejecting the null hypothesis when it is true. The null hypothesis was that the distribution from the two labs stem from the same statistical process.
(1) After applying the linear transformation of Lab 1’s to Lab 2’s data by (1), most of the difference between the laboratories vanished. In other words, we kept lab 1’s data untouched and rescaled lab 2’s data to match lab 1. The choice is arbitrary and was guided by using the larger MOS scale as this allows to stay close to the range of 1 to 5 for the realigned data.
The combined cross-lab data was again analysed with the above mentioned ANOVA setting. This time the main effect of laboratories was not significant, . The main
Fig. 3. Cross-lab comparison. The MOS across SRC of the different laborato-ries after scaling Lab 2’s (Acreo) data to Lab 1 (IRCCyN). The error bars shows 95% confidence intervals.
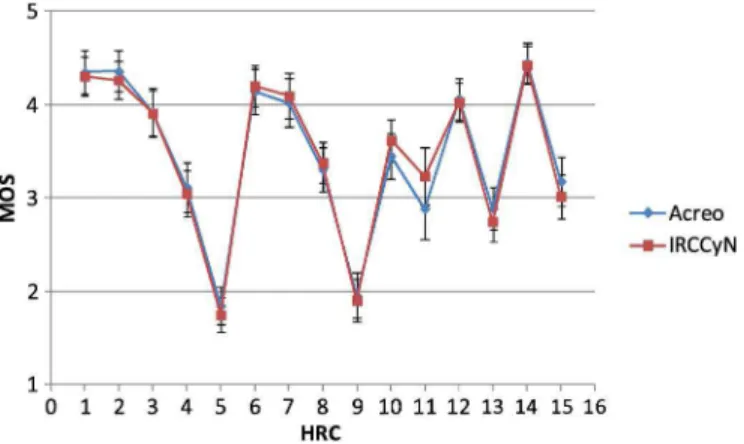
Fig. 4. Cross-lab comparison. The MOS across HRC of the different laborato-ries after scaling Lab 2’s (Acreo) data to Lab 1 (IRCCyN). The error bars shows 95% confidence intervals.
effects of SRC and HRC were significant with
, and , respec-tively. The interaction between SRC and HRC was also signif-icant , . The interactions of SRC with laboratories, see Fig. 3, was also significant
, . The interaction between the HRC and labora-tories, see Fig. 4, was however not significant. In consequence, the two experiment results were verified that they can be com-bined and analysed as a single evaluation after aligning the data from one lab to the other. Such an alignment is often necessary between two laboratories performing the same experiment, in particular if the language is different. The notion of the absolute categories has slight offsets in different languages [29].
2) Cross-Experiment Comparison: Six HRCs (HRC1-6)
were used in both, the coding efficiency and the packet loss data set. After obtaining the combined data for the cross-lab coding efficiency experiment, these six HRCs were extracted and compared to those which were obtained in the packet loss experiment. Fig. 5 shows a scatter plot of the sixty data points that are common in the different experiments (6 HRCs 10 SRCs). As the whole MOS scale is spanned, an alignment of the two experiments can be performed. The dash-dot line is the regression line for a linear fit result of the packet loss experi-ment data to the coding experiexperi-ment data. Correspondingly the dash-dash line is the regression line for the opposite mapping. Based on similar criteria as before, it was decided to map the
Fig. 5. Cross-experiment comparison. Scatter plot of data from different ex-periments with linear regression.
Fig. 6. Mean opinion score comparison of cross-experiment and cross-lab re-sults partitioned by the all HRCs.
packet loss experiment data to the coding efficiency experiment data (shown in (2)).
- - (2)
Where the “Cross-lab” is the combined Acreo and IRCCyN data. This combined cross-lab and cross-experiment data is used in the upcoming result analysis.
An ANOVA analysis was performed in the same way as be-fore. Again the main effect of laboratories was not significant, . The main effects of SRC and HRC were sig-nificant with , and
, respectively. The interaction between SRC and HRC was also significant , as expected. As before, the interactions of SRC with laboratories, was also significant , . The interac-tion between the HRC and laboratories was however not signif-icant this time either.
B. Analysis of Observers’ Experience of 3D Video Quality
Fig. 6 shows the MOS comparison of cross-experiment and cross-lab results for all HRCs. The error bars represents 95% confidence interval. Obviously the degree of compression during the video encoding expressed as the Parameter (QP) has a large impact on the MOS. Both H.264/AVC simulcast (HRC2-5) and MVC (HRC101-104) show similar trends, the assessed quality level decreases when the encoding QP was increased. HRC107 (spatial resolution down-sampling before
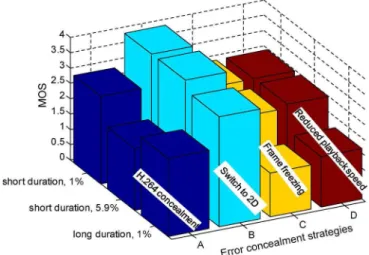
Fig. 7. Comparison of error concealment strategies in various packet loss sce-narios.
encoding by factor four) got a better MOS around 4 (“good”) than the other temporal and spatial down-sampled HRCs. The temporal down-sampling reduces the amount of source data only by a factor of two (HRC105) or three (HRC106), which leads to significantly lower MOS values of about 3.5 and 3.2 respectively. Further reducing the Resolution by 16 (HRC108) got the worst quality evaluation with . As the bitrate changes drastically, a rate-distortion analysis was performed.
Fig. 7 shows the evaluation of error concealment strategies for the stereoscopic videos with transmission errors, the error concealment method B, (switch to 2D mode) used in the HRC number 202, 206, and 210, is significantly preferred to all other methods in all 3 error categories (1% packet loss for short du-ration, 5.9% for short duration and 1% for long duration). The MOS value of HRC202 and HRC206 was still voted as “good”. The standard error concealment method of the H.264 decoder (version A), used in HCR number 201 and 209, was preferred compared to the versions C (HCR 203 and 211) and D (HCR 204 and 212), when the percentage of errors was low (1% in both short and long duration). However, for a high percentage of packet loss of 5.9%, it became the opposite, where conceal-ment case A (HRC205) was rated lowest. There is no statistical significant difference between the method C and D, which indi-cates that immediate “freezing” is similarly annoying as slowing down.
As studied in [9] for 2D videos, widely spread transmission errors were voted as being more disturbing than transmission errors occurring in bursts. This is corroborated in the 3D case. Among the 3 different categories of transmission errors, the MOS of the 1% packet loss for a longer duration was worse than the other two scenarios. The difference is particularly vis-ible for the concealment methods C and D which got a MOS of about 2.5 for the short duration but only 1.5 for the longer dura-tion. There is an exception for the error concealment case “A” (simulcast decoding with JM): the worst case was the strong error condition of 5.9% at short duration.
Using HRC213 and HRC214 the impact of coding artifacts in combination with transmission errors and their concealment has been evaluated. The best error concealment method B (switching to 2D) was used. Table III compares the mean value of all SRCs in terms of the MOS differences between
TABLE III
MOS DIFFERENCESBETWEENPACKETLOSSFREESCENARIOS AND1% BURST
PACKETLOSSSCENARIOS
Fig. 8. Comparison of 3D and 2D reference sequences.
Fig. 9. Compare 2D and 3D DMOS for H.264 coding at QP38.
coding only artifacts and 1% burst transmission artifacts with concealment B case. As expected, the observers preferred the error free case when the 3D video was played back without switching to 2D. However, the difference is small indicating a high performance of the error concealment strategy across different coding qualities. On the contrary, people indicated significantly more visual discomfort for the cases in which a switch to 2D was necessary. Both results appear to be stable across different levels of coding quality indicating that the impact of coding artifacts is independent on the impact of switching from3D to 2D.
A surprising result occurs in HRC6 (see Fig. 6): the undis-torted 2D presentation of a video that displayed its left view only. This video contained no transmission errors and coding ar-tifacts, and can thus be compared to the 3D reference sequence (HRC1). It can be seen that 2D is slightly preferred to 3D pre-sentation although the absolute difference is small. However, a Tukey HSD post-hoc test reveals that the difference is not signif-icant based on the combined data from all test . This characteristic varies for different video source contents. The comparison between the 2D and the 3D case is shown in Fig. 8. Two SRCs (SRC4 and 10) out of eleven show statisti-cally significant differences in the way that their 2D presenta-tions were preferred to their 3D presentapresenta-tions.
Fig. 10. Comparison of coding artifacts, spatial, and temporal downsampling for each SRC with condition DMOS approach.
The next analysis shows the impact of coding artifacts on the 2D vs. 3D comparison by using the QP38 compressed HRCs (HRC4 and HRC109). As was seen in Fig. 8 that the reference quality may have an important influence, the Difference Mean Opinion Score (DMOS) is used as shown in (3) according to the VQEG testplan:
(3) Fig. 9 shows a scatter plot comparing the 2D and the 3D DMOS for QP38. It can be noted that the video sources which were judged significantly better in 2D for the uncompressed refer-ence (SRC4 and 10) are slightly below the main diagonal, in-dicating that the perceived degradation was more pronounced for 2D than for 3D coding. This may indicate that at higher compression rates, the difference between 2D and 3D becomes smaller.
The sensitivity of a particular SRC to coding, transmission artifacts, temporal and spatial downsampling has been analysed with the following approach. Firstly, the DMOS values of all PVS have been calculated according to (3). Secondly, the DMOS values of a certain artifact (a group of HRCs) have been averaged for each SRC. For example in the case of coding artifacts, all coding conditions are averaged (H.264 simulcast coding HRC2-5, and MVC coding HRC101-104). Then the difference (condition DMOS) for a particular SRC to the av-erage of all SRC has been calculated. This gives 10 difference values that indicate the relative severity of the impact of a certain artifact for a particular SRC. Similarly, 10 difference values have been calculated for the error concealment HRCs
(HRC201-214), temporal downsampling (HRC105 and 106), spatial downsampling (HRC107 and 108).
Fig. 10 displays the results graphically. It should be noted first, that the magnitude of the difference values is highest for spatial downsampling and lowest for packet loss artifacts. This indicates that the sequences behave very different when sub-jected to downsampling which may be because of the different resolution of the source sequences. In Fig. 10, the sequences with Full-HD resolution are therefore marked specifically.
Fig. 10(a) compares the influence of coding artifacts to spa-tial downsampling. At a first glance it seems that sequences which were particularly susceptible to coding would also suffer from a reduction of the resolution. The correlation reported in Table IV is at 0.72. However, the sequences with lower reso-lution significantly contributed to this effect as can be verified by the far lower correlation of 0.26 when they were excluded. As the DMOS is used, the effects of the quality of the SRC are reduced. A possible conclusion might be that both resolution re-duction and coding degradations have a disproportionally larger influence when lower resolution sequences are considered.
Fig. 10(b) demonstrates that temporal downsampling and coding artifacts may behave perceptually unrelated. This is in contradiction to the idea that sequences with slow movement or no movement at all are not very susceptible to temporal downsampling but that coding artifacts would be particularly visible because they are not hidden by motion masking.
A slight negative correlation of 0.52 for all sequences and a strong negative correlation for the Full-HD sequences of 0.83 can be seen for spatial vs. temporal downsampling, Fig. 10(c). This would indicate that a sequence that shows strong artifacts
Fig. 11. Bitrates versus MOS of MVC and H.264 simulcast comparison. TABLE IV
CORRELATIONCOMPARISON OFCONDITIONDMOSFOR
SRC1-10ANDSRC 1–6
in temporal downsampling may be spatially downsampled with a smaller quality loss. This would be in agreement with the idea that the Human Visual System is bandwidth-limited. However, the amplitude in our experiment is too small to provide conclu-sive results.
For the packet loss artifact scale, all sequences seem to be-have very similarly and therefore no conclusions are drawn from Fig. 10(d)–(f).
C. Rate-Distortion Analysis
Fig. 11 plots the MOS versus bitrate in a semi-logarithmic scale for SRC1-11. All SRCs are compared individually for the coding performance of H.264 simulcast (solid line) and MVC (dashed line). These points represent QP 44, QP 38, QP 32, and QP26 that were related to their corresponding bitrates along the x-axis. The figure shows that the MVC and H.264/AVC curves are quite close, however the MVC performed slightly better than H.264 simulcast. It can also be noticed that the gain decreases with higher bitrates. For most of the SRCs the QP32 and QP26 are statistically indistinguishable as the curves show a flat out trend at the top.
In order to simplify the rate-distortion analysis for the cases of temporal and spatial resolution downsampling processes we
Fig. 12. Example of comparison of different video processing in terms of bi-trate efficiency.
introduce two indicators: “bitrate gain” and “quality gain”. They are demonstrated by an example in Fig. 12 and (4) and (5).
Fig. 12 semiplots the average rating of SRC3 for H.264 simul-cast coding, MVC coding, temporal and spatial artifacts as a function of bitrate. The MVC and H.264 simulcast lines were further interpolated by the dash-dot curve with curve fitting tools. The HRCs of frame rate and resolution reduction are in-dicated by four individual data spots. Fig. 12 shows an example calculation of the two indicators for the “resolution /4” reduc-tion to H.264/AVC coding only cases. First, the “resolureduc-tion /4” data point (x1,y1) is obtained, and a vertical line and a hori-zontal line are drawn from this point. These lines intersect with the rate distortion curves of the coding only cases. The ver-tical line generates an intersection point with the H.264/AVC interpolated line at (x1, y2), and the horizontal line crosses the H.264/AVC line at (x2, y1). In some cases, “resolution/4” has a higher MOS than the MVC or the H.264/AVC curves and the horizontal line passing through this point do not intersect with the MVC or the H.264/AVC curves. In particular, this was the case when the curves showed a flat out trend at higher bitrates. In these cases the bitrate of QP26 encoded points on the MVC
TABLE V
COMPARISON OFSPATIAL ANDTEMPORALREDUCTIONPERFORMANCE TO3D CODINGCONCERNING(LEFT) BITRATE
GAIN ATSAMEQUALITYLEVEL AND(RIGHT) QUALITYGAIN ATSAMEBITRATELEVEL
or simulcast curves was used instead in order to obtain the co-ordinate x2. The “bitrate gain” is given by (4), which indicates the amount of bitrate that can be saved while the MOS remains constant, i.e. the service provider offers a guaranteed quality of 3DTV services.
(4) The “quality gain” is defined in (5). It indicates for a given bitrate limit the quality gain that can be achieved by a resolution reduction of 4. This is a scenario in which the 3DTV service provider offers a fixed access bandwidth to the subscriber.
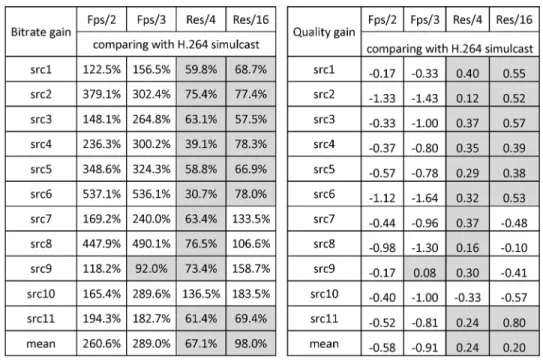
(5) By applying these two indicators to all temporal and spatial processed points for each SRC Table V gives an overview of bi-trate gain and quality gain of all frame rate and resolution reduc-tions. The cells marked with gray shade indicate when the cor-responding process is efficient and thus saves bandwidth com-pared to H.264 simulcast coding. For the other cells H.264/AVC performs better without the preprocessing of spatial or temporal down-sampling.
Comparing the bitrate gain of spatial and temporal resolu-tion reducresolu-tion to the H.264/AVC encoding, the “resoluresolu-tion / 4” is clearly superior to others with a mean value of 67%. That is on average “resolution / 4” process only uses 67% of the band-width which was needed for transmitting H.264 simulcast coded 3D videos at the same visual quality level. There is an exception for SRC10 where all spatial and temporal processes cost more bandwidth than the coding only cases. The “resolution/16” re-duction only works efficient among the videos with originally full HD resolution (using only 60% of bandwidth in average). For the videos with a lower resolution, the transmission at the
Fig. 13. Bitrates versus MOS of each SRCs.
original resolution with H.264 is more efficient. Table V also re-veals that the temporal reduction didn’t save any bitrates at all, on the contrary it required 2.6 (for 12 fps) and 4 times (8 fps) more bandwidth compared to H.264 simulcast.
The quality gain in Table V is based on the same service band-width. The results are similar to those of the bitrate gain. The “resolution/4” wins in the quality gain with an average improve-ment of 0.24 MOS compared to the H.264/AVC encoding only case. For the videos with higher resolution the “resolution/16” can get a quality gain of 0.53 MOS.
As a conclusion, it may be stated that for an HD 3DTV trans-mission system, actually a reduction of the resolution by a factor of four before the video encoding will result in a better quality. It will not only help the service provider to save bandwidth but also to save some amount of hardware processing which would be needed for encoding and decoding the full resolution 3D video, corresponding to two 2D full-HD videos.
Fig. 13 presents the MOS in dependency of bitrate from HRC1 to HRC4 (coding only artifacts) in a semi-logarithmic scaling. The full HD content (1920 1080p) is indicated using solid lines whereas lower resolution content uses dashed lines.
TABLE VI
BITRATEREDUNDANCYFACTOR OF ALLPACKETLOSSSCENARIOSCOMPARING TOPACKETLOSSFREEH.264 SCENARIOS
For most full HD contents used in our test, the influence of the bitrate on the evaluated video quality changes significantly from the lowest quality rating level to the second highest level (for example the MOS of SRC1 reaches from 1.9 to 4.3 while the bitrate increases from 0.9 Mbit/s to 4.8 Mbit/s). The curve flattens when the MOS is above the second highest level (Changing the MOS from 4.2 to 4.4 needs twice the bandwidth, from 4.7 Mbit/s to 9.7 Mbit/s).
Fig. 13 demonstrates why a fixed bitrate may not be suitable for subjective experiments. SRC1 achieves a MOS value of 4.3 at 4.7 Mbit/s while the same bitrates for SRC2 and SRC3 only reach a MOS of 2.8. The diagram also indicates that a bitrate of at least 10 Mbps is necessary in order to achieve a mark of “fair” or higher. It can be estimated that at least 20 Mbps may be necessary to reach “good” results.
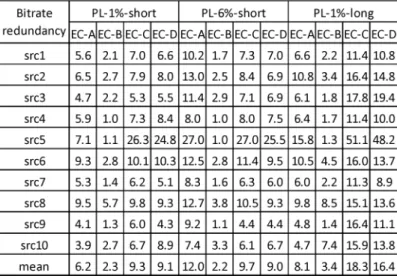
The next analysis shows the interest of protecting the bit-stream against transmission errors when those types of errors are expected. A new indicator is introduced which is called “bitrate redundancy indicator”. This is introduced by (6), in a similar way as bitrate gain in Fig. 12. Instead of comparing temporal and spatial reduction scenarios, the H.264 coding performance is compared to the error concealment method for all packet loss conditions. In other words, in an error-prone transmission envi-ronment with fixed bandwidth limit, the video may be encoded at a lower quality level instead of transmitting higher quality encoded video directly over the network and concealing trans-mission errors afterwards. The gained bandwidth may be used for error protection and correction methods, e.g. ARQ (Auto-matic Repeat-reQuest) and FEC(forward error correction). The bitrate redundancy indicator is defined as
(6) where X4 is the bitrate that was used in the scenario when the transmission errors occurred, and X3 corresponds to a bitrate that would lead to the same visual quality in an undistorted transmission.
As an example in Fig. 14, the SRC1 video was encoded at QP 26, but a 1% packet loss occurred during transmission in a
Fig. 14. Bitrate redundancy example of src1 comparison between 1 percent packet loss scenario and H.264 coding only error-free scenario.
burst. The error concealment strategy B was used. The MOS of the scenario is approximately 4.1 corresponding to the quality achieved by coding with QP32 when no transmission errors occur. While the perceived quality is the same for both sce-narios, the QP32 coding can be achieved at half the bitrate (bi-trate redundancy factor 2.1). Thus, if an error protection algo-rithm can protect the bitstream from 1% packet loss by using this bitrate gap, the viewer will perceive the same video quality but without transmission error artifacts.
Table VI shows the bitrate redundancy factor for all packet loss scenarios. The bandwidth ratio that can be spent on error resilience ranges from 2.3 to 18.3 on average, the variation de-pends on the type of 3D error concealment used. However, the factor depends strongly on the content and may even be in the order of 1 for SRC4 and SRC5.
V. DISCUSSION
One of the goals of this study was to work towards estab-lishing a reliable subjective test method for 3DTV. Several important prerequisites were presented in the setup such as the viewing environment. The subjective test method that was used in our experiment was Absolute Category Rating with Hidden Reference using only one single voting session. This is opposed to doing several subjective experiments and asking
the observers to judge one isolated aspect of 3D quality in each of them such as depth, naturalness etc. A counter-indication of the suitability of the ACR method for 3D testing seems to be the missing preference of 3D presentation over 2D pre-sentation. From the results of the two subjective experiments we have seen that 3D does not significantly outperform the 2D presentation. The added value of depth in 3D video is not clearly shown in our experiment results when viewers asked to rate video quality. One of the reasons might be that observers’ judgments of video quality are mainly determined by the introduced artifacts, and the addition of depth in the 3D images is hardly accounted for. This problem may be related to the single stimulus method, e.g. the missing reference when suddenly viewing 2D content in the context of 3D. Therefore, further studies, for example by using other methodologies such as Paired comparison may be considered in future work.
The results of the packet loss experiment show that error con-cealment method B, switching to 2D when errors occur, cer-tainly retains the highest perceived video quality when trans-mission errors occur; the standard method of concealing the frames in one view is worse in 3D probably due to the effects of binocular rivalry, which are not present when switching to 2D. The sophisticated 2D error-concealment algorithms do not guar-antee that the interpolated content matches well with the second, undistorted view. This mismatch will cause visual discomfort to viewers and hence it does not help the perceived quality. Staying in an undistorted 3D presentation mode but slowing or pausing the play-back as was tested in case C and D usually perform poorer than the A method, except for the large amount of burst error scenario. Further experiments are necessary in order to an-alyse whether there is a higher sensibility and annoyance of the viewers for videos stopping in 3D than in 2D.
When videos with error concealment strategy B were pre-sented, the main cause of annoyance seems to be related rather to the switch between 2D and 3D presentation and not to the time that 2D was presented. Thus, if errors occur, a longer pre-sentation in 2D should be preferred to switching forth and back between 2D and 3D presentation.
It was seen in the results that the error concealment conditions can be compared to coding degradations in terms of MOS in our test. The interest of performing error resilience was demon-strated by noting the bitrate factor that corresponds to the same quality in the undistorted case. This result may be exploited in the context of joint source channel coding. However, it can be noted that if the video is played back with switching to 2D as error concealment strategy, the degradation of MOS is often not significant. This indicates that a channel code that is supposed to be effective in this scenario is difficult to design. It has to correct more errors than were used in the test (e.g. 5.9% of lost packets in the given time frame) with only a small reduction of the avail-able bitrate for the video transmission. It should be noted that in the simulcast case, the left and the right view transmission approaches a repetition code. We used this feature for the error concealment case “B”.
Certain important factors could influence our experiment re-sults. Firstly, the 3D video content and video source quality has shown strong effects on the video quality, the visual comfort and the bitrate. Secondly, the mental reference of the observers, es-pecially for naıuml;ve observers, is biased towards 2D viewing
more than 3D since they might get used to 2DTV. Last but not least, the technology constraints for 3D viewing (e.g. display and eye-glass artifacts), together with suitability of the viewing environment and the assessment methodology will inevitably bring uncertainty to the results.
VI. CONCLUSION
In this paper, stereoscopic 3D video sequences were pro-cessed and transmission in both lossless transmission channel scenarios and error-prone scenarios was simulated. The per-ceived video quality of experience was evaluated by a joint analysis of data collected from three individual experiments at two laboratories. The main purpose of the two experiments was to test and compare several different 3D video coding tech-niques, transmission scenarios, error concealment strategies, and their impacts on perceived video quality from observers’ point of view.
We discovered that a pre-processing technique using reso-lution reduction of four may result in higher bitrate efficiency when H.264 video coding is used. The reduction of the frame rate did not save a significant amount of bitrate but it reduced the video quality to a large extent. The results can be applied to an HD 3DTV transmission system, as the resolution reduc-tion not only helps service provider to save bandwidth but also to save some amount of hardware processing which would be needed for encoding and decoding.
For error-prone channels, it is important to develop new con-cealment methods that are required for 3D videos. The H.264 standard method of concealing the frames is not suitable for 3D videos as this impacts only one view. From our experiment re-sults the best method among the four tested error concealment methods is to switch to 2D presentation which also uses the in-herent redundancy of the transmitted information.
The experiment and assessment methods in this study pro-vide us possibility to analyse on combined cross-lab and cross experiment data. However, it still has some difficulties and lim-itation in further interpreting our results. In the future, we will focus on developing suitability of assessment methodology for 3D videos, and carrying out specified studies on limited sce-narios, e.g. the relationship between videos simulated in a loss-less channel and in an error-prone channel.
ACKNOWLEDGMENT
The participation of the observers is gratefully acknowledged.
REFERENCES
[1] ITU, “Features of three-dimensional TV video systems for broad-casting BT series broadbroad-casting service,” ITU-R BT.2160, 2010. [2] ITU, “Advanced video coding for generic audiovisual services,” ITU-T
Rec. H series, H.264, Mar. 2010.
[3] N. Ozbek, A. M. Tekalp, and E. T. Tunali, “Rate allocation between views in scalable stereo video coding using an objective stereo video quality measure,” IEEE Int. Conf. Acoustics, Speech Signal Process., 2007.
[4] G. Saygili, C. G. Gurler, and A. M. Tekalp, “3D display dependent quality evaluation and rate allocation using scalable video coding,”
IEEE Image Process. (ICIP), pp. 717–720, 2009.
[5] L. Stelmach, W. J. Tam, D. Meegan, and D. Vincent, “Stereo image quality: Effects of mixed spatio-temporal resolution,” IEEE Trans.
[6] M. Mu, R. Gostner, A. Mauthe, and G. Tyson, “Visibility of individual packet loss on H.264 encoded video stream: A user study on the impact of packet loss on perceived video quality,” Proc. SPIE, vol. 7253, p. 725302, 2009.
[7] J. Meenowa, D. S. Hands, R. Young, and D. Bayart, “Subjective assess-ment of HDTV content: Comparison of quality across HDTV formats,”
Proc. SPIE, vol. 7527, p. 75270I, 2010.
[8] M. Pinson, S. Wolf, and G. Cermak, “HDTV subjective quality of H. 264 vs. MPEG-2, with and without packet loss,” IEEE Trans.
Broad-cast., vol. 56, no. 1, pp. 86–91, Mar. 2010.
[9] M. Barkowsky, M. Pinson, R. Pépion, and P. Le Callet, “Analysis of freely available dataset for HDTV including coding and transmission distortions,” in 5th Int. Workshop Video Process. Quality Metrics
(VPQM), 2010.
[10] Y. Wang and Q.-F. Zhu, “Error control and concealment for video com-munication: A review,” Proc. IEEE, vol. 86, no. 5, pp. 974–997, May 1998.
[11] W.-Y. Kung, C.-S. Kim, and C.-C. J. Kuo, “Spatial and temporal error concealment techniques for video transmission over noisy channels,”
IEEE Trans. Circuits Syst. Video Technol., vol. 16, no. 7, pp. 789–803,
Jul. 2006.
[12] J. Gutierrez, P. Perez, F. Jaureguizar, J. Cabrera, and N. Garcia, “Sub-jective assessment of the impact of transmission errors in 3DTV com-pared to HDTV,” in 3DTV Conf. : The True Vision—Capture,
Trans-mission and Display of 3D Video (3DTV-CON), May 16–18, 2011, pp.
1–4, vol., no..
[13] M. Barkowsky, K. Wang, R. Cousseau, K. Brunnström, R. Olsson, and P. Le Callet, “Subjective quality assessment of error concealment strategies for 3DTV in the presence of asymmetric transmission er-rors,” in Packet Video Workshop., 2010.
[14] K. Ukai and P. A. Howarth, “Visual fatigue caused by viewing stereo-scopic motion images: Background, theories, and observations,”
Dis-plays, vol. 29, no. 2, pp. 106–116, 2008.
[15] Final Report from the Video Quality Experts Group on the Validation of
Objective Models of Multimedia Quality., G. Cermak, K. Brunnström,
D. Hands, P. Margaret, F. Speranza, and A. Webster, Eds. Boulder, CO: Video Quality Experts Group., 2008.
[16] I. Heynderickx and R. Kaptein, “Perception of detail in 3D images,” in
Proc. SPIE 7242, 2009, p. 72420W.
[17] P. J. Seuntieens, I. E. Heynderickx, W. A. IJsselsteijn, P. M. van den Avoort, J. Berentsen, I. J. Dalm, and M. T. Lambooij, “Viewing expe-rience and naturalness of 3 D images,” in Willem Oosting Proc. SPIE
6016, pp. 43–49, 10/2005.
[18] W. IJsselsteijn, D. Bouwhuis, J. Freeman, and H. de Ridder, “Pres-ence as an experiential metric for 3D display evaluation,” in SID
Di-gest 2002..
[19] L. M. J. Meesters, W. A. IJsselsteijn, and P. J. H. Seuntiens, “A survey of perceptual evaluations and requirements of three-dimensional TV,”
IEEE Trans. Circuits Syst. Video Technol., vol. 14, no. 3, pp. 381–391,
Mar. 2000.
[20] W. Chen, J. Fournier, M. Barkowsky, and P. Le Callet, “New re-quirements of subjective video quality assessment methodologies for 3DTV,” in Int. Workshop Video Process. Quality Metrics, 2010. [21] Q. Huynh-Thu, P. Le Callet, and M. Barkowsky, “Video quality
as-sessment: From 2D to 3D — Challenges and future trends,” in Proc.
17th IEEE Int. Conf. Image Process. (ICIP),, Sep. 26–29, 2010, pp.
4025–4028, vol., no.
[22] Q. Huynh-Thu, M. Barkowsky, and P. Le Callet, “The importance of visual attention in improving the 3D-TV viewing experience: Overview and new perspectives,” IEEE Trans. Broadcast., vol. 57, no. 2, pp. 421–431, Jun. 2011.
[23] G. Cermak, L. Thorpe, and M. Pinson, “Test plan for evaluation of video quality models for use with high definition TV content,” Video
Quality Experts Group (VQEG), 2009.
[24] K. Wang, M. Barkowsky, R. Cousseau, K. Brunnström, R. Olsson, P. Le Callet, and M. Sjöström, “Subjective evaluation of HDTV stereo-scopic videos in IPTV scenarios using absolute category rating,” Proc.
SPIE, vol. 7863, p. 78631T, 2011, 10.1117/12.872462.
[25] W. Burger and M. J. Burge, Principles of digital image processing:
Core algorithms.. Englewood Cliffs, NJ: Springer, 2009, pp. 231–232, ISBN 9781848001947.
[26] ITU, “Methodology for the subjective assessment of the quality of tele-vision pictures,” Recommendation BT 500-11 International Telecom-munication Union ed., 2002.B.
[27] ITU-T Study Group 12., “Subjective video quality assessment methods for multimedia applications,” ITU-T P.910, 1997.
[28] M. R. Spiegel and L. J. Stephens, Schaum’s outline of theory and
prob-lems of statistics.. New York: McGraw Hill, 1998.
[29] S. Zielinski, F. Rumsey, and S. Bech, “On some biases encountered in modern audio quality listening tests—A review,” J. AES, vol. 56, no. 6, pp. 427–451, 2008.
Kun Wang received the M.Sc. degree in electrical
engineering from the Royal Institute of Technology (KTH), Sweden in 2007.
After graduation he worked in Technical Uni-versity of Eindhoven and Alcatel-Lucent in the Netherlands. He has been working in many EU research projects e.g. FP6-MUSE, ISIS and FP7-ALPHA, OASE in the field of broadband access network. Currently he is working at Acreo AB and Mid Sweden University as an industrial PhD student. His research interests focus on 3D video quality of service and quality of experience, network and transmission impacts on the 3D video quality and human visual system, 3D display measurement and characterization.
Marcus Barkowsky (M’09) received the Dr.-Ing.
degree from the University of Erlangen-Nuremberg in 2009.
Starting from a deep knowledge of video coding algorithms his Ph.D. thesis focused on a reliable video quality measure for low bitrate scenarios. Special emphasis on mobile transmission led to the introduction of a visual quality measurement frame-work for combined spatio-temporal processing with special emphasis on the influence of transmission errors. He joined the Image and Video Communi-cations Group IRCCyN/IVC at the University of Nantes in 2008, and was promoted to Associate Professor in 2010. His activities range from modeling effects of the human visual system, in particular the influence of coding, transmission, and display artifacts in 2D and 3D to measuring and quantifying visual discomfort and visual fatigue on 3D displays using psychometric and medical measurements.
Kjell Brunnström is an expert in image processing,
computer vision, image and video quality assess-ment having worked in the area for more than 25 years, including work in Sweden, Japan and UK. He has written a number of articles in international peer-reviewed scientific journals and conference papers, as well as having reviewed a number of scientific articles for international peer-reviewed journals e.g Journal of Opical Society of America and SPIE Optical Engineering. He has been awarded fellowships by the Royal Swedish Academy of Engineering Sciences as well as the Royal Swedish Academy of Sciences. He has supervised PhD and diploma work students. Currently, he is leading standardisation activities for video quality measurements as Co-chair of the Joint Effort Group and the Independent Lab group of the Video Quality Experts Group (VQEG). His current research interests are in video assessment both for 2D and 3D, as well as display quality related to the TCO requirements.
Mårten Sjöström (M’92) received the M.Sc in
electrical engineering and applied physics from Linköping University, Sweden, in 1992, the Licen-tiate of Technology degree in signal processing from KTH, Stockholm, Sweden, in 1998, and the Ph.D. degree in modelling of nonlinear systems from EPFL, Lausanne, Switzerland, in 2001.
He worked as an Electrical Engineer at ABB, Sweden from 1993 to 1994, was a Fellow at CERN from 1994 to 1996, and a Ph.D.-student at EPFL, Lausanne, Switzerland from 1997 to 2001. He joined the Department of Information Technology and Media, Mid Sweden University
in 2001 as a Senior Lecturer. During 2002–2006, he was appointed Head and Assistant Head of Division, respectively. He founded in 2007 a research group on multiscopic 3D visualization. As of 2008 he is Associate Professor. His current research interests are within 2D and 3D image and video processing, as well as system modelling and identification. He is a member of IEEE since 1992.
Romain Cousseau received the Engineering degree
in computer science and engineering from Polytech Nantes in 2007, Nantes, France.
He is a Research Engineer at Polytech Nantes (University of Nantes) in the Image and Video Communication Group (35 researchers) at CNRS IRCCyN lab. He is mostly engaged in research dealing with image and video quality assessment. He has been involved in several collaborative research programs: Futurim@ges on HDTV, 3DTV, HDR and JEDI on 3D quality of experience assessment. He is maintaining subjective assessment facilities for IRCCyN and supervised subjective quality assessment databases releases.
Patrick Le Callet (M’05) received the M.Sc. and
PhD degrees in image processing from Ecole poly-technique de l’université de Nantes. He was also student at the Ecole Normale Superieure de Cachan where he received the “Agrégation” (credentialing exam) in electronics of the French National Educa-tion.
He was working as an Assistant Professor from 1997 to 1999 and as a full time Lecturer from 1999 to 2003 at the Department of Electrical Engineering, Technical Institute of University of Nantes (IUT).
Since 2003, has been teaching at Ecole polytechnique de l’université de Nantes (Engineer School) in the Electrical Engineering and the Computer Science Department where he is now a Full Professor. Since 2006, he has been the head of the Image and Video Communication lab at CNRS IRCCyN, a group of more than 35 researchers. He is co-author of more than 140 publications and communications and co-inventor of 13 international patents on these topics. He has coordinated and is currently managing for IRCCyN several National or European collaborative research programs representing grants of more than 2 million euros (ITEA/HD4U on HDTV, ITEA2/JEDI on 3DTV, FUI/Scalim@ges on H264 SVC, FUI/Futurim@ges on HDR Image ren-dering and autosteroscopic TV, FUI/SVC4QoE ANR/Safim@ges on content traceability over Internet, ANR/TSAR on storage and distribution of High Resolution cultural heritage paintings, EQUIMOSE on quality of experience related to medical Imaging and PACS systems). He is mostly engaged in research dealing with the application of human vision modeling in image and video processing. His current centers of interest are 3D image and video quality assessment, watermarking techniques, and visual attention modeling and applications.
Dr. Le Callet is serving in VQEG (Video Quality Expert Group) where is co-chairing the "Joint-Effort Group" and "3DTV" activities. He is currently serving as associate editor for IEEETRANSACTIONS ONCIRCUITSYSTEM AND
VIDEOTECHNOLOGY, SPIE Journal of Electronic Imaging, and SPRINGER