Preprint Martin et al. (2020) Boreal old-growth forest structural diversity challenges aerial photographic survey accuracy. Can J For Res. 50: 155-169.
Boreal old-growth forest structural diversity challenges aerial
photographic survey accuracy
Maxence Martin*1, Hubert Morin1, Nicole J. Fenton2
I Departement des Sciences fondamentales, Universite du Quebec
a
Chicoutimi, 555 boul. de l'Universite, Chicoutimi, Quebec G7H2Bl, Canada2 Institut de Recherche sur !es Forets, Universite du Quebec en Abitibi-Temiscamingue, 445 boul. de l'Universite, Rouyn-Noranda, Quebec J9X 5E4, Canada
* Corresponding author: Tel.:
+
1 581 882 8651; [email protected]Keywords: Monitoring, ecosystem-based management, overmature, black spruce, structural attributes, sampling bias, vertical structure, Eastern Canada
Mots-cles: Inventaire, Amenagement ecosystemique, suranne, epinette noire, attributs structuraux, biais d'echantillonnage, structure verticale, Est du Canada.
Reference: Martin M, Fenton NJ, Morin H. 2020. Boreal old-growth forest structural diversity challenges aerial photographic survey accuracy. Can J For Res. 50:155-169. doi:dx.doi.org/10.1139 / cjfr-2019-0177.
Preprint \Iartin et a.I. (2020) Borea.1 old-growth forest structural diversity challenges s.eris.l photogrnphic survey
ac{·urncy. Can J For Res. 50: 15.5-169.
Abstract
The erosion of old-growth forests in boreal managed landscapes is a major issue currently faced by forest managers. However, quantifying this phenomenon requires accurate surveys. The intention of our study was to determine if aerial forest surveys accurately identify boreal old-growth forests in Quebec, Canada. Vv'e first compared stand successional stages (even-aged vs. old-growth) in two aerial surveys performed in 1968 (preindustrial aerial survey) and 2007 (modern aerial survey) on the same 2200 krn2 territory. Second, we evaluated the accuracy of the modern aerial survey by comparing its results with those of 7 4 field plots sampled in the study territory between 2014 and 2016. The t"wo aerial surveys differed significantly; 80.8% of the undisturbed stands that were identified as ';old-gn)wth'' in the preindustrial survey were classified as '\~ven-aged" in the modern survey. 60% of the st.ands identified as old-growth by field sampling were also erroneously identified as even-aged by the modern aerial survey. The scarcity of obvious old-growth at.tributes in boreal old-growth forests, as well as poorly
adapted modern aerial survey criteria (i.e. criteria requiring high vertical st.ratification and significant changes in tree species composition along forest succession), were the main factors explaining these errors. It. is therefore likely that. most of Quebec's boreal old-growth forests are currently not recognized as such in forest inventories, which could challenge the effectiveness of sustainable forest management policies.
Resume
L'faosion des superficies des vieilles fori\t.s borfales est. actudlcment un enjeux majeurs pour les gestionnaires forestier. R{~pondre efficaccmmcnt
a
ccttc problematique demande neanmoins l'accesa
des donnees d'inventaires fiables. Ainsi, l'objectif de cett.e etude eta.it de determiner si les invent.a.ires forest.iersaeriens identifient correctement les vieilles foret.s clans les paysages boreaux du Quebec, Canada. Kous avons compare les st.a.des de succession (foret equienne ou vieille foret) de deux inventaires aeriens realises en 1968 (invent.a.ire aerien preindustriel) et en 2007 (invent.a.ire aerien moderne) sur un territoire de 2200
Preprint \Iartin et a.I. (2020) Borea.1 old-growth forest structural diversity challenges s.eris.l photogrnphic survey ac{·urncy. Can J For Res. 50: 15.5-169.
km2• Kous avons aussi compare les resultats de l'inventaire aerien moderne avec
ceux obt.enus cl, partir de 74 placett.es de terrain echantillonnes entre 2014 et 2016.
Les deux inventaires aeriens etaient tres incoherents : 80.8% des peuplernents non-perturbes identifies comme
«
vieilles forets»
par l'inventaire preindustriel etaient classes cornrne«
equiens»
par l'inventaire moderne. 60% des placettes de terrain identifices comme vicilles forcts ctaient. aussi classccs << {:quicns >> parl'invcnt.aire afrien modcrnc. Le manque d'att.ributs de vieillcs forcts {:vidents ainsi quc l'ut.ilisat.ion de crit.cres inadapt.cs (c\:st.-i':t.-dire nfa:cssitant unc forte complexite verticale et d'importants changements de composition en especes arborescentes durant la succession forestiere) etaient les principaux elements expliquant ces erreurs. Il est ainsi possible que la majorite des vieilles forets boreales du Quebec ne soient pas identifies comrne telles, lirnitant refficacite des strategies de gestion durable.
Introduction
l3oreal old-growth forests, i.e. stands driven by gap-dynamics, arc defined by specific structural attributes as well as strong temporal continuity due to the absence of st.and-replacing disturbances over a significant period (Knecshaw and
Gauthier 2003; Bergeron and Harper 2009; Drapeau ct al. 2009a). They contain
many habitats features that are absent in younger stands, making them key
elements for biodiversity (Tikkanen et al. 2006; Bergeron and Fenton 2012;
Boudreault et al. 2018). However, since the middle of the 20th century, industrial-scale clear cut harvesting has primarily focussed on the oldest forest stands,
leading to a decrease of boreal old-grmvth forest area all around the circumboreal zone (Ostlund et al. 1997; Shorohova et al. 2011; Boucher et al. 2015). l'vioreover,
the short rotation of clearcut.ting systems, which have been the dominant
harvesting approach in borcal forests, inhibits the recruitment. of new old-growth
st.ands (Kuuluvaincn 2009). Consequently, managed boreal landscapes currently
face significant biodiversity issues because of the erosion of the abundance of
boreal old-growth forest habitats (Drapeau et al. 2009b; Tikkanen et al. 2006; Patry et al. 2017).
To mitigate the impact of logging on boreal old-growth forests, forest management practices nm;i,, often aim to maintain remaining boreal old-growth
Preprint \Iartin et a.I. (2020) Borea.1 old-growth forest structural diversity challenges s.eris.l photogrnphic survey ac{·urncy. Can J For Res. 50: 15.5-169.
forests in managed landscapes or to employ silvicultural treatments that preserve
old-grmvth structural attributes (Bergeron et al. 1999; Bergeron et al. 2002;
Bergeron et al. 2007; Bauhus et al. 2009; Gauthier et al. 2009; Drapeau et al.
2009b, Drapeau et al. 2016). To ensure that old-grmvth habitats in managed landscapes were representative of that present in natural landscapes, an emphasis
has been placed on management strategics that arc based on natural disturbance
regimes or stand scale processes (Gauthier ct al. 2009; Kuuluvaincn 2009). Yet,
borcal old-growth forests arc complex and diversified ecosystems. The shift from
even-age to old-growth stage does not occur in the same way from one stand to
another, varying with tree species, abiotic conditions and secondary disturbance
characteristics (Bergeron and Harper 2009; Martin et al. 2018: :vla.rtin et al.
Accepted). In addition, this shift is not discrete but continuous, making the
distinction bet\veen the t,vo stages hard to define (Pesklevits et al. 2011). Finally,
once the old-growth stage has been reached, boreal old-grmvth forests continue
to exist as structurally diverse and changing ecosystems (:~viartin et al. 2018;
Portier et al. 2018; :VIoussaoui et al. 2019).
To ensure that remnant boreal old-grmvth forests are retained during forest
harvesting, ,;1,re have to be able to identify them in forest inventory surveys. These
surveys must also be consistent over time in order to evaluate the impacts of
forest management. Exhaustive field surveys are not practical in boreal forests
because of their vast area. For this reason, aerial photographic surveys are
commonly used as a proxy for field surveys. Yet, the efficacy of aerial
photographic surveys in identifying structurally complex stands (i.e. old-growth
forests) has been challenged based on evidence that such stands can be
erroneously classifod as structurally simple (i.e. even-aged) (Boucher ct al. 2003; Cote et a.l. 2010). This implies a potential underestimation of borea.l old-growth
forest abundance by aerial surveys, which may then limit the efficacy of
subsequent management strategies in protecting boreal old-growth stands.
:VIoreover, it is important to assess if this underestimation applies equally to all
boreal old-growth forest structures. If not, specific boreal old-growth forest
structures may be particularly threatened because they are not ,vell recognized
Preprint \Iartin et a.I. (2020) Borea.1 old-growth forest structural diversity challenges s.eris.l photogrnphic survey ac{·urncy. Can J For Res. 50: 15.5-169.
Boreal old-growth forests are abundant. in Quebec's unmanaged landscapes because of relatively long (>200 years) fire cycles (Cyr et al. 2005; Grandpre et
al. 2009; Belisle et al. 2011), making Quebec an appropriate region to study aerial
photographic survey accuracy. In addition, complete aerial photographic surveys
of boreal forests have been completed int.he province since the end of the 1960s. Industrial scale logging started in the southern edge of the boreal forests in the 1940s and has progressed northward since (13oucher ct al. 2017). Thus, the first surveys often inventoried landscapes where anthropogenic influences ,vere almost
inexistent, i.e. preindustrial landscapes. Our study therefore aimed to determine if aerial forest surveys accurately identify boreal old-growth forest. in Quebec1
s landscapes dominated by black spruce - feat.her moss forests, the main
closed-forest type in Quebec's boreal territories (Rowe 1972). Specifically, our objectives
were: (1) to determine if old-growth stands are consistently identified by aerial
surveys over time, (2) t.o evaluate the accuracy oft.he most recent. aerial survey
in identifying different borea.l old-growth forest types, and (3) to identify old-growth types that arc the most likely to be confused with even-aged st.ands. \V c expected that the accuracy of the aerial photographic surveys increased over time and thus most of the old-growth forests would be accurately identified by the most recent survey. However, we also predict that stands at the beginning of the
old-growth stage will be those most commonly mistaken for even-aged stands because of the absence of any clear transition bct,vcen the two stages. This study
evaluates the accuracy of aerial photographic surveys: first by discriminating
even-aged and old-growth stands and second by identifying how well the entire structural diversity of boreal old-growth forest developement.al stages is
determined.
Vv
e discuss how efficient. is the photographic survey approach t.ointegrate boreal old-growth forests in managed landscapes and what are the
potential biases and errors. Met.hods
Study area and field sampling
In this study we used the same 2200 km" area described by :\fartin ct al. (2018) and :viartin ct. al. (Accepted), situated to the south cast of Lake Mistassini
(72°15'00"
vV
t.o 72°30'00" \V, 50°07'23" :-l' t.o 50030'00") (Figure 1). This 5Preprint \fortin ct al. (2020) Rorca.l old-growth forest structural divcrnity challenges aerial photographic survey accuracy. Can J For Res. 50:155-169.
territory is public land and part of the black spruce ( I'icea, ma.riana (Mill.))
feather moss bioclimatic domain. 13lack spruce and balsam fir (Abies balsamea
(L.)
Mill.) are the dominant tree species. They are sometimes found with jack pine, (Pinus banksiana (Lamb.), ,vhitc spruce (Picca glauca (Moench) Voss),paper birch ( Betufa papyrifera :Vfarsh.) and trembling aspen ( Populus trcnrnloidcs). The dominant surface deposits arc thick glacial tills but
watercourses are often surrounded by sand deposits or vast bogs. The topography
of
A
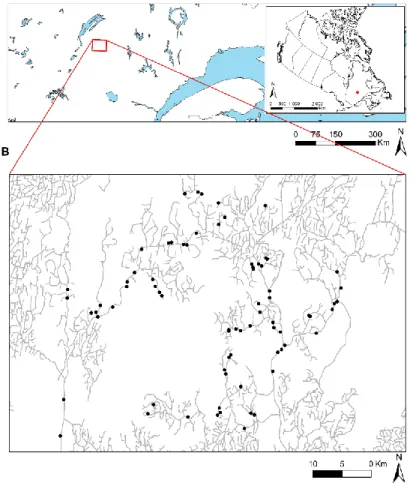
Figure l (A) Location of the 8tndy territory (red rectangle) in the
province of Q11ebec. The red dot. in the insert. map indica.1,es its loca.1.ion
in Canada. (R) Field plots (black dots) sampled in the study territory. Grey lines represent the forest road net,vork.
≥
Preprint \Iartin et a.I. (2020) Borea.1 old-growth forest structural diversity challenges s.eris.l photogrnphic survey ac{·urncy. Can J For Res. 50: 15.5-169.
the study territory is dominated by gentle hills with altitudes ranging from 350
to 750 m. :\foan annual temperature ranges from -2.5 to 0.0°C, annual rainfall (rain and snow) from 900 to 1100 mm and growing season length is from 140 to 150 days (Robitaille and Saucier 1998). Timber exploitation started in 1991 at a lmv level until the year 2000, when harvest levels increased. Consequently, all
surveys performed on this territory before 1991 represent forests free from any industrial logging activity
:'vfartin et al (2018) and l\fartin et al. (Accepted) surveyed 74 stands bet,veen 2014 and 2016 on this territory (Figure 1). St.and selection was based on stratified
random sampling of the six dominant environmental types on the study territory,
as defined by Qu6bec's l'vlinistry of Forests, \Vildlifc and Parks (MF\VP)
ecological classification (Blouin and Berger 2004), and two stand minimal age classes. The dominant environmental types can be defined by the following
Potential vegetation/Slope/ Superficial deposit/Drainage associations: Balsam fir - white birch/Medium/Till/ Iviesic; Black spruce balsam fir(\Iedium/Till/Iviesic: Black spruce - feather moss (BSFJ\I) /Low /Sand/l\Iesic; BSF:VI/Lmv /Till/l\Iesic; BSFJ'vl/ Low/Till/Subhydric; BSF:\1/Lmv/Organic/Hydric. These represent over
72%, of productive forest area on the study territory. The age classes corresponded to the theoretical stages of the transition process tmvard the old-growth stage in
Quebec boreal forests: 80-200 years (beginning of the transition) and greater than 200 years (end of the transition). Site age was assessed by a preliminary survey
through tree core sampling of five dominant and codomina.nt trees per site. Only sites accessible by road were sclect.ed and plots were systematically placed 125m away from the stand edge to limit edge effects.
In each stand ,ve collected data on: merchantable trees (diameter at breast height [dbh] 9 cm), saplings (trees with a dbh
<
9 cm and a height.>
1.30m), gapfraction and coarse woody debris volume using one 400m2 plot with nested
subplots and transects (see Table 1 for details). To determine the minimum stand age, \Ve performed a destructive sampling of basal discs on ten trees. Sampled trees were randomly selected according to their crown class (dominant,
codominant, intermediary and suppressed). At least three of these trees \Vere
dominant. trees and their height. was measured once the tree was felled t.o estimate
the maximum st.and height. Two or three trees were then sampled for each of the 7
Data Sampling design Attributes sampled
Merchantable trees
All individuals in one 20 × 20m (400m2) square plot
Diameter at breast height, species, vitality (alive, senescent, dead) and position in the canopy as defined by the Québec’s Ministry of Wildlife, Fauna and Parks typology (MRNF 2008):
- Dominant: highest trees in the stand
- Codominant: height ≥ 2/3 of dominant tree height - Intermediary: height < 2/3 and ≥1/2 of dominant tree height
- Suppressed: height < 1/2 of dominant tree height Saplings All individuals in two 10 × 10m (100m2) square
plots within the 400m2 plot Diameter at breast height, species
Gap fraction
All gaps along five 25m long transects starting from the centre of the 400 m2 plot. “Gaps” were all sections of the transects where the canopy height was less than the 2/3rds of the height of the dominant trees for a distance of > 2m along the transect
Gap length
Coarse woody debris (CWD)
All coarse woody debris that intersected four 20m long transects that followed the edge of the 400m2 plot. When a piece of CWD crossed two transects, any second encounter was skipped to avoid double-counting.
Diameter at the intersection
1
Preprint Martin et al. (2020) Boreal old-growth forest structural diversity challenges aerial photographic survey accuracy. Can J For Res. 50: 155-169.
remaining crown classes, depending on their availability within the plot. The sampled basal discs were then sanded and the tree rings measured along two radii to determinate tree age.
Cartographic data
Table 1 Description of the sampling design and the attributes sampled for each type of data studied in field plots.
The government of Quebec has conducted five decadal forest surveys; the fifth survey is still in progress. All these inventories use aerial photographs to describe forest stands. We chose to focus on the results of the first (preindustrial aerial survey) and the fourth (modern aerial survey) decadal forest inventories, because they represent the two extremes in terms of technological evolution over the time
period. On our study area, 1/15 000 aerial photographs were taken at an average altitude of 2 295m in 1968 for the preindustrial aerial survey (black and white photographs) and in 2007 for the modern aerial survey (high definition numeric
≥
Preprint \Iartin et a.I. (2020) Borea.1 old-growth forest structural diversity challenges s.eris.l photogrnphic survey ac{·urncy. Can J For Res. 50: 15.5-169.
false-colour infrared photographs). For both surveys, the boundaries of forest stands were defined according to their cartographic structural characteristics (tree species composition, age, structural complexity, height and density classes) and abiotic characteristics (slope, drainage, superficial deposit and potential vegetation classes). These characteristics \Vere interpreted by stereoscopic photo-interpretation with the help of topographic maps for the preindustrial aerial survey or a stereoscopic analysis soft.ware for the modern. The .'v1F\VP then simplified stand boundaries for the preindustrial survey only: the territory was divided in 297 m x 463 m large rectangles (15 seconds x 15 seconds in geographic coordinates, 14ha) named "tessels" (Appendix A). The cartographic structural and abiotic values attributed to each tessel were the characteristics of the preindustrial forest stand polygon situated at the tessel centroid location. Preindustrial and modern aerial surveys can therefore be compared along the tessel grid, where each centroid represents the results of both forest surveys at the centroid location.
Identification of the old-growth stages
I3ased on :dart.in ct al. (2018), the old-growth st.age starts when new cohorts begin to replace the first cohort or ·when the tree diameter distribution shifts from a Gaussian to an irregular diameter distribution. Hm;,;,'ever, field and cartographic data, as well as preindustrial and modern aerial surveys, use different parameters to describe stand structural complexity. Therefore, a
preliminary analysis ,vas necessary to homogenise the descriptors of stand
structural complexity in order to identify old-gr0vvth stands for both field and cartographic data.
For field data, we identified the old-growth stages using the methodology of :VIartin et al. (2018). First, ,ve fitted the diameter distribution of all merchantable sterns and saplings in each plot with the \Veibull distribution (Bailey and Dell 1973). A \.Veibull's shape parameter (\VSP) 1.5 indicates a normal diameter distribution and a \VSP
<
1.5 indicates an irregular diameter distribution. Second, we counted tree rings along two radii for each of the ten basal discs sampled and the maximum value was considered as the minimum age of the tree. \Ve identified the cohort of the trees for each stand. If the age difference between𝐶𝐵𝐴𝑃 = (𝐵𝐴𝑂𝑙𝑑−𝑔𝑟𝑜𝑤𝑡ℎ 𝑐𝑜ℎ𝑜𝑟𝑡 𝑡𝑟𝑒𝑒𝑠 + 0.1)
(𝐵𝐴𝑂𝑙𝑑−𝑔𝑟𝑜𝑤𝑡ℎ 𝑐𝑜ℎ𝑜𝑟𝑡 𝑡𝑟𝑒𝑒𝑠+ 𝐵𝐴𝐹𝑖𝑟𝑠𝑡 𝑐𝑜ℎ𝑜𝑟𝑡 𝑡𝑟𝑒𝑒𝑠+ 0.1) ≥
Preprint Martin et al. (2020) Boreal old-growth forest structural diversity challenges aerial photographic survey accuracy. Can J For Res. 50: 155-169.
the youngest and the oldest tree did not exceed 30 years, we considered that they were all first cohort trees. If some trees exceeded the 30-year threshold, we considered these trees as belonging to old-growth cohorts replacing the first
cohort. In this case, we looked for evidence of suppression on juvenile trees in the trees under the 30-year threshold (i.e. sustained low radial increment starting
from the pith). Trees that presented no evidence of juvenile suppression were categorized as first cohort trees while the others were categorized as old-growth cohort trees. Finally, when the majority of the trees belonged to a single 30-year age class but were mixed with individuals more than 30 years older, the older individuals were considered as survivors of the previous stand-initiating disturbance and removed from the analysis. The remaining trees were classified as first cohort trees. Then, we calculated the Cohort Basal Area Ratio (CBAP)
according to the Kneeshaw and Gauthier (2003) formula:
where BA is the basal area. Stands were defined as even-aged if WSP 1.5 and
CBAP< 0.3 and old-growth in all other cases (Martin et al. 2018). For each field plot, we also computed the eight following field structural attributes: tree density, basal area, sapling density, balsam fir proportion, coarse woody debris volume, gap fraction, maximum height, merchantable trees' Shannon Index and minimum time since the last fire (i.e. age of the oldest tree sampled) (Appendix B).
For cartographic data from the modern aerial survey, stand structure was
classified in one class among four ( even-aged, uneven-aged, irregular and layered classes, MRNF 2008), based on cohort composition and stand vertical structure,
estimated during photo-interpretation. We considered that the uneven-aged, irregular and layered classes indicated old-growth forests because their complex vertical structure and/ or the presence of different cohorts implied gap-dynamics (Table 2). In contrast, in the preindustrial aerial survey data, there were only two stand structure classes for the mature plots: "Regular" and "Irregular" (Pelletier et al. 2007), also estimated by photo-interpretation. Therefore, we
assumed the "Regular" class to be "Even-aged" while the "Irregular" class was
Surve y Structure class Age structure Structural comple xity O ld-growth stage e xtrapolate d
Fre que ncy (%)
Regular - One canopy layer
(regular) Even-aged 49.1
Irregular
-High variation in the canopy height, multiple canopy layers
(irregular)
Old-growth 50.9
Even-aged
One single cohort represent more than 75% of the canopy
(m onocohort)
One canopy layer
(regular) Even-aged 80.6
Layered
T wo cohorts represent each more than 25% of the canopy
(m ulticohort)
T wo canopy layers, with a tree height amplitude superior to 5m
(irregular)
Old-growth 0.5
Uneven-aged
T hree cohorts represent each more than 25% of the canopy
(m ulticohort)
One canopy layer
(regular) Old-growth 15.3
Irregular
T hree cohorts represent each more than 25% of the canopy
(m ulticohort)
Multiple canopy layers, with a tree height amplitude superior to
8m (irregular)
Old-growth 3.6 Preindustrial
Modern
Preprint Martin et al. (2020) Boreal old-growth forest structural diversity challenges aerial photographic survey
accuracy. Can J For Res. 50: 155-169.
for the analyses were: preindustrial dominant species, preindustrial and modern canopy densities, modern and preindustrial tree height, modern black spruce abundance (i.e. black spruce proportion in stand canopy), modern balsam fir abundance, modern jack pine abundance, modern broadleaved species abundance
(Appendix C), using the classes defined by the MFWP.
Statistical analysis
Table 2 Characteristics of the different age structures classes used by
the preindustrial and modern surveys and of the developmental stage
extrapolated ( even-aged or old-growth) for this study
For our first objective, to determine if old-growth stands are consistently
identified by aerial surveys over time, we compared the classification of stands in the two time periods (preindustrial and modern) using the 3417 undisturbed, mature centroids. We computed the error-matrix and the overall accuracy
(proportion of the centroids or field plots mapped correctly) of the even-aged and
old-growth stands in the preindustrial and modern aerial surveys using the Olofsson et al. (2013) methodology. Yet, forests are dynamic ecosystems and their structure may change over time, however as we selected only undisturbed sites, the main consistent structural change should be a shift from the even-aged to the old-growth stage. In contrast, any shift from the old-growth stage to the even-aged in the absence of any natural stand-replacing disturbance or logging
activities is unlikely and would be the result of errors in old-growth identification
φ
Preprint \Iartin et a.I. (2020) Borea.1 old-growth forest structural diversity challenges s.eris.l photogrnphic survey
ac{·urncy. Can J For Res. 50: 15.5-169.
m at least one of the aerial surveys. Then, we used logistic regress10ns to determine if centroids presenting these erroneous dynamics were the result of a specific bias. The classes of the dependent dummy variables were ,:Consistent dynamics" (same stage bet:ween the two surveys or shift from the even-aged stage to the old-growth) and "Inconsistent dynamics" (shift from old-growth to even-aged). \Ve selected as independent variables only the cartographic structural attributes that were not associated ·with each other based on the or Cramer's V values (Sheskin 2002). If a strong association between two at.tributes wa.s caused by low-abundant classes, we removed the sites defined by these classes from the dataset. Thus, centroids belonging to the ,:>80%1
' preindustrial or
modern canopy density classes were strongly associated with each other but they
only represented 255 centroids. \Ve therefore removed these sites from the final dataset (255 centroids removed from the analysis, total remaining
=
3162). The independent. variables retained for the logistic regression were preindustrial canopy density, modem balsam fir abundance and modern canopy tree density.The model '"'as run a first time with all the variables and a second time with only the significant variables, in order to obtain the most parsimonious model. Then, we used log-likelihood test, Receiver Operating Characteristic (R.OC) (Zweig and Campbell 1993) and T.iur's coefficient of discrimination (COD, T.iur 2009) to assess the model predictive ability.
For our second objective, evaluating the accuracy of the most recent aerial survey in identifying different boreal old-growth forest cover types, we compared the age
structure (monoeohort or mult.ieohort), the diameter distribution (regular or irregular) and the old-growth stage (even-aged or old-growth) of the 74 field plots based on our field inventories with the results of the typology of the recent survey .. Error-matrixes vvere computed and the overall accuracies (proportion of the area mapped correctly) were calculated for each matrix. In addition, ,ve compared the differences in field-sampled structural attributes according to the accuracy of the modem aerial survey in identifying their age structure, structural complexity or old-growth stage (Identical: same result between field and aerial surveys; Different: different result between field and aerial surveys). Student. tests were used to assess the statistical significance of these differences bet.ween surveys if requirements (homoscedast.icity and normality of the independent variable for
Preprint \Iartin et a.I. (2020) Borea.1 old-growth forest structural diversity challenges s.eris.l photogrnphic survey ac{·urncy. Can J For Res. 50: 15.5-169.
belonged to the "unproductive" class in the modern aerial survey were not assigned to structural complexity or age structure classes. These sites were
removed for this analysis, leaving 70 fields plots.
Finally, for our third object.ive1 to identify old-growth types that are more likely to be confused with even-aged stands, we aimed to discriminate the vertical
structure of the sampled stands based on the structural parameters that
challenged aerial survey accuracy. First, we determined the proportion of trees from each crcnvn class (dominant; codominant, intermediate and suppressed) in each plot. Then, we performed a multivariate regression tree analysis (De'ath 2002) with 100 repetitions using the structural parameters having a significant.
impact on survey accuracy in the previous analyses (logistic regression, Student
or "\Vilcoxon tests). "\Ve considered that balsam fir proportion in basal area; gap fraction and maximum height computed for the field plots corresponded to the
respective at.tributes computed for aerial surveys: modern balsam fir abundance,
modern canopy density (inverse of the gap fraction) and modern stand height. \Ve selected the optimal regression tree based on the best balance bet,veen a lmv
relative error and a limited number of groups. This analysis was performed using only the field plots sampled in 2015 and 2016 identified as productive by the modern aerial survey ( 67 plots); as some field structural at.tributes \Vere missing
for the field plots sampled in 2014. \Ve then computed old-growth stage
error-rnatrixes and overall accuracies bet,veen modern aerial and field surveys for each cluster.
All the statistical analyses were performed using R-software, version 3.3.1 (R
Development Core Team 2016), using the frnsb (::-.Ja.ka:r:awa 2017); ROCR (Sing
et al 2005), sjstats (Liidecke 2018), vegan (Oksanen et al. 2018) and rnvpart (Therneau and Atkinson 2014) packages. A p-threshold of 0.05 assess the tests significance.
Results
Comparison of the aerial surveys
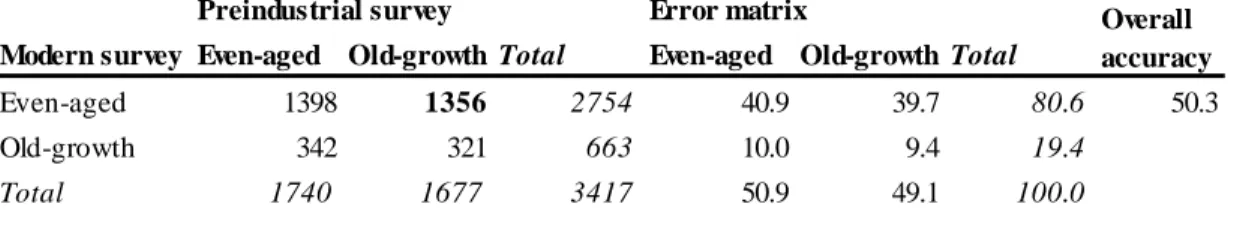
:-Jearly fourty percents of the centroids (40.9%) presented an even-aged structure
in both aerial surveys (Table 3). Yet, 39. 7% of the plots showed an inconsistent 13
Preindustrial survey Error matrix
Modern survey Even-aged Old-growth Total Even-aged Old-growth Total
Even-aged 1398 1356 2754 40.9 39.7 80.6 50.3
Old-growth 342 321 663 10.0 9.4 19.4
Total 1740 1677 3417 50.9 49.1 100.0
Overall accuracy
Preprint Martin et al. (2020) Boreal old-growth forest structural diversity challenges aerial photographic survey
accuracy. Can J For Res. 50: 155-169.
structural evolution, i.e., an old-growth structure in the preindustrial aerial
survey and an even-aged structure in the modern aerial survey. Hence, 80.1% of the undisturbed centroids identified as old-growth in the preindustrial survey were identified as even-aged in the modern. The remaining old-growth stage combinations were less abundant (10% shifted from even-aged to old-growth and
9.4% of centroids were stable old-growth centroids). The strong changes between the two surveys ( 49. 7% of the plots presenting a different structure) resulted in a low overall accuracy (50.3%) and most of these changes were inconsistent with natural forest dynamics in the absence of any stand-replacing disturbance. This implied a significant bias in at least one of the aerial surveys.
Table 3 Error-matrix between the preindustrial and modern aerial surveys. Bold results refer to inconsistent structural evolution, i.e.
the shift from old-growth to even-aged between the preindustrial and
modern aerial surveys in the absence of any stand-replacing
disturbance.
All the explanatory variables of the logistic regression model comparing centroid structural evolution between the surveys (i.e. consistent or inconsistent) were
significant (Appendix D). In addition, the model presented a good predictive
ability, with a ROC
=
0.71 and a COD=
0.14. The parameters associated with inconsistent structural evolution were: lower modern abundance of balsam fir, generally lower pre-industrial canopy density and higher modern canopy density. Although balsam fir was present in more than 25% of the centroids showing a consistent structural evolution, this species was almost absent in the plots withan inconsistent structural evolution (Figure 2). Furthermore, centroids
presenting a consistent structural evolution mainly belonged to the preindustrial canopy density class [60%-79.9%]. In contrast, centroids defined by an
Preprint Martin et a.l. (2020) 13oreal old-growth forest structural diversity challenges aerial photographic survey accuracy. Can .J lcor Hes. 50:155-169.
dem,ity classes [25%-39.9%] and [40%-39.9%]. Centroids belonging to the modern canopy density classes [60-79.9%] were more abundant in the inconsistent structural evolution group in comparison to consistent structural evolution group. Yet, differences in modern canopy density according to the structural evolution were less striking than those observed for the preindustrial canopy density.
Therefore, stands that shifted from the old-gwwth to the even-aged stage
between the two surveys are mostly pure black spruce stands with a sparse canopy. A 100 ~ ~ Vl 75 "C
·o
...
'E a, (J 50...
0 'E QI (J...
25 a, a. 0 p-value<0.001Modern balsam fir abundance B
I
~25% of the canopy <25% of the canopy p-value<0.001 Consist. lncons. Evolution Preindustrial canopy density (60%-79.9%] (40%-59.9%] (25%-39.9%] C p-value<0.001 Modern canopy density•
(60%-79.9%]•
[40%-59.9%]•
(25%-39.9%]Fignre 2 Ilistogrnm of the dass distrib11tion and Jrval11e of the significant parameters according to the logistic regression model comparing centroids defined by a consistent or an inconsistent structural evolution, separated depending on the binary dependant variable: (A) Modern balsam fir abundance, (13) Preindustrial tree densit.y, (C) J\1odern t.ree density. ConsisL.: consistent. st.ruct.urnl
evolution: Tncons.: Tnconsistcnt structural evolution. Cornistcnt
structural evolution refers to the same stage between the two surveys or shift from the even-aged stage to the old-growth between the
preindustrial and modern aerial surveys. Inconsistent refers to shift
from old-growth to even-aged between the preindustrial and modern surveys. The characteristics of the independent variables' classes arc presented in A ppcndix B.
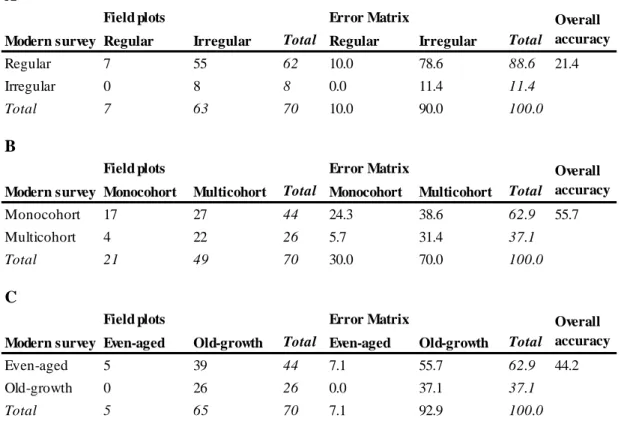
Modern survey Regular Irregular Total Regular Irregular Total
Regular 7 55 62 10.0 78.6 88.6 21.4
Irregular 0 8 8 0.0 11.4 11.4
Total 7 63 70 10.0 90.0 100.0
Modern survey Monocohort Multicohort Total Monocohort Multicohort Total
Monocohort 17 27 44 24.3 38.6 62.9 55.7
Multicohort 4 22 26 5.7 31.4 37.1
Total 21 49 70 30.0 70.0 100.0
Modern survey Even-aged Old-growth Total Even-aged Old-growth Total
Even-aged 5 39 44 7.1 55.7 62.9 44.2 Old-growth 0 26 26 0.0 37.1 37.1 Total 5 65 70 7.1 92.9 100.0 Overall accuracy Overall accuracy Overall accuracy A B C
Field plots Error Matrix
Field plots Error Matrix
Field plots Error Matrix
Preprint Martin et al. (2020) Boreal old-growth forest structural diversity challenges aerial photographic survey
accuracy. Can J For Res. 50: 155-169.
Comparison of cartographic survey with field survey
The modern aerial survey was more accurate in discriminating monocohort and multicohort stands (Overall accuracy
=
56%, Table 4A) than regular andirregular stands (Overall accuracy
=
21.4%, Table 4B), even if all these results were low. As a consequence, the modern aerial survey failed to correctly identify the successional stage for half of the field plots (Overall accuracy=
44%, Table4C). This error was specifically related to old-growth stands, as 40% of the old-growth field plots were
Table 4 Error-matrixes between the field and modern aerial surveys
for stand (A) structural complexity, (B) age structure and (C)
old-growth stage.
Variable Structural parameter
Similarity between field and aerial surveys
p-value Identical Different Structural complexity (n identical = 15; n different = 55) TD 996.66 ± 465.3 932.27 ± 349.55 BA 20.61 ± 8.39 17.46 ± 6.77 BFP 0.12 ± 0.16 0.13 ± 0.23 WSP 1.41 ± 0.7 0.93 ± 0.26 GF 52.82 ± 25.29 62.96 ± 24.39 CWD 75.57 ± 71.09 57.73 ± 45.97 MH 19.51 ± 3.21 18.59 ± 2.76 SD 2506.66 ± 2322.58 2670.45 ± 1877.11 SI 0.22 ± 0.14 0.12 ± 0.12 <0.05 CBAP 0.4 ± 0.36 0.62 ± 0.34 <0.05 MTSLF 180.00 ± 65.88 202.07 ± 60.76 Age Structure (n identical = 39; n different = 31) TD 892.94 ± 355.12 1012.9 ± 393.16 BA 18.31 ± 7.28 17.9 ± 7.21 BFP 0.16 ± 0.24 0.09 ± 0.18 WSP 1.06 ± 0.52 1.00 ± 0.3 GF 57.33 ± 27.15 64.92 ± 21.31 CWD 66.18 ± 54.81 55.72 ± 49.18 MH 19.03 ± 3.03 18.48 ± 2.64 SD 2502.56 ± 1991.56 2802.41 ± 1947.96 SI 0.18 ± 0.14 0.09 ± 0.11 <0.01 CBAP 0.5 ± 0.38 0.66 ± 0.3 MTSLF 183.76 ± 60.03 214.41 ± 61.3 <0.05
Preprint Martin et al. (2020) Boreal old-growth forest structural diversity challenges aerial photographic survey accuracy. Can J For Res. 50: 155-169.
Table 5 Mean values, standard deviation (in italics) and p--values,
based on the Student or Wilcoxon test of the structural parameters of
the field plots between those for which the diameter structure or the age structure have been correctly identified (identical) by the modern aerial survey and those incorrectly identified (different). The absence of values in the p--value column indicates a non-significant result. TD:
Tree density (n/ha), BA: basal area (m2/ha), BFP: balsam fir
proportion (%), WSP: Weibull's shape parameter, GF: Gap fraction
(%), CWD: Coarse woody debris volume (m3/ha), MH: Maximum height (m), SD: Sapling density (n/ha), SIMT: Shannon Index of the
merchantable trees, CBAP: Cohort Basal Area Proportion, MTSLF:
Mean time since last fire (years).
Preprint \Iartin et a.I. (2020) Borea.1 old-growth forest structural diversity challenges s.eris.l photogrnphic survey ac{·urncy. Can J For Res. 50: 15.5-169.
identified as such by the modern survey, while all the even-aged field plots were
accurately identified. Overall, the modern aerial survey tended to overestimate
the abundance of even-aged stands on the landscape. The field structural
attributes that explained the errors in the identification of the structural
complexity classes in the modern aerial survey \Vere the Shannon Index of the merchantable trees and the cohort basal area proportion (Table 5). For the age structure, the Shannon Index of the merchantable trees and the minimum time since the last fire ,vere the parameters that best explained age structure errors.
Sites erroneously identified, for both age structure and structural complexity, had a lower Shannon Index of the merchantable trees but an equivalent balsam fir proportion value, indicating that other species than balsam or black spruce ( e.g. jack pine, white birch, aspen or ,vhite spruce) may have influenced these results.
In addition, the progressive replacement of the first cohort1 defined by the cohort
basal area proportion, or the stand age, defined by the minimum time since the
last fire, had different influence on modern survey accuracy. Indeed, cohort basal area proportion was only significantly different for structural complexity, ,vhile the minimum time since the last fire was only significantly different. for the age structure. It suggests that these processes have different impacts on st.and structure and thus caused different errors in the modern survey. Overall, older
monospecific stands dominated by old-growth cohorts were more likely to he inaccurately categorized than younger stands where the first cohort was still dominant. and/or where tree diversity was higher.
vVhich borcal old-gnnvth strnctures arc less accura.tcly classified by the modern acria.1 survey:
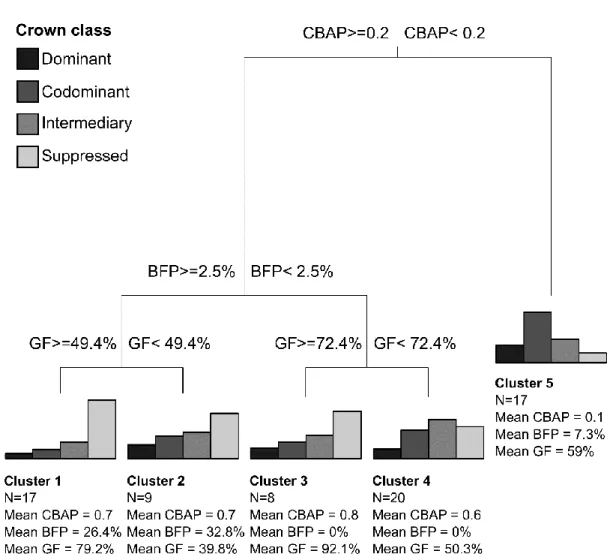
Based on the results of the logistic regression and of the \Vilcoxon or Student tests, balsam fir proportion, gap fraction, Shannon Index of the merchantable trees, CI3AP and minimum time since the last fire were the main field structural attributes selected to construct the multivariate regression tree. The optimal tree was divided into 5 clusters (Figure 3), where CBAP is the first cut-off factor
(threshold value
=
0.2), balsam fir proportion the second (threshold value=
2.57% for clusters 1-4) and gap fraction the third (threshold value
=
49.4%, for clusters 1-2 and threshold value=
72.4% for clusters 3-4).Preprint \Iartin et a.I. (2020) Borea.1 old-growth forest structural diversity challenges s.eris.l photogrnphic survey
ac{·urncy. Can J For Res. 50: 15.5-169.
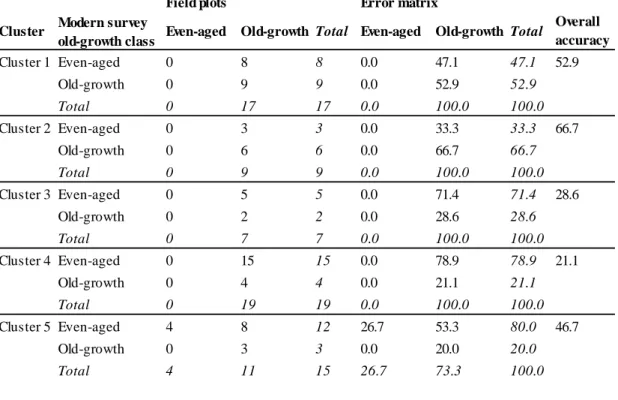
Cluster 1 contained most of the mixed black spruce - balsam old-growth stands and vvas defined by a high gap fraction. The majority of the merchantable trees belonged to the suppressed crown class. All field plots ,vere old-growth and around half of them ,vere accurately identified as such by the modern aerial
survey in this cluster (Overall accuracy
=
52.9%, Table 56). Cluster 2 containedthe remaining mixed black spruce balsam old-growth stands, with a lower gap
fraction than cluster 1. Again, all field plots were old-growth. Suppressed trees st.ill dominated the canopy but trees from the other layers were more abundant. in comparison to cluster 1. This cluster ,;1,ras better identified by the aerial survey as being olcl-grov;,rth (Overall accuracy = 66.7%). Cluster 3 contained a small part of the pure black spruce old-growth stands and was defined by the highest gap fraction among the clusters. The vertical structure of cluster 3 was intermediate between cluster 1 and cluster 2. Less than one-third of the field plots belonging to this cluster were accurately classified by the modern aerial survey ( Overall
accuracy
=
28.6%). Cluster 4 included most of the pure black spruce old-growthst.ands, ·with a lower gap fraction compared to cluster 3. In contrast to the previous clusters, trees from the intermediate crown class were dominant in
cluster 4, while suppressed and codominant trees were present in similar
proportions. Around one fifth of the field plots were accurately classified by the modern aerial survey in this cluster ( Overall accuracy = 21.1
%
)
.
Finally, cluster 5 contained stands at the beginning of old-growth transition, including those containing a small proportion of balsam fir. The vertical structure of cluster 5 differed from those of the previous clusters, as trees belonging to the codominant crown class were more frequent. All the even-aged stands and more than one third of the old-growth stands were accurately identified by the modern aerialsurvey (Overall accuracy = 46.7%).
Preprint :\fartin et al. (2020) Boreal old-growth forest structural diversity challenges aerial photographic survey
accuracy. Can J For Res. 50: 155-169.
Crown class
•
Dominant•
CodominantII
IntermediaryD
Suppressed BFP>=2.5% GF>=49.4% GF< 49.4%I
I_JJ
Cluster 1 Cluster 2 N=17 N=9Mean CBAP = 0.7 Mean CBAP = 0.7
CBAP>=0.2 CBAP< 0.2 I BFP< 2.5% GF>=72.4% GF< 72.4%
I
I
...,[]
Cluster 3 Cluster 4 N=8 N=20Mean CBAP = 0.8 Mean CBAP = 0.6
Mean BFP = 26.4% Mean BFP = 32.8% Mean BFP = 0% Mean BFP = 0%
Mean GF = 79.2% Mean GF = 39.8% Mean GF = 92.1% Mean GF = 50.3%
~
Cluster 5 N=17 Mean CBAP = 0.1 Mean BFP = 7.3% Mean GF = 59%Figure 3 Dendrogram of the multivariate analysis performed on the
di8tribntion of the canopy laycrn in the field plot8. Histogram rcprcRcnt
the mean frequency of the canopy layers category in each class. CBAP:
Cohort nasal Area Ratio, TIFP: Balsam fir proportion (%), GF: Gap fraction (%).
Error matrix
Cluster Modern survey
old-growth class Even-aged Old-growth Total Even-aged Old-growth Total
Cluster 1 Even-aged 0 8 8 0.0 47.1 47.1 52.9 Old-growth 0 9 9 0.0 52.9 52.9 Total 0 17 17 0.0 100.0 100.0 Cluster 2 Even-aged 0 3 3 0.0 33.3 33.3 66.7 Old-growth 0 6 6 0.0 66.7 66.7 Total 0 9 9 0.0 100.0 100.0 Cluster 3 Even-aged 0 5 5 0.0 71.4 71.4 28.6 Old-growth 0 2 2 0.0 28.6 28.6 Total 0 7 7 0.0 100.0 100.0 Cluster 4 Even-aged 0 15 15 0.0 78.9 78.9 21.1 Old-growth 0 4 4 0.0 21.1 21.1 Total 0 19 19 0.0 100.0 100.0 Cluster 5 Even-aged 4 8 12 26.7 53.3 80.0 46.7 Old-growth 0 3 3 0.0 20.0 20.0 Total 4 11 15 26.7 73.3 100.0 Overall accuracy Field plots
Preprint Martin et al. (2020) Boreal old-growth forest structural diversity challenges aerial photographic survey
accuracy. Can J For Res. 50: 155-169.
Discussion
Table 6 Error-matrixes between the field and modern aerial surveys
for the five clusters identified by multivariate analysis.
The results of the preindustrial and modern aerial surveys were often inconsistent. In particular, a large proportion of the undisturbed mature stands that were classified as old-growth in the preindustrial survey were classified as even-aged in the modern survey; clearly there is an error in one of the surveys. These changes occurred primarily in sparse pure black spruce stands. The comparison to field plot data clearly showed that the modern aerial survey underestimated the abundance of old-growth forests on the landscape with its accuracy decreasing with stand age, first cohort replacement and the reduction in tree species diversity. Differences in vertical and horizontal structures among even-aged, monospecific black spruce old-growth and mixed black spruce -balsam fir old-growth stands may have also challenged the accuracy of the modern aerial survey.
Preprint \Iartin et a.I. (2020) Borea.1 old-growth forest structural diversity challenges s.eris.l photogrnphic survey ac{·urncy. Can J For Res. 50: 15.5-169.
Aerial surveys underestimate boreal olcl-growtli forest abundance and diversity
The lack of accuracy in the identification of boreal old-growth forests in the
modern aerial survey was unexpected and worrying. This survey was performed during a period where the importance and relative abundance of old-growth forests was well known and the erosion of their abundance on the landscape in
Eastern Canada ,vas already identified as a major issue (Kneeshaw and Gauthier
2003). Thus, boreal old-growth forests ,vere a contemporary management issue and we expected that modern survey would provide increased precision on their status and distribution over the landscape. In addition, boreal old-growth forests
were probably abundant. in the study territory, where the theoretical fire cycle
over the last century ranges between 200 and 272 years (Gauthier, Raulier, ct. al.
2015: Couillard et al. 2016). In Eastern Canadian boreal forests, the onset of the old-growth stage may vary from one stand to another, but almost all stands that
have not burned in the last 200 years present a complex vertical and horizontal
structure C\fartin et al. 2018). Thus, stands with a clearly complex structure
should represent at least half of the productive landscape, even if recent fires and
logging activities may have decreased their current abundance (Appendix E).
Yet, the modern aerial survey identified only 5.8% of the productive forests and
19.4% of the productive mature stands as structurally old-gnnvth. According to
the luw accuracy of the modern aerial survey in the identification of boreal
old-grmvth forests on the study territory, it is therefore likely that most of the boreal
old-gruwth forests were not identified.
Boreal old-growth forests were twice as abundant in the preindustrial vs. the
modern aerial survey (respectively 49% and 19.4% of the centroids). This
frequency is close to the theoretical old-growth frequency that can be estimated
from the landscape disturbance regime (Appendix E). Yet, the accuracy of the
preindustrial survey cannot be estimated with our field data because of the long
time interval between the preindustrial survey and our field survey. The efficacy
of the preindustrial aerial survey in identifying old-growth should be assessed
with field surveys in future research projects, for example using the temporary
and permanent field plots surveyed by the :tvIF\tVP for each decadal forest survey, as it is possible that this survey ,vas more accurate than the modern. Determining the preindustrial aerial survey error rate would also help to better identify the
Preprint \Iartin et a.I. (2020) Borea.1 old-growth forest structural diversity challenges s.eris.l photogrnphic survey ac{·urncy. Can J For Res. 50: 15.5-169.
fact.ors explaining the differences with the modern aerial survey. :vioreover, the
criteria used to define the old-grmvth stands changed betv.reen the hvo aerial surveys. In the preindustrial aerial survey, the qualification of structurally
complex mature stands was based on the subjective determination of a strong
variation in tree heights (Pelletier et al. 2007). In contrast, in the modern aerial
survey old-growth stands were identified based on specific canopy cover thresholds of the cohort structure and the variation in tree height (11RNF 2008).
As a consequence, these changes in the methodology of photointcrprctation of
forest structure may have caused a decrease in identifying accurately old-growth forests in our study area.
Acrfal survey thresholds and indicaton,· aTc iITclcvant for borcal fon:sts
Stands perceived as old-growth in the preindustrial aerial survey but as even-aged in the modern aerial were mainly sparse pure black spruce forests.
Environments favouring pure black spruce stands at the end of succession in this region arc often less productive than those favouring mixtures of black spruce and balsam fir (:Messaoud et al. 2014; .\fart.in et al. 2018; Portier et al. 2018) . .\/Joreovcr, a sparser canopy may indicate a low stand productivity caused by paludification or low-severity fires (Fenton ct al. 2005; Smirnova ct al. 2008). As a result, stands that shifted from an old-growth to an even-aged structure
between the two surveys were probably defined by relatively low stand heights. Yet.1 to be classified as irregular1 and therefore old-growth, by the modern aerial
survey, tree height had to vary by at least 8 rn for the irregular structure class or 5m for the bi-cohort ( this class h0vvever represented only 0.5% of the
centroids). Such thresholds are relevant in biornes where trees get taller with age,
leading to a complex vertical stratification of old-grmvth stands (Franklin et al. 2002). However, borcal old-growth forest characteristics often differ from those
of old-growth forests from other biomes, because of the harsh climatic conditions
that limit tree height and longevity (Bergeron and Harper 2009). Thus, many boreal old-grm;i,,th forests may be erroneously identified a.s structurally even-aged
because the thresholds used by the modern aerial survey require too large of a height differential.
Preprint \Iartin et a.I. (2020) Borea.1 old-growth forest structural diversity challenges s.eris.l photogrnphic survey ac{·urncy. Can J For Res. 50: 15.5-169.
The difficulty in detecting structurally complex pure black spruce old-growth
stands may be reinforced by their poorly stratified vertical structure. Indeed, for most. of these stands, codominant., intermediate and suppressed trees represented an equal proportion of the canopy. In contrast, suppressed trees dominated the canopy of mixed black spruce - balsam fir old-gro-wth stands. This stratification may result from balsam fir's greater sensitivity to spruce budworm out.breaks,
root rot and windt.hrow, leading to higher mortality rates in comparison to black
spruce (Ruel 2000; !vforin ct. al. 2009). In contrast., the canopy of pure black spruce olcl-grm~rth stands may have been perceived as vertically homogeneous, and then confounded with an even-aged canopy, resulting rn their misclassification as "even-aged" stands. Thus, from an aerial perspective, stand
vertical stratification ,vas more visible for mixed black spruce - balsam fir
old-growth st.ands than for pure black spruce.
Identifying pure black spruce old-growth stands can also be challenging because of the possible absence of tree species transition between the even-aged and
old-grmvth stages. Indeed: because of its semi-serotinous cones and its layering
ability: black spruce can either act as a pioneer or a late-successional species
(Harvey et al. 2002). As a consequence, black spruce stands with no changes in
tree species composition since the last. stand-replacing disturbance are common in East.em Canadian boreal forests driven by wildfires as stand-replacing
disturbances (Harper et al. 2002; :VIartin et al 2018). Consequently, differentiating several black spruce cohorts in old-growth stands is challenging,
in particular from aerial photographs. In contrast, the position of the other tree
species in forest. succession is well defined. Therefore, it may be easier to identify
the old-growth stage of stands containing tall and old pioneer species, like aspen, or late-successional species, like balsam fir, in comparison to monospecific black spruce stands.
Distinguishing an old-grmvt.h forest from an even-aged is difficult, because there
is no clear shift between the two stages (Pesklevits et al. 2011). For the same
reason, defining thresholds that discriminate even-aged and old-growth stands is
also challenging. The combination of the vVeibull's shape parameter and cohort
basal area proportion to identify boreal old-grmvth forests has proven to be efficient (:\Iartin et al. 2018) and represents the same cartographic structural
Preprint \Iartin et a.I. (2020) Borea.1 old-growth forest structural diversity challenges s.eris.l photogrnphic survey ac{·urncy. Can J For Res. 50: 15.5-169.
attributes as those used by the modern aerial survey (i.e. increasing vertical
complexity and progressive replacement. of the first cohort). However; it is possible that field and aerial old-growth st.age thresholds did not. totally mat.ch,
especially for the definition of the beginning of t.he old-gruwt.h stage.
Consequently: \Ve expected that. stands inaccurately identified as even-aged by aerial surveys \Vfrnld have been mostly stands at the beginning of the old-growth transition . .\Jcvcrthcless, stands at the beginning of the old-gnrwth transition were grouped in the same cluster (Cluster 5). Only 20.5% of the field plots identified a.s old-grovlth by the field survey but a.s even-aged by the modern aerial survey
belonged to this cluster. Thus, the discrepancies observed between modern aerial and field surveys were not ca.used by a bias due to inconsistent old-growth
thresholds but. by the modern aerial survey inaccuracy, as most of these stands
were unambiguously old-grmvt.h. :.\foreover, t.he field plots \Vere 400m2 in size, while forest polygons often have an area of several hectares. As a result, ground
plots may not have been able t.o capture internal variability within a polygon.
However, the polygons of the decadal forest inventories arc supposed to represent homogeneous st.ands in terms of structure and age. In addition, we have mainly
identified uneven-aged stands with complex structures in the field plots and very few regular even-aged stands. It seems unlikely that we have mainly s<1mpled
small old-growth residual forests within even-aged stands since site selection was random. \Vhile it is possible that the structure of old-growth boreal forests can
be highly variable within the same stand, we think tha.t the field inventories were able to determine whether the polygons sampled \\'ere old-growth or even-aged
forests.
Conclusion and management implication
I3oreal old-growth forests structural specificities challenged aerial survey accuracy, causing a significant. underestimation of their abundance on the study territory. This error was reinforced by the standardi;,;ation of Qu6bec's decadal
forest survey methodology for all the province. :tviodern survey thresholds and
indicators were thus poorly adapted to boreal old-growth forests common structural attributes, i.e. a. low tree height., the lack of clearly delineated canopy strata and t.he absence of any species transit.ion bet.ween the even-aged and the
old-grmvth stage. In contrast., t.he transition period between the even-aged and
Preprint \Iartin et a.I. (2020) Borea.1 old-growth forest structural diversity challenges s.eris.l photogrnphic survey ac{·urncy. Can J For Res. 50: 15.5-169.
the old-growth stage had no influence on aerial survey accura.cy, as the majority of the old-grmvth stands inaccurately identified as even-aged were true old-growth stands.
Pure black spruce old-growth stands were those that were the most confused with even-aged stands by the modern aerial survey. Yet, the majority of Quebec's
boreal forests become pure black spruce stands at the end of succession.
Therefore, the majority of Quebec's boreal forests may be erroneously identified as structurally even-aged by the modern aerial survey. :tvioreover; pure black
spruce old-growth stands arc not only abundant but. also structurally diverse. Thus, the results of our study raise concerns about the capacity of forest.
management. t.o maintain the preindustrial borcal landscape diversity as most. boreal old-growth forests arc not well identified by forest inventories.
The efficacy of photographic aerial surveys in idcntificatying and discriminating
of complex forest structures has been questioned previously and the results of our
study confirm these concerns. Therefore, new techniques should be used to accurately identify boreal old-growth forests (Chaieb et al. 2015). LiDAR (Light Detection And Ranging) technology is therefore a promising tool for a quick and
efficient. discrimination of st.and structures (Kane ct al. 2010; Jayathunga ct al. 2018). In a change from the modern (fourth) aerial forest survey; the ongoing fifth decadal forest survey collects both photographic and LIDAR. data, opening
the way for a better identification of boreal old-growth forests. Hm;i,,ever, the
efficacy of LIDAR-derived metrics to discriminate boreal old-gro,vth and even-aged forests has not yet been demonstrated. As a consequence, future research must be performed to determine if the transition from aerial photographic to LIDAR surveys ,vill improve the identification of boreal old-growth forests in managed landscapes.
Acknowledgements
\Ve thank Audrey Bedard, Jean-Guy Girard, Emilie Chouinard, 1/Jiguel l'vlontoro Girona, Anne-Elizabeth Harvey, Aurelie Cuveliere; Evelyn Belien and Angelo
Fierravanti for their precious help during field sampling. Yan Boucher and Pierre
Preprint \Iartin et a.I. (2020) Borea.1 old-growth forest structural diversity challenges s.eris.l photogrnphic survey ac{·urncy. Can J For Res. 50: 15.5-169.
their data collected from the study territory. vVe also thank the MFFP for sharing
their surveys and disturbances database as ,vell as two anonymous revie,vers for
their useful suggestions and comments on the previous version of the manuscript. Finally, ,ve would like to thank Ellen I'viacdonakl: Canadian Journal of Forest
Research Co-Editor-in-Chief; for her judicious cormnents during manuscript finalization. Funding for this project. was provided by the Fonds QudJccois de la Recherche sur la Nature ct lcs Technologies (FQRNT) and the :'Jatural Sciences
and Engineering Research Council of Canada (:'JSERC) Universit.6 du Quebec
a.
Chieoutimi (UQAC) industrial research chair "Chaire de reeherche industrielle du CRSNG sur la eroissanee de l'epinette noire et l'influenee de la tordeuse des bourgeons de l'epinette sur la variabilite des pa.ysages en zone boreale".References
Angclstam P, Kuuluvainen T. 2004. I3oreal Forest Disturbance Regimes ,
Successional Dynamics and Landscape Structures : A European Perspective. Ecol l3ull.(51):ll7 136.
Bailey RL, Dell R. 1973. Quantifying Diameter Distributions with the vVcibull Function. For Sci. 19(2):97-104.
Bauhus J, Puettmann K, :.'1essier C. 2009. Silviculture for old-growth attributes. For Ecol :tvlanage. 258(4):525-537. doi:10.1016/j.foreeo.2009.01.()53.
Belisle AC, Gauthier S, Cyr D, Bergeron Y, Jvlorin H. 2011. Fire Regime and Old-Growth Boreal Forests in Central Quebec , Canada: An Ecosystem
:.fanagement Perspective. Silva Fenn. 45(:'Jovember) :889-908.
Bergeron Y, Fenton NJ. 2012. Boreal forests of eastern Canada. revisited: old
growth, nonfire disturbances, forest succession, and biodiversity. Botany. 90(6):509-523. doi:10.1139/b2012-034.
Bergeron Y, Harper KA. 2009. Old-growth forests in the Canadian boreal: the excep- tion rather than the rule? In: \iVirth C, Gleixner G, Heimann :tvI, editors. Old-Growth Forests: Function, Fate and Value. Ecological. Kew York: Springer. p. 285-300.
Preprint \Iartin et a.I. (2020) Borea.1 old-growth forest structural diversity challenges s.eris.l photogrnphic survey
ac{·urncy. Can J For Res. 50: 15.5-169.
BergeronY, Harvey B, Leduc A, Gauthier S. 1999. Forest management guidelines based on natural disturbance dynamics : Stand and forest-level considerations. For. Chron. 75: 49-54
Bergeron Y, Leduc A, Harvey A, Gauthier S. 2002. :-Jatural fire regime: A guide for sustainable management of the Canadian boreal forest. Silva Fenn. 36:
81-95.
Bergeron Y, Drapeau P., Gauthier S, Lecomte K. 2007. Using knowledge of natural disturbances to support sustainable For. Chron. 83: 326-337.
Blouin J, Berger J-P. 2004. Guide de reconnaissance des types ecologiques -Region ecologique Ge (Plaine du lac Opemisca) - Region ecologique Gd (Coteaux du lac Assinica.) - Region ecologique Ge (Cot.ea.ux de la riviere Kest.aoca.no) -Region ecologique 6f (Coteaux du lac :tvlistassini). lVIinistere des Ressources naturelles, de la Faune et des Pares, Foret Quebec, Direction des inventaires forestiers, Division de la classification ecologique et productivite des stations. Boucher D, De Grandpre L, Gauthier S. 2003. Developpement d'un outil de classification de la structure des peuplement.s et comparaison de deux territ.oires de la pessiere
a
mousses du Quebec. For Chron. 79(2):318-328. doi:10.5558/tfc79318-2.Boucher D, De Grandpre L, Kneeshaw D, St-Onge B, Ruel J-C, \iVa.ldron K, Lussier J-:t\,L 2015. Effects of 80 years of forest management on landscape structure and pat.tern in the eastern Canadian boreal forest. La.ndsc Ecol.(30):1913-1929. doi:10.1007 /s10980-015-0220-6.
Boucher Y, Perrault-Hebert. M, Fournier
R.
Drapeau P, Auger I. 2017. Cumulative patterns of logging and fire (1940-2009): consequences on the structure of the eastern Canadian borea.l forest. Landsc Ecol. 32(2):361-375. doi:10.1007 /s10980-016-0448-9.Boudreault C, Paquette M, Fenton NJ, Pothier D, Bergeron Y. 2018. Changes in bryophytes assemblages a.long a chronosequence in ea.stern borea.I forest of Quebec. Can J For Res. 48(7):821-834. doi:10.1139/cjfr-2017-0352.
Preprint \Iartin et a.I. (2020) Borea.1 old-growth forest structural diversity challenges s.eris.l photogrnphic survey ac{·urncy. Can J For Res. 50: 15.5-169.
Chaieb C, Fent.on KJ, Lafleur B, Bergeron Y. 2015. Can \Ve l"se Forest Inventory :\fapping as a Coarse Filter in Ecosystem Based :\fanagernent in the Black Spruce
Boreal Forest.'? Forests, 6(4), 1195-1207. htt.ps://doi.org/10.3:390/f6041195 Cote G, Bouchard \I, Pothier D, Gauthier S. 2010. Linking stand at.tributes to cartographic information for ecosystem management. purposes in the boreal forest
of eastern Quebec. For Chron. 86(4):511-519. doi:10.5558/tfc86511-4.
Couillard P-L, Fregeau l\1, Payette S, Grondin P, Lavoie M, Laflamme J. 2016.
Dynamique et. variabilite naturelle de la pessiere
a
mousses au nord de la region du Lac-Saint-Jean. Quebec.Cyr D, Bergeron Y, Gauthier S, Larouche AC. 2005. Are the old-grm~.rth forests
of the Clay Belt part of a fire-regulated mosaic'? Can J For Res. 35(1):65-73. doi:10.l 139/x04-204.
De'at.h G. 2002. lVIult.ivariate Regression Trees: A New Technique for IVlodeling
Species-Environment Relationships. Ecology. 83(4):1105-1117.
Drapeau P, Nappi A, Im beau L, Saint-Germain :.V1. 2009a. Standing deadwood for keystone bird species in the eastern borcal forest: T\danaging for snag
dynamics. The For. Chron. 85: 227-234.
Drapeau P, Leduc A, Bergeron Y. 2009b. Bridging ecosystem and multiple species approaches for setting conservation targets in managed boreal landscapes.
Chapter 7 In rvI-A Villard and 13-G Jonsson (editors). Setting conservation targets in managed forest landscapes, pp. 129-160. Cambridge Cniversity Press,
Cambridge.
Drapeau P, Villard :tvI-A, Leduc A, Hannon SJ. 2016. Natural disturbance regimes
as templates for the response of bird species assemblages to contemporary forest
management. Divers Distrib. 22: 385-399.
Fenton :'-JJ, Lecomte N, L{)gar{) S, Bergeron Y. 2005. Paludificat.ion in black spruce (I'icca marfana) forests of eastern Canada: Potential factors and
management. implications. For Ecol :.VIanage. 213(1 3):151 159.
doi:10.1016/j.foreco.2005.03.017.