HAL Id: hal-02008379
https://hal.sorbonne-universite.fr/hal-02008379
Submitted on 5 Feb 2019
HAL is a multi-disciplinary open access
archive for the deposit and dissemination of
sci-entific research documents, whether they are
pub-lished or not. The documents may come from
teaching and research institutions in France or
abroad, or from public or private research centers.
L’archive ouverte pluridisciplinaire HAL, est
destinée au dépôt et à la diffusion de documents
scientifiques de niveau recherche, publiés ou non,
émanant des établissements d’enseignement et de
recherche français ou étrangers, des laboratoires
publics ou privés.
PRC1-mediated H2A ubiquitylation
Antoine Campagne, Ming-Kang Lee, Dina Zielinski, Audrey Michaud,
Stéphanie Le Corre, Florent Dingli, Hong Chen, Lara Shahidian, Ivaylo
Vassilev, Nicolas Servant, et al.
To cite this version:
Antoine Campagne, Ming-Kang Lee, Dina Zielinski, Audrey Michaud, Stéphanie Le Corre, et al..
BAP1 complex promotes transcription by opposing PRC1-mediated H2A ubiquitylation. Nature
Communications, Nature Publishing Group, 2019, 10, pp.348. �10.1038/s41467-018-08255-x�.
�hal-02008379�
BAP1 complex promotes transcription by opposing
PRC1-mediated H2A ubiquitylation
Antoine Campagne
1,2
, Ming-Kang Lee
1,2
, Dina Zielinski
1,2,3
, Audrey Michaud
1,2
, Stéphanie Le Corre
1,2
,
Florent Dingli
1
, Hong Chen
1,2
, Lara Z. Shahidian
4
, Ivaylo Vassilev
1,2,3
, Nicolas Servant
1,3
, Damarys Loew
1
,
Eric Pasmant
5
, Sophie Postel-Vinay
6
, Michel Wassef
1,2
& Raphaël Margueron
1,2
In Drosophila, a complex consisting of Calypso and ASX catalyzes H2A deubiquitination
and has been reported to act as part of the Polycomb machinery in transcriptional silencing.
The mammalian homologs of these proteins (BAP1 and ASXL1/2/3, respectively), are
fre-quently mutated in various cancer types, yet their precise functions remain unclear. Using an
integrative approach based on isogenic cell lines generated with CRISPR/Cas9, we uncover
an unanticipated role for BAP1 in gene activation. This function requires the assembly of
an enzymatically active BAP1-associated core complex (BAP1.com) containing one of the
redundant ASXL proteins. We investigate the mechanism underlying BAP1.com-mediated
transcriptional regulation and show that it does not participate in Polycomb-mediated
silencing. Instead, our results establish that the function of BAP1.com is to safeguard
tran-scriptionally active genes against silencing by the Polycomb Repressive Complex 1.
https://doi.org/10.1038/s41467-018-08255-x
OPEN
1Institut Curie, Paris Sciences et Lettres Research University, Sorbonne University, 75005 Paris, France.2INSERM U934/CNRS UMR3215, 75005 Paris, France.3INSERM U900, Mines ParisTech, 75005 Paris, France.4Institute of Functional Epigenetics, Helmholtz Zentrum München, Neuherberg 85764, Germany.5Department of Molecular Genetics Pathology, Cochin Hospital, HUPC AP-HP, EA7331, Faculty of Pharmacy, University of Paris Descartes, Paris 75014, France.6Département d’Innovation Thérapeutique et Essais Précoces, INSERM U981, Gustave Roussy, Université Paris-Saclay, Villejuif F-94805, France. These authors contributed equally: Antoine Campagne, Ming-Kang Lee, Dina Zielinski. Correspondence and requests for materials should be addressed to M.W. (email:[email protected]) or to R.M. (email:[email protected])
123456789
B
RCA1-associated protein 1 (BAP1) was initially
character-ized as a nuclear deubiquitinase regulating the function of
BRCA1
1. Subsequent work suggested that BAP1 does in
fact interact with BRCA1-associated RING domain 1 (BARD1)
and regulates its ubiquitination
2. A variety of proteins have since
been reported to interact with BAP1, including transcription
factors (YY1, FOXK1/2), chromatin binders and modifiers
(ASXL1/2/3, KDM1B, OGT1), the cell cycle regulator HCFC1
and DNA repair proteins (MBD5/6)
3–9. BAP1 enzymatic activity
has been shown to regulate the ubiquitination of various proteins
including gamma-tubulin
10, INO80
11, and BRCA1
1. Accordingly,
BAP1 participates in diverse cellular processes, such as
tran-scriptional regulation and the DNA damage response. However,
the precise function of BAP1 in transcriptional regulation
remains elusive. Some studies have reported that BAP1 acts as a
transcriptional activator while others have suggested that it is
required for gene silencing
3,4,12.
In parallel to its characterization in mammals, studies in
Drosophila identified the BAP1 ortholog Calypso as a novel
Polycomb protein
13,14. The Polycomb Group (PcG) of proteins is
essential for the maintenance of gene repression, most
promi-nently at developmentally regulated genes. Consequently, altering
PcG function affects key cellular processes such as cell fate
determination, cell proliferation, and genomic imprinting
15. Two
Polycomb complexes have been well characterized thus far:
Polycomb Repressive Complex 1 (PRC1) and PRC2. PRC2
cat-alyzes di- and trimethylation of histone H3 on lysine 27
(H3K27me2/3), whereas PRC1 acts through chromatin
compac-tion and monoubiquitinacompac-tion of histone H2A on lysine 119
(H2AK119ub1)
16,17. Conserved from Drosophila to mammals,
the activity of these complexes is necessary for maintaining
transcriptional silencing of their target genes. The importance of
H2AK119ub1 in Polycomb silencing has recently been called into
question in Drosophila
18, as well as in mouse models
19.
None-theless, recent studies suggest that this mark participates in
sta-bilizing PRC2 binding to chromatin
20,21.
Drosophila Calypso was found to partner with the Polycomb
protein Additional Sex Combs (ASX) into a novel Polycomb
complex termed Polycomb Repressive DeUBiquitinase (PR-DUB)
complex. PR-DUB has been shown to catalyze deubiquitination
of H2AK119ub1, opposite to the activity of PRC1
22. The
inter-action between BAP1 and homologs of ASX (ASXL1/2/3
pro-teins) is conserved in mammals, as well as the H2AK119 DUB
activity of BAP1
13,23. How the antagonistic activities of Calypso/
BAP1 and PRC1 converge to maintain transcriptional silencing
remains enigmatic. Further, the link between PR-DUB and the
Polycomb machinery is still controversial. Some studies have
reported that ASXL1 interacts with PRC2 and is required for its
recruitment
24–28while others have suggested an antagonism
between BAP1 and PRC2
29–31. A clear picture of the function of
BAP1 and ASXL proteins is still lacking. Understanding the
function of PR-DUB is all the more important in view of the
tumor-suppressive functions of BAP1 in several cancer types
including uveal melanoma, mesothelioma, and clear-cell renal cell
carcinoma and of ASXL proteins in hematologic malignancies
2,32.
In this study, we use biochemical, genome editing, and
genome-wide methods to address the function of BAP1 in
tran-scriptional regulation and its relationship to the Polycomb
machinery. We show that the ASXLs are mandatory partners of
BAP1 and are required for its stability and enzymatic activity. At
the functional level, the complex formed with BAP1 (BAP1.com)
is required for efficient transcription of many developmental
genes. Accordingly, BAP1 appears to be largely dispensable for
maintaining silencing of Polycomb target genes and in fact
opposes PRC2-mediated silencing at a number of genes. The
majority of BAP1-regulated genes, however, are not under
regulation by PRC2, suggesting that the function of BAP1 in
promoting transcription does not reflect an obligate antagonism
with PRC2. We show that BAP1 is required upon transcriptional
stimulation, as observed after retinoic acid (RA) treatment, a
function that is shared with the CREBBP and SMARCB1
tran-scriptional co-activators. A general role in regulating gene
expression is supported by the conspicuous colocalization
between BAP1.com and RNA polymerase 2. Mechanistically, we
show that BAP1’s function depends on its deubiquitinase (DUB)
activity and that BAP1 is functionally inert in the absence of
H2AK119ub1. Our integrative analysis uncovers an essential
function for BAP1.com as a transcriptional co-activator, acting by
locally antagonizing PRC1 activity.
Results
Loss of BAP1 alters the expression of developmental genes. In
order to comprehend the role of BAP1 in transcriptional
reg-ulation, we generated knockouts (KOs) for BAP1, ASXL1, ASXL2,
and EZH2, the main catalytic subunit of PRC2, in human
HAP1 cells, a model cell line that is nearly haploid and thus
particularly amenable to genome editing
33. KOs result from the
insertion of a STOP cassette that interrupts transcription and
translation of the target gene
34and were validated by reverse
transcription-quantitative polymerase chain reaction (RT-qPCR,
Fig.
1
a). In contrast to many cell lines where the knockdown of
BAP1
severely
compromises
proliferation
(Supplementary
Fig. 1a), we found that BAP1 is dispensable for proliferation in
HAP1 cells, thus providing a suitable system for studying its
mechanism of action (Fig.
1
b). Cellular fractionation confirmed
the tight association of BAP1 with chromatin, as shown by its
enrichment both in the soluble and insoluble fractions
(Supple-mentary Fig. 1b), which prompted us to further investigate its
chromatin-modifying activity. Western blot analysis of various
histone marks showed that BAP1 loss is associated with an
approximate twofold increase in total H2A ubiquitination levels,
as well as a parallel increase in H2A.Z ubiquitination, with no
effect on H2B ubiquitination (Fig.
1
c, top panel). ASXL1 and
ASXL2 KO led to a modest increase in H2A/H2A.Z
ubiquitina-tion. We did not observe any global effect upon KO of BAP1,
ASXL1, or ASXL2 on other histone marks such as H3K4me2 and
H3K27me3 or on DNA modifications (Fig.
1
c, bottom panel).
We then performed RNA-seq to analyze the transcriptome of
wild-type and KO cell lines. The inactivation of BAP1 resulted in
dramatic changes in gene expression (n
= 1893 differentially
expressed (DE) genes, false discovery rate (FDR) < 0.05 and
absolute log2 fold-change > 1; Fig.
1
d, left panel). Strikingly, the
majority of affected genes were downregulated in BAP1 KO cells
(n
= 1370), suggesting an involvement in gene activation rather
than silencing. Gene ontology (GO) analysis revealed enrichment
for a variety of biological processes ranging from broad terms
such as cell communication, signaling, or regulation of
prolifera-tion to more specific terms such as blood vessel development
(Fig.
1
d, right panel). Several terms related to development were
also enriched, consistent with the reported function of the BAP1
ortholog in Drosophila
13. Inactivation of either ASXL protein also
leads to preferential downregulation of genes (85 downregulated
genes of 112 total DE genes in ASXL1 KO cells and 262
downregulated genes of 406 DE genes in the ASXL2 KO cells;
Fig.
1
e, also see Supplementary Fig. 1c for heatmaps of the top
100 DE genes in each KO condition) but has a much milder effect
on gene expression than observed for the BAP1 KO. Further, loss
of ASXL1 or ASXL2 does not affect the chromatin localization of
BAP1 (Supplementary Fig. 1b). This result suggests either that
BAP1 can function independently of its interaction with ASXL
proteins or that the ASXLs are largely redundant.
The ASXL/BAP1 core complex is conserved in mammals. To
better understand the function of BAP1, we sought to determine
whether it is part of a stable complex and, if so, with which
partners. Purification of Calypso from Drosophila embryos
revealed that it forms a heterodimeric complex with ASX
13.
Although the interaction between BAP1 and ASXL proteins is
conserved
13,23,35, additional partners were reported in the
mammalian complex
3,4,9. We overexpressed FLAG-tagged
ver-sions of BAP1, ASXL1, or ASXL2 in HeLa cells (Supplementary
Fig. 2a), followed by immunoprecipitation and mass
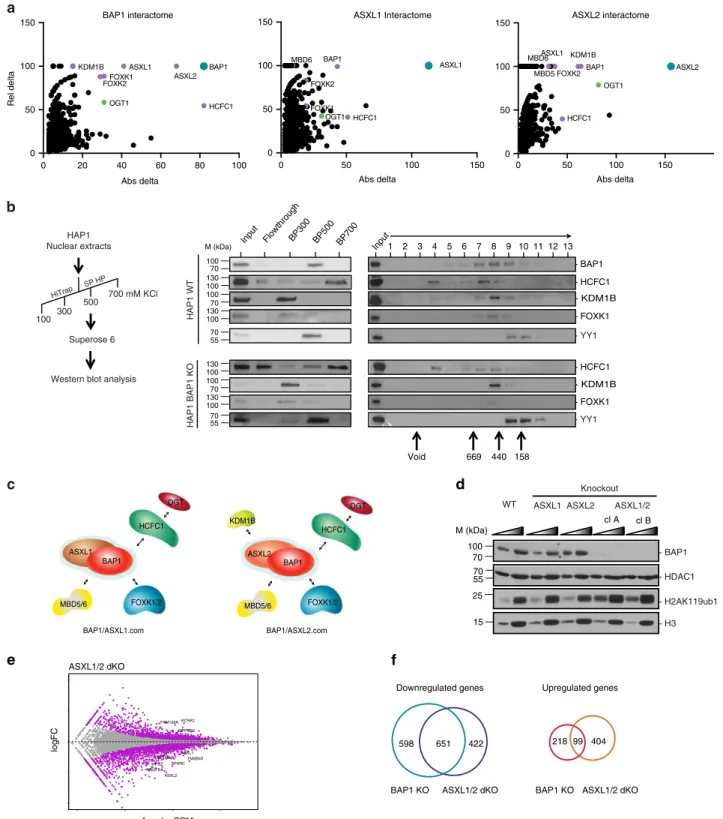
spectro-metry. The results confirmed previous reports, notably the
identification of ASXL1/2, FOXK1/2, HCFC1, and KDM1B as
partners of BAP1 (Fig.
2
a). The ASXL1 and ASXL2 interactomes
were similar with the exception of KDM1B, which is specifically
pulled down by ASXL2. Of note, similar results were obtained for
the BAP1 interactome in Uveal Melanoma MP41 cells
(Supple-mentary Fig. 2b), suggesting that BAP1.com composition is not
cell-type dependent.
We then sought to determine whether BAP1 partners are all
present in a single complex or if BAP1 is engaged in distinct
protein complexes. To this end, we analyzed the elution pattern of
BAP1 partners by ion exchange chromatography followed by
size-exclusion chromatography (SEC) (Fig.
2
b). The
first
purification step (ion exchange) revealed that the HCFC1,
FOXK1, and KDM1B generally elute independently of BAP1,
which is almost exclusively found in the 500 mM salt fraction,
suggesting that only a portion of each of these proteins is engaged
in a complex with BAP1. In the second purification step (SEC),
we observed that BAP1 elutes with a molecular weight of
approximately 500 kDa, along with with HCFC1, FOXK1, and
KDM1B. In contrast, YY1 elutes later and only partially overlaps
with BAP1. To know whether the co-elution between BAP1 and
its cofactors reflects the assembly of these proteins into a
complex, we repeated the experiment with nuclear extract from
BAP1 KO cells. The elution pattern from cation exchange did not
reveal any major changes; we therefore continued with SEC. The
elution patterns of HCFC1, KDM1B, and FOXK1 remain
unchanged, indicating that the co-elutions observed with BAP1
in the wild-type extract do not reflect the formation of a stable
complex (Fig.
2
b). Considering the previously established tight
0.00 0.02 0.04 0.06 0.08 0.10 9 10 11 12 13 C hydroxymethylated (%) C methylated (%) 0 WT BAP1 ASXL1 ASXL2 EZH2GO of deregulated genes in BAP1 KO cells
Cell communication Movement of cell or subcellular component Regulation of multicellular organismal process Single-multicellular organism process Regulation of cell proliferation
Single organism signaling Negative regulation of signal
transduction
Circulatory system development
Response to external
stimulus Positive regulation of multicellular organismal process Blood vessel development
Animal organ morphogenesis
Positive regulation of cell differentiation
Localization of cell
Regulation of developmental process Regulation of cell motility
Locomotion ASXL2 GABRA5 ATP8A2 ALX4 NUP93 PMP22PDPR CNOT1 LIN28A HSPG2 ASXL2 KO ASXL1 FCGRT CCDC3 BMP7 GABRA5 NCOA6 SYT11 GPR176 TRABD2A DNAJC15 ASXL1 KO KLF4 PPFIA2 PDGFC COL4A6 ATP9A HMGN4 GPM6A GABRB3 CXorf57 WWTR1 Avg. logCPM
Avg. logCPM Avg. logCPM
logFC
logFC logFC
BAP1 KO
d
c
WT BAP1 ASXL1 ASXL2 EZH2
- H2AK119ub1 - H2BK120ub1 - H3K27me3 - H3K4me2 - H2B - H3 Z. A 2 H Ub un. KO conditions
e
b
0 24 h 48 h 72 h 96 h 0.0 2.5 × 10⁵ 5.0 × 10⁵ 7.5 × 10⁵ 1.0 × 10⁶ Time Cell number HAP1 WT BAP1 KO EZH2 KOBAP1 ASXL1 ASXL2 EZH2
0.0 0.5 1.0 1.5 2.0 Expression relative to TBP normalized to WT
a
_
25 M (kDa)_
15_
15_
25_
15_
25_
15_
15 WT BAP1 KO ASXL1 KO ASXL2 KO EZH2 KOFig. 1 Functional consequences of loss of BAP1, ASXL1, or ASXL2 on chromatin and gene expression. a RT-qPCR analysis of BAP1, ASXL1, ASXL2, and EZH2 expression in the different KO conditions indicated on top. n = 2. b Proliferation curve of wild-type, EZH2 KO and BAP1 KO HAP1 cells. n = 3. c Top, western blot analysis of acid extracted histones with antibodies directed against various histone modifications (as indicated on the right) in the different cell lines indicated on top, M molecular weight. A two-point titration (1:2.5 ratio) is shown for each condition, ub ubiquitinated, un unmodified. Bottom, analysis of cytosine methylation (blue triangles) or hydroxymethylation (red triangles) in the KO conditions indicated at the bottom. Horizontal bars indicate the mean. n = 3. d Left panel: scatterplot showing log2 fold-change (logFC) expression between wild-type and BAP1 KO cells versus average log2 counts per million (logCPM). Differentially expressed genes (DEGs) in BAP1 KO cells are highlighted in purple. Right panel: representation of the non-redundant most enriched GO terms within the DEGs in BAP1 KO cells. e Scatterplots as in d, showing gene expression changes in ASXL1 and ASXL2 KO cells
HAP1 Nuclear extracts 100 300 500 700 mM KCl Superose 6 HiTrap SP HP
Western blot analysis
HAP1 WT HAP1 BAP1 KO 0 50 100 150 0 50 100 150 ASXL1 Interactome Abs delta ASXL1 HCFC1 BAP1 OGT1 FOXK1 FOXK2 MBD6 0 20 40 60 80 100 0 50 100 150 BAP1 interactome Abs delta R e l delta BAP1 HCFC1 ASXL2 ASXL1 FOXK1 OGT1 FOXK2 KDM1B 0 50 100 150 0 50 100 150 ASXL2 interactome Abs delta ASXL2 OGT1 BAP1 KDM1B HCFC1 FOXK2 ASXL1 MBD5 MBD6
a
b
BAP1/ASXL2.com BAP1/ASXL1.com MBD5/6 MBD5/6 KDM1B OGT HCFC1 FOXK1/2 ASXL2 BAP1 ASXL1 BAP1 OGT FOXK1/2 HCFC1c
Input FlowthroughBP300 BP500 BP700 Input Void 669 440 158 - BAP1 - KDM1B - HCFC1 - FOXK1 - KDM1B - HCFC1 - FOXK1 - YY1 - YY1 1 2 3 4 5 6 7 8 9 10 11 12 13 TMSB4X ASXL2 SPARC KCNK2 PDGFRA MPDZ MPPED2 ASXL1 SLITRK2 FAM129A Avg. logCPM logFC ASXL1/2 dKO Downregulated genesd
e
WT ASXL1 ASXL2 - H2AK119ub1 - H3 ASXL1/2 cl A cl B - HDAC1 - BAP1 Knockoutf
Upregulated genesBAP1 KO ASXL1/2 dKO BAP1 KO ASXL1/2 dKO
598 651 422 218 99 404 M (kDa) M (kDa) 100 70 100 70 70 55 25 15 130 100 100 70 130 100 70 55 130 100 100 70 130 100 70 55
Fig. 2 BAP1.com core complex and associated factors. a Mass spectrometry analysis of HeLa cells overexpressing Flag-tagged versions of BAP1, ASXL1, and ASXL2. Graphs represent proteins relative to their absolute (Abs) and relative (Rel) delta compared with mass spectrometry analysis of empty vector expressing cells. Absolute delta is the absolute difference between distinct peptides identified in sample and control; relative delta is the ratio of absolute delta versus the sum of distinct peptides identified in sample and control. b Elution patterns of HAP1 WT and HAP1 BAP1-KO nuclear extracts following the purification scheme indicated in the left panel and monitored by western blot with the indicated antibodies. Middle pattern is a representative elution pattern (step elution with increased salt concentration) on a cation exchange column (SP-HP, GE). Right panel is a representative elution pattern on a size-exclusion column (Superose 6, PC3.2/30, GE). Underneath is the correspondent. c Schematic of BAP1.com core complex and associated factors depending on the ASXL paralog present.d Western blot analysis of BAP1 and H2AK119ub1 in the different KO conditions indicated above. Two independent clones of ASXL1/2 dKO cells are shown. HDAC1 and H3 serve as nuclear and histone protein loading control respectively. A two-point titration (1:2.5 ratio) is shown for each condition.e Scatterplot showing log2 fold-change (logFC) expression between wild-type and ASXL1/2 dKO cells as a function of average log2 counts per million (logCPM). Differentially expressed genes in ASXL1/2 dKO cells are highlighted in purple. f Venn diagram showing the overlap between genes downregulated60or upregulated (right) in BAP1 KO and ASXL1/2 dKO cells
interaction between BAP1 and the ASXLs
13,23,35, our results
suggest that BAP1 and ASXL proteins form a core complex
(BAP1.com), which engages in transient interactions with
additional partners such as FOXK1/2, HCFC1, or KDM1B
(Fig.
2
c). This model predicts that immunoprecipitation of any
one of these transient partners would consistently retrieve the
core complex but not necessarily other transient partners. Indeed,
KDM1B immunoprecipitation from HeLa cells pulls down
ASXL2 and BAP1 (as well as NSD3, which is part of a distinct
complex with KDM1B) but none of the other transient partners
(Supplementary Fig. 2c).
Given the role of ASXL1 and ASXL2 in driving
BAP1-associated complex composition but the modest effect of their
individual deletion on transcription, we sought to investigate their
potential redundancy in BAP1-mediated H2A deubiquitination
and transcriptional regulation. To address this question, we
generated a double ASXL1/ASXL2 KO. Of note, ASXL3 is not
expressed in wild-type HAP1 cells nor in ASXL1/2 double KO
cells (Supplementary Fig. 2d). We
first evaluated the effect of this
double KO on chromatin regulation and observed a robust
increase in H2A ubiquitination levels similar to those observed in
the BAP1 KO (Fig.
2
d). This result is consistent with the fact that
interaction with the ASXLs is required for BAP1 enzymatic
activity (Supplementary Fig. 2e). Notably, loss of ASXL1 and
ASXL2 also led to a dramatic reduction in BAP1 protein levels
(Fig.
2
d), whereas BAP1 transcript levels were unaffected
(Supplementary Fig. 2d). Thus, ASXLs are not only necessary
for the enzymatic activity of BAP1 but also for protein stability
in vivo. Consistent with this effect on BAP1 protein
accumula-tion, transcriptome analysis of ASXL1/2 dKO cells revealed a
major impact on gene expression (Fig.
2
e). Most DE genes were
downregulated (70%, 1073 downregulated genes out of 1576 total
DE genes, also see Supplementary Fig. 2f for heatmaps of the top
100 DE genes) and there was a large overlap between genes
downregulated in BAP1 KO and ASXL1/2 dKO cells (Fig.
2
f, left).
In comparison, the overlap between upregulated genes was much
less pronounced (Fig.
2
f, right), supporting the idea that the main
role of BAP1.com is to promote transcription. Altogether, these
results show that ASXL proteins are mandatory and redundant
partners of BAP1.
BAP1 does not participate in Polycomb-mediated silencing.
The data presented above suggest that the main role of BAP1 is to
positively regulate transcription. While in agreement with several
previously published studies, our
findings contrast with a number
of reports suggesting that BAP1 and ASXL proteins participate in
Polycomb-mediated silencing
24–28. To formally investigate the
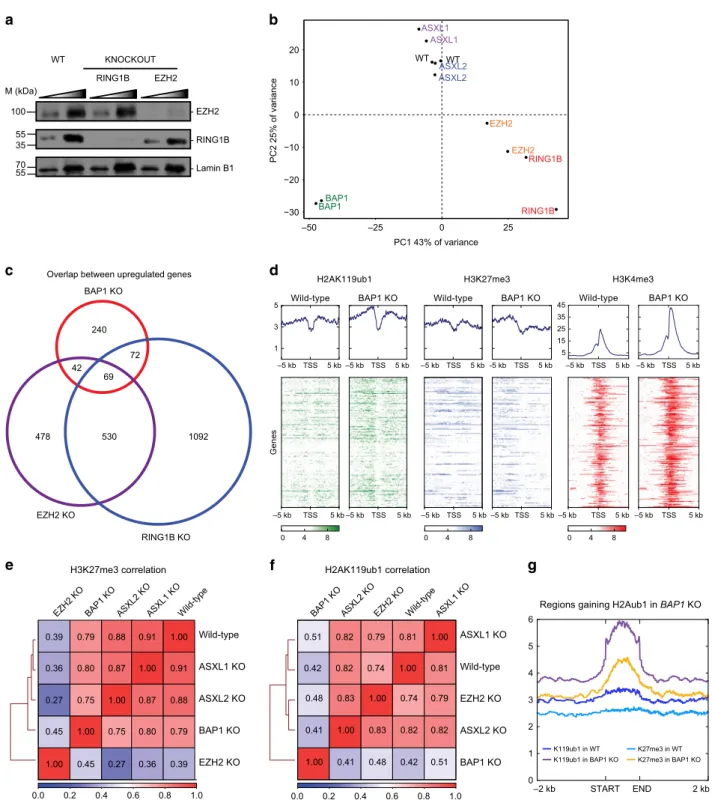
interplay between BAP1 and Polycomb proteins, we analyzed the
consequences of BAP1 loss in conjunction with loss of RING1B
and EZH2, key members of PRC1 and PRC2, respectively
(Fig.
3
a).
As expected, the main impact of inactivating either RING1B or
EZH2 is the transcriptional upregulation of a large set of genes
(Supplementary Fig. 3a, b). The GO terms for the DE genes
(either up or down regulated) in EZH2 KO cells partially overlap
the categories observed upon BAP1 KO, including those related
to signaling or development (Supplementary Fig. 3c and Fig.
1
d,
right panel). The terms associated with genes DE in the absence
of RING1B are broader, which might reflect a less developmental
specific function of PRC1 (Supplementary Fig. 3d). To further
compare transcriptional changes between all KO conditions, we
performed principal component analysis (PCA, Fig.
3
b). Along
PC1, most of the variance is driven by differences in BAP1 and
polycomb machinery, again suggestive of distinct gene regulatory
functions. As the Polycomb machinery is involved in gene
silencing, we investigated the overlap between genes upregulated
upon KO of EZH2 or RING1B and KO of BAP1. As shown in
Fig.
3
c, only a minority of the genes regulated by PRC1 and/or
PRC2 becomes upregulated upon loss of BAP1. To determine
whether this limited overlap reflects a synergistic action of BAP1
with the Polycomb machinery, we investigated chromatin
changes occurring at genes upregulated in BAP1 KO. If BAP1
functions together with the Polycomb machinery to maintain
transcriptional silencing at a subset of Polycomb target genes, loss
of BAP1 is expected to result in a decrease in the
Polycomb-mediated chromatin signature. However, chromatin
immunopre-cipitation (ChIP) followed by deep sequencing (ChIP-seq) did not
reveal a decrease in Polycomb histone marks H2AK119ub1 or
H3K27me3 at these genes in BAP1 KO cells (Fig.
3
d). In fact,
H2AK119ub1 increased, possibly reflecting the more global
increase of the mark caused by loss of BAP1 (see further below).
As expected, transcriptional upregulation corresponded with
marked increase in H3K4me3, a histone mark deposited
preferentially near the 5ʹ ends of transcriptionally active genes.
These results suggest that transcriptional upregulation occurring
upon BAP1 loss is not caused by impaired Polycomb-mediated
silencing. Instead, these gene expression changes may be
secondary effects of widespread transcriptional downregulation.
We then analyzed the genome-wide distribution of the
Polycomb-specific histone marks H3K27me3 and H2AK119ub1.
Previous studies have reported a crucial role for the ASXLs in
H3K27me3 deposition
24–28, but analysis of H3K27me3 revealed a
high correlation in the genome-wide localization of the mark
between wild-type, BAP1, ASXL1, and ASXL2 KO cells,
suggest-ing that loss of the ASXL proteins does not globally affect
H3K27me3 distribution (Fig.
3
e see also Supplementary Fig. 3e).
This analysis, together with the lack of global change in
H3K27me3 abundance in BAP1, ASXL1, or ASXL2 KO cells as
gauged by western blot (Fig.
1
c), rules out an essential role for
BAP1 and ASXL proteins in PRC2 function. In contrast, the
distribution of H2AK119ub1 was significantly altered in BAP1
KO cells (Fig.
3
f). Differential analysis of H2AK119ub1 signal
between BAP1 KO and wild-type cells revealed widespread gains
upon loss of BAP1 (12,388 regions) and much less depleted
regions (3456), in keeping with the global increase of the mark
seen by western blot analysis (Fig.
1
c). H2AK119ub1 gains
localized throughout the genome with an approximate twofold
enrichment at putative promoter and enhancer regions over
random peaks (Supplementary Fig. 3f). Interestingly, consistent
with the known interplay between PRC1 and PRC2, gains of
H2AK119ub1 were accompanied by an increase of H3K27me3
(Fig.
3
g). Altogether, these data establish that BAP1.com does not
act in synergy with the Polycomb machinery to maintain gene
silencing but, instead, that its activity might restrain Polycomb
enzymatic activity.
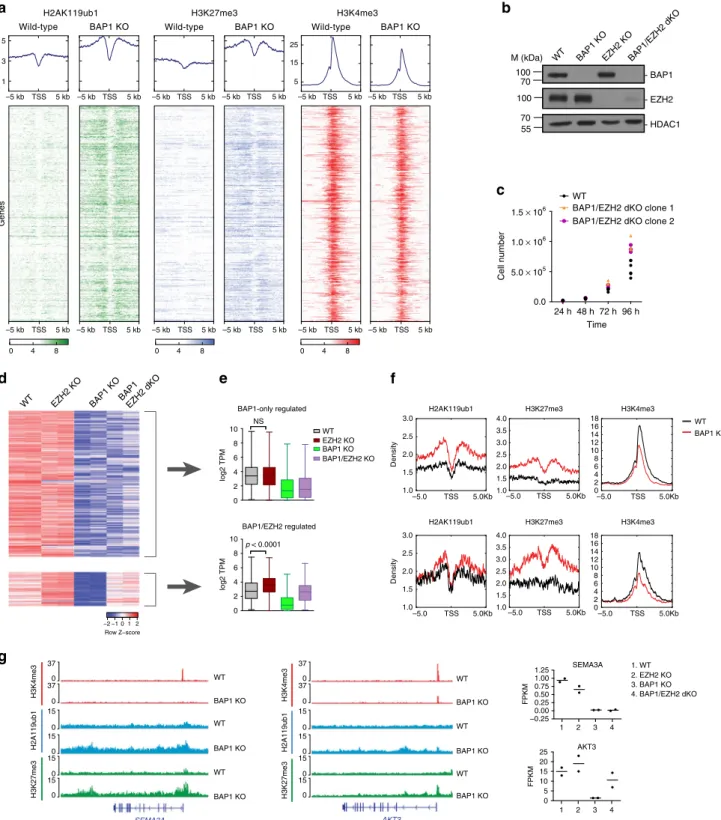
PRC2-antagonistic and -independent role of BAP1. As shown
above, the major impact of loss of BAP1 is the downregulation
of gene expression accompanied by widespread gains of
H2AK119ub1 and H3K27me3. To investigate whether gains of
Polycomb marks and transcriptional changes following BAP1 loss
are linked, we
first analyzed changes in chromatin composition at
genes that are downregulated in the absence of BAP1 (Fig.
4
a). As
expected, transcription-associated H3K4me3 decreased
con-comitantly with transcriptional downregulation. In principle,
increased levels of the H2AK119ub1 and H3K27me3 repressive
marks could be a direct consequence of loss of BAP1
deubiqui-tinase activity or could be a secondary event caused by
tran-scriptional downregulation
36. To discern between these two
(Fig.
4
b) and assessed whether EZH2 deletion can restore
expression of BAP1-regulated genes. Of note, EZH2 deletion in
cells already KO for BAP1 did not impair proliferation (Fig.
4
c),
consistent with recent evidence challenging the reported synthetic
lethal
relationship
between
EZH2
inhibition
and
BAP1
inactivation
29,37. Of the 913 genes downregulated upon BAP1
KO, a large majority (741 genes) remain silent in the BAP1/EZH2
double KO (Fig.
4
d, top heatmap), whereas the expression of a
minority (172 genes) is increased in the double KO compared
with BAP1 single KO cells (Fig.
4
d, bottom heatmap). This set of
genes is also upregulated upon deletion of EZH2 in a BAP1
wild-type context, indicative of a balanced antagonistic regulation
d
b
e
- EZH2 - RING1B - Lamin B1 WT EZH2 RING1B KNOCKOUTa
WT EZH2 RING1B RING1B WT BAP1 BAP1 ASXL1 ASXL1 ASXL2 ASXL2 EZH2 −30 −20 −10 0 10 20 –50 –25 0 25 PC1 43% of variance PC2 25% of variancec
Overlap between upregulated genesEZH2 KO BAP1 KO ASXL2 KO
EZH2 KO BAP1 KO ASXL2 KO 1.00 0.45 0.27 0.45 1.00 0.75 0.27 0.75 1.00 Wild-type 0.39 0.79 0.88 0.0 0.2 0.4 0.6 0.8 1.0 ASXL1 KO 0.36 0.80 0.87 Wild-type 0.39 0.79 0.88 1.00 0.91 ASXL1 KO 0.36 0.80 0.87 0.91 1.00 240 478 1092 42 72 530 69 BAP1 KO EZH2 KO RING1B KO Gene s 1 3 5 0 4 8 0 4 8 –5 kb TSS 5 kb –5 kb TSS 5 kb –5 kb TSS 5 kb –5 kb TSS 5 kb –5 kb TSS 5 kb –5 kb TSS 5 kb –5 kb TSS 5 kb –5 kb TSS 5 kb –5 kb TSS 5 kb -5 kb TSS 5 kb –5 kb TSS 5 kb –5 kb TSS 5 kb
Wild-type BAP1 KO Wild-type BAP1 KO
5 15 25 35 45 Wild-type BAP1 KO 0 4 8
H2AK119ub1 H3K27me3 H3K4me3
H3K27me3 correlation
f
–2 kb START END 2 kb 0 1 2 3 4 5 6Regions gaining H2Aub1 in BAP1 KO
K27me3 in WT K119ub1 in WT K27me3 in BAP1 KO K119ub1 in BAP1 KO 1.00 0.41 0.48 0.42 0.51 0.41 1.00 0.83 0.82 0.82 0.48 0.83 1.00 0.74 0.79 0.42 0.82 0.74 1.00 0.81 0.51 0.82 0.79 0.81 1.00 0.0 0.2 0.4 0.6 0.8 1.0 EZH2 KO
BAP1 KO ASXL2 KO Wild-type ASXL1 KO
EZH2 KO BAP1 KO ASXL2 KO Wild-type ASXL1 KO H2AK119ub1 correlation
g
_
_
35 55 M (kDa)_
100_
_
55 70Fig. 3 BAP1.com is dispensable for Polycomb-mediated silencing. a Western blot analysis of EZH2 and RING1B in wild-type (WT), RING1B KO, and EZH2 KO cells. Lamin B1 is used as a loading control. A two-point titration (1:2 ratio) is shown for each condition.b PCA analysis of WT, RING1B, EZH2, ASXL1, ASXL2, and BAP1 KO transcriptome. c Venn diagram showing the overlap between genes upregulated in BAP1, EZH2, or RING1B KO cells. d Heatmaps showing H2AK119ub1, H3K27me3, and H3K4me3 distribution in a−5/ + 5 kb window around the transcription start site (TSS) of genes upregulated in BAP1 KO cells in wild-type and BAP1 KO cells. Corresponding average profiles are plotted on top of each heatmap. e, f Correlation heatmap of H3K27me3 (e) and H2AK119ub1 (f) distribution between wild-type cells and the different KO conditions indicated. g Plots showing average enrichment of H2AK119ub1 and H3K27me3 in wild-type and BAP1 KO cells at regions that gain H2AK119ub1 upon BAP1 loss
24 h 48 h 72 h 96 h 0.0 5.0 × 10⁵ 1.0 × 10⁶ 1.5 × 10⁶ Time Cell number –5.0 TSS 5.0Kb 0 2 4 6 8 10 12 14 16 18 –5.0 TSS 5.0Kb 1.0 1.5 2.0 2.5 3.0 3.5 4.0 –5.0 TSS 5.0Kb 0 2 4 6 8 10 12 14 16 18 –5.0 TSS 5.0Kb 1.0 1.5 2.0 2.5 3.0 3.5 4.0 –5.0 TSS 5.0Kb 1.0 1.5 2.0 2.5 3.0 D e nsity BAP1 KO WT –5.0 TSS 5.0Kb 1.0 1.5 2.0 2.5 3.0 −2 −1 0 1 2 Row Z−score - BAP1 - EZH2 - HDAC1 WT
b
c
BAP1 KOEZH2 KOBAP1/EZH2 dKO
WT
BAP1/EZH2 dKO clone 1 BAP1/EZH2 dKO clone 2
a
WT EZH2 KO BAP1 KO B AP1 EZH2 dKOd
H2AK119ub1f
H3K4me3 H2A119ub1 H3K27me3g
WT WT WT BAP1 KO BAP1 KO BAP1 KO H3K4me3 H2A119ub1 H3K27me3 BAP1/EZH2 regulatedBAP1-only regulated H3K27me3 H3K4me3
H2AK119ub1 H3K27me3 H3K4me3
Den s it y 0 4 8 0 4 8 0 4 8 Gene s 1 3 5 –5 kb TSS 5 kb –5 kb TSS 5 kb –5 kb TSS 5 kb –5 kb TSS 5 kb –5 kb TSS 5 kb –5 kb TSS 5 kb –5 kb TSS 5 kb Wild-type –5 kb TSS 5 kb Wild-type –5 kb TSS 5 kb –5 kb TSS 5 kb –5 kb TSS 5 kb BAP1 KO –5 kb TSS 5 kb BAP1 KO Wild-type 5 15 25 BAP1 KO
H2AK119ub1 H3K27me3 H3K4me3
0 2 4 6 8 10 log2 TPM WT EZH2 KO BAP1 KO BAP1/EZH2 KO NS 0 2 4 6 8 10 log2 TPM p < 0.0001 100 70 M (kDa) 70 55 100 AKT3
e
WT WT WT BAP1 KO BAP1 KO BAP1 KO SEMA3A 1. WT 2. EZH2 KO 3. BAP1 KO 4. BAP1/EZH2 dKO 0 15 0 15 0 370 37 0 150 15 1 2 3 4 –0.25 0.00 0.25 0.50 0.75 1.00 1.25 FPKM SEMA3A 1 2 3 4 0 5 10 15 20 25 FPKM AKT3 0 15 0 15 0 370 37 0 150 15Fig. 4 BAP1.com promotes transcription independently of an antagonism with the PRC2 complex. a Heatmaps showing H2AK119ub1, H3K27me3, and H3K4me3 distribution in a−5/ + 5 kb window around the transcription start site (TSS) of genes downregulated in BAP1 KO cells in wild-type and BAP1 KO cells. Corresponding average profiles are plotted on top of each heatmap. b Western blot analysis of BAP1 and EZH2 in single and double BAP1/EZH2 KO cells. HDAC1 is used as a loading control.c Dot plot showing proliferation of wild-type cells and two independent clones of BAP1/EZH2 dKO cells. n = 3. d Heatmap of gene expression (Z-scores) in the different genotypes. Top: BAP1-only-regulated genes, and bottom: BAP1- and EZH2-regulated genes, TSS= transcription start site. e Box-plots (median, lower, and upper quartiles, lowest and highest values) of log2 transcript per million (TPM) expression values of BAP1-only-regulated genes (top) and BAP1/EZH2-regulated genes61in the different conditions as indicated. Result of the Mann–Whitney test on the EZH2 KO versus wild-type comparison is indicated. f Plot showing average enrichment of H2AK119ub1, H3K27me3, and H3K4me3 in a −5/ + 5 kb around the TSS for BAP1-only-regulated genes (top) and BAP1/EZH2-regulated genes61.g Example snapshots of H2AK119ub1, H3K27me3, and H3K4me3 enrichment in WT and BAP1 KO cells at a BAP1-only-regulated gene and a BAP1/EZH2-regulated gene (middle). Expression values of the corresponding genes across WT, EZH2, BAP1, and BAP1/EZH2 KO conditions as detected in corresponding RNA-seq data are shown on the right. Horizontal bars indicate the mean expression
between BAP1 and EZH2 (Fig.
4
d, e). Moreover, all genes
downregulated in the absence of BAP1 gain H3K27me3 upon
BAP1 KO (Fig.
4
f, see also Fig.
4
g and Supplementary Fig. 4a, b
for specific examples), suggesting that such a gain is a
con-sequence rather than a cause of transcriptional downregulation.
Thus, although BAP1 and PRC2 act in an opposite fashion at a
number of genes, BAP1 promotes gene expression in a manner
that is largely independent of an antagonism with the PRC2
complex.
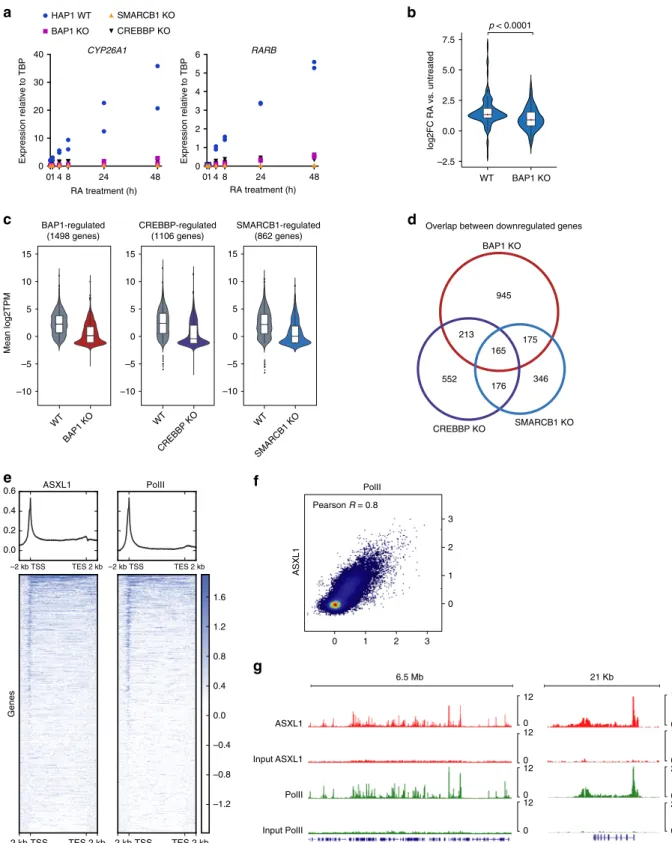
Similarities between BAP1.com and general co-activators.
Having analyzed the impact of loss of BAP1.com on steady-state
gene transcription, we next sought to examine its role in
tran-scriptional activation in response to a trantran-scriptional stimulus.
Considering previous reports suggesting that BAP1 may
mod-ulate nuclear receptor-mediated gene regulation
38,39, we
investi-gated whether deletion of BAP1 would affect response to RA
treatment. We initially performed a time-course analysis of two of
the best-characterized direct RA transcriptional targets: RARβ
and CYP26A1 (Fig.
5
a). In contrast to the above-mentioned
reports that suggest a repressive role for BAP1.com at RA target
genes, we observed that activation of both RARβ and CYP26A1
was severely compromised in BAP1 KO cells. Of note, loss of
BAP1 did not affect the protein levels of RARα, a major
RA-binding nuclear receptor (Supplementary Fig. 5a). To determine
whether these results reflect a general role for BAP1 in the
transcriptional response to RA, we analyzed the transcriptome of
WT and BAP1 KO cells in response to RA treatment (after 24 h).
Nearly twice as many genes were significantly activated upon RA
treatment in WT than in BAP1 KO cells (n
= 88 versus n = 47,
FDR < 0.05 and absolute log2 fold-change > 1, Supplementary
Fig. 5b). Furthermore, analyzing the entire set of genes activated
in either condition, we found that the response to RA is
sig-nificantly attenuated in BAP1 KO cells (Fig.
5
b), demonstrating
that BAP1 is required for optimal RA-mediated transcriptional
activation.
To further investigate the hypothesis that BAP1 functions as a
transcriptional co-activator, we compared transcriptional defects
occurring in BAP1 KO cells and KOs of SMARCB1
(Supplemen-tary Fig. 5c), which encodes an essential member of the BAF
chromatin-remodeling complex, and CREBBP, which encodes a
histone acetyltransferase. Both KO cell lines were viable, although
they appeared less healthy than the wild-type counterpart. As
with loss of BAP1, loss of SMARCB1 and CREBBP severely
impaired RA-mediated transcriptional activation of RARβ and
CYP26A1 (Fig.
5
a). To determine to what extent BAP1, CREBBP,
and SMARCB1 affect transcription, we compared the
transcrip-tome of HAP1 cells mutated for each of these genes (this study
and
40). As shown in Fig.
5
c, each KO leads to the downregulation
of a similar number of genes (BAP1: 1498 genes, CREBBP: 1106
genes and SMARCB1: 862 genes). We next compared the overlap
between genes regulated by the three proteins. Although RNA-seq
for each KO condition was performed in different laboratories,
there was a significant overlap between genes downregulated
upon loss of BAP1, CREBBP, or SMARCB1 (Fig.
5
d, p < 0.0001
for all three comparisons). Nonetheless, the majority of
down-regulated genes remain specific to each respective KO, indicating
that BAP1, CREBBP, and SMARCB1 each regulate a distinct set
of genes.
To determine the level of specificity of gene recruitment, we
compared BAP1.com localization at chromatin to the localization
of transcription machinery. We obtained previously published
ChIP-seq data for ASXL1
9and RNA-PolII (ENCODE) in human
HEK-293 cells, and BAP1
4and RNA-PolII (ENCODE) in mouse
bone marrow-derived macrophages. Analysis of ASXL1/PolII and
BAP1/PolII enrichment revealed a marked correlation between
RNA-PolII and BAP1.com profiles, both in terms of enrichment
intensity and profile along the gene body (Fig.
5
e, f and
Supplementary Fig. 5d, e and ChIP-seq screenshots in Fig.
5
g
and Supplementary Fig. 5f). This result strongly supports a role
for BAP1.com as a general co-activator and suggests that
functional differences between BAP1 and other co-activators
are due to gene-specific requirements for their respective
enzymatic activities during transcriptional activation, rather than
gene-specific targeting. Together, these data provide compelling
evidence that BAP1.com functions as a general transcriptional
co-activator.
PRC1 is epistatic to BAP1. Finally, we sought to understand how
BAP1 exerts its function on transcription. In principle, BAP1
could act through its enzymatic activity to modify proteins
that modulate transcription, and/or by recruiting factors
that participate in promoting transcription. Several reported
BAP1 substrates such as H2AK119ub1, BARD1, HCFC1,
and OGT could potentially mediate its function in gene
activation
4–6,41. HCFC1 is a transcriptional regulator and, in
addition to modulating its ubiquitination, BAP1 has been
sug-gested to contribute to its recruitment and/or regulation of its
stability. More recently, BAP1 was suggested to participate in the
recruitment of the MLL3 histone methyltransferase at enhancers
by direct interaction with MLL3 PHD repeats
31.
To determine which of these functions is critical for BAP1
activity, we
first assessed if BAP1 function requires its DUB
activity. For this purpose, we performed rescue experiments in
BAP1 KO cells, reintroducing either wild-type BAP1 or a
catalytically dead version (BAP1 C91S). Both versions of BAP1
were re-expressed at a similar level, slightly higher than the
original endogenous level (Fig.
6
a, upper panel). Focusing on a
selection of genes whose expression is dramatically reduced in the
absence of BAP1, re-expression of wild-type BAP1 protein
restores up to 75% of the wild-type levels of the transcripts while
the C91S mutant is unable to rescue transcription of the tested
genes (Fig.
6
a, lower panel). Although based on a subset of genes,
this analysis suggests that BAP1 catalytic activity is required for
its function, consistent with previous studies
3,13.
We next sought to determine the relative contribution of
H2AK119ub1 compared with other substrates to BAP1’s
func-tion. H2AK119ub1 is solely deposited by the PRC1 complex
through its two paralogous enzymes RING1A and RING1B. We
thus genetically inactivated both enzymes in HAP1 cells and then
mutated BAP1 in the context of RING1A/B dKO cells. As
expected, H2AK119ub1 was completely absent from both
RING1A/B dKO and RING1A/B;BAP1 tKO cells (Fig.
6
b). Of
note, proliferation of the two mutant conditions was unimpaired
(Supplementary Fig. 6). We
first assessed the overlap between
genes positively regulated by BAP1 and negatively regulated by
PRC1. As shown in Fig.
6
c, a minority of genes, 17%, were under
such opposite regulation. Analysis of BAP1-only-regulated genes
as a group confirmed the absence of regulation by PRC1 (Fig.
6
d)
and also showed that this set of genes has an overall higher level
of expression compared with BAP1/PRC1-regulated genes
(Fig.
6
d). To determine whether this BAP1-mediated
transcrip-tional regulation nevertheless depends on PRC1-mediated
H2AK119ub1, we assessed transcriptional changes in RING1A/
B;BAP1 tKO versus RING1A/B dKO. BAP1 was the only DE
transcript between the two mutant conditions (Fig.
6
e), indicating
that BAP1 is no longer functional in the absence of PRC1 activity.
Consistently, transcriptional response to RA treatment was
equivalent in RING1A/B dKO and RING1A/B; BAP1 tKO cells
(Fig.
6
f, transcriptional response to RA differs in RING1A/B dKO
e
Overlap between downregulated genes
g
ASXL1 PolII Input ASXL1 Input PolII 6.5 Mb 0 12 0 12 0 12 0 12 0 248 0 248 0 117 0 117 21 Kb RPL3a
b
1 0 4 8 24 48 RA treatment (h) 1 4 8 24 48 RA treatment (h) 0 –2.5 0.0 2.5 5.0 7.5 WT BAP1 KO log2FC RA vs. untreated p < 0.0001f
–2 kb TSS TES 2 kb Genes –2 kb TSS TES 2 kb –2 kb TSS TES 2 kb 0.0 0.2 0.4 0.6 ASXL1 –2 kb TSS TES 2 kb PolII –1.2 –0.8 –0.4 0.0 0.4 0.8 1.2 1.6 0 1 2 3 0 1 2 3 Pearson R = 0.8 ASXL1 PolIId
c
BAP1 KO CREBBP KO SMARCB1 KO 0 10 20 30 40 Expres s io n re lative to TBP CYP26A1 HAP1 WT BAP1 KO SMARCB1 KO CREBBP KO 0 1 2 3 4 5 6 Expres si o n re lative to TBP RARB BAP1 KO WT Mean log2TPM CREBBP KO WT SMARCB1 KO WT BAP1-regulated (1498 genes) CREBBP-regulated (1106 genes) SMARCB1-regulated (862 genes) –10 –5 0 5 10 15 –10 –5 0 5 10 15 –10 –5 0 5 10 15 945 552 346 213 175 176 165Fig. 5 Comparison of BAP1 and the CREBBP and SMARCB1 co-activator proteins. a RT-qPCR analysis of CYP26A1 and RARB expression following RA treatment at different time-points in wild-type or BAP1, CREBBP, and SMARCB1 KO cells. n = 2. b Violin plots showing log2 fold-change expression of RA-responsive genes (n = 114 genes, see text for details) in wild-type and BAP1 KO cells. P-value from the Mann–Whitney test is shown. c Violin plots showing log2TPM expression of BAP1- CREBBP-, and SMARCB1-regulated genes in wild-type (WT) or in the respective KO conditions.d Venn diagram showing overlap between genes that are downregulated in BAP1, CREBBP, and SMARCB1 KO cells. e Heatmaps showing ASXL1 and RNA PolII density around the TSS and termination end site (TES) (including 2-kb upstream and downstream) scaled to an equivalent 10 kb in human HEK-293 cells. Corresponding average profiles are plotted above each heatmap. f Scatterplot showing PolII versus ASXL1 enrichment around the TSS (including 2 kb upstream and downstream) at all annotated genes. Pearson correlation coefficient is displayed. g Snapshots of ASXL1 and RNA PolII enrichment at representative regions. The input is displayed below each corresponding ChIP-seq experiment
–4 0 4 8 –5 0 5 10 Avg. logCPM logFC BAP1
a
RING1A/B; BAP1 KO vs. RING1A/B KO
f
b
- RING1B - BAP1 - H2AK119ub1 - H3K27me3 - H4 - RING1A RING1A/B BAP1+
–
–
–
+
+
–
–
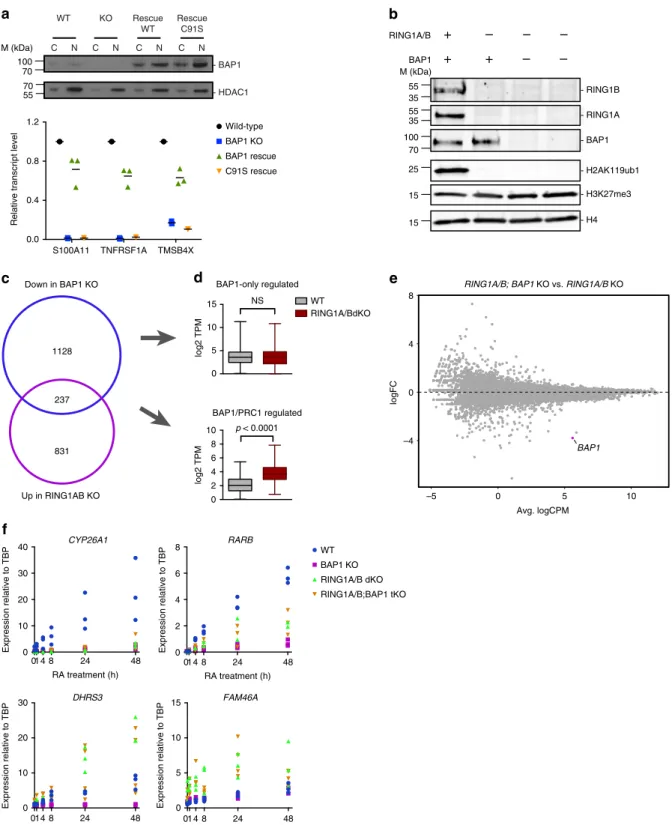
M (kDa) 35 35 55 55 100 70 25 15 15e
01 4 8 24 48 0 10 20 30 40 RA treatment (h) Expressi on re lative to TBP CYP26A1 WT BAP1 KO RING1A/B dKO RING1A/B;BAP1 tKO 01 4 8 24 48 0 2 4 6 8 RA treatment (h) Expressi on re lative to TBP RARB 014 8 24 48 0 10 20 30 RA treatment (h) Expressi on re lative to TBP DHRS3 01 4 8 24 48 0 5 10 15 RA treatment (h) Expressi on re lative to TBP FAM46A C N C N C N C N WT KO Rescue WT Rescue C91S - BAP1 - HDAC1 100 70 M (kDa) 70 55 S100A11 TNFRSF1A TMSB4X 0.0 0.4 0.8 1.2Relative transcript level
Wild-type BAP1 KO BAP1 rescue C91S rescue 1128 831 237 Down in BAP1 KO Up in RING1AB KO WT RING1A/BdKO 0 5 10 15 log2 TPM NS 0 2 4 6 8 10 log2 TPM p < 0.0001 BAP1/PRC1 regulated BAP1-only regulated
c
d
Fig. 6 BAP1 function relies on its deubiquitinase activity against H2AK119ub1. a Reintroduction of wild-type or catalytically dead (C91S) BAP1 in BAP1 KO cells. Top panel: western blot analysis of BAP1 expression in cytoplasmic (C) or nuclear (N) fractions. HDAC1 is used as a loading control. Bottom panel: RT-qPCR analysis of three BAP1-regulated genes in wild-type, BAP1 KO and the two rescue conditions. Horizontal bars indicate the mean expression. n = 3. b Western blot analysis of RING1A, RING1B, BAP1, H2AK119ub1, and H3K27me3 in wild-type, RING1A/B double KO, or RING1A/B; BAP1 triple KO HAP1 cells. H4 is used as a loading control.c Venn diagram showing the overlap between genes downregulated in BAP1 KO or upregulated in RING1A/B dKO cells.d Box-plots (median, lower, and upper quartiles, lowest and highest values) of log2 transcript per million (TPM) expression values of BAP1-only-regulated genes (top) and BAP1/PRC1-BAP1-only-regulated genes61in WT and RING1A/B dKO cells. P-value of the Mann–Whitney test on WT versus RING1A/B dKO comparison is indicated.e Scatterplot showing log2 fold-change (logFC) expression between RING1A/B dKO and RING1A/B; BAP1 tKO cells as a function of average log2 counts per million (logCPM). BAP1, the only differentially expressed genes is highlighted in purple. f RT-qPCR analysis of CYP26A1, RARB, DHRS3, and FAM46A expression following RA treatment at different time-points in wild-type or BAP1, RING1A/B, RING1A/B;BAP1 KO cells
cells compared with WT cells). This result contrasts with the
limited dependency of loss of BAP1 on the PRC2 complex
(Fig.
4
), and suggests that gain of H2AK119ub1 might inhibit
transcription in a way that is partly independent of PRC2. Taken
together, these results establish that PRC1 is epistatic to BAP1.
com and that BAP1 promotes transcription by counteracting
PRC1-mediated H2A ubiquitination (Fig.
7
).
Discussion
Despite their prominent roles as tumor suppressors, the biological
functions of BAP1 and ASXL proteins remain poorly
character-ized. In this study, we performed extensive biochemical and
genetic analyses in isogenic mutant cell lines to address the role of
BAP1 in transcriptional regulation, the respective contributions
of BAP1 and the ASXL proteins to the regulation of gene
expression and the interplay between BAP1.com and the
Poly-comb machinery.
Both biochemical and genetic evidence indicate that BAP1 and
ASXL proteins function together to regulate H2AK119ub1 and
gene expression. Our biochemical analyses largely confirm the
previously reported interactome of BAP1
9and further enable
distinguishing transient interactors (FOXK1/2, MBD5/6, HCFC1,
etc.) from the core complex composed of BAP1 and one ASXL
paralog. With the exception of KDM1B, which appears to interact
specifically with BAP1-ASXL2, the BAP1 interactome is
essen-tially identical whether the complex forms around ASXL1 or
ASXL2. This might reflect the fact that most of the interactions
are mediated directly by BAP1, as suggested for HCFC1, YY1,
OGT, and FOXK1/2
3,35. Nonetheless, interaction with the ASXL
paralogs is required for BAP1 enzymatic activity and protein
stability. The overall interchangeability between the ASXLs
explains the observation that knocking out a single paralog only
mildly affects gene expression. An immediate implication of this
finding concerns the tumor-type-specific spectrum of BAP1 and
ASXL mutations. While previous studies have argued that this
non-overlapping mutation spectrum might be the result of
independent and sometimes opposite functions of BAP1 and
ASXL proteins
24,29, our
findings instead suggest that, due to the
redundancy among ASXL proteins, the loss of only one of them
results in a much less severe disruption of BAP1.com function
than loss of BAP1. Hence, we propose that the predominance of
ASXL mutations in myeloid malignancies may be the result of a
selective pressure aimed at only partially ablating BAP1 function,
whereas loss of BAP1 in other malignancies would reflect a need
for complete inactivation of the complex.
In contrast to the reported role of Calypso in Drosophila, our
results argue against an implication of BAP1.com in the
Poly-comb machinery. Instead, the picture that emerges from this
work is that the function of BAP1.com is to promote
transcrip-tion by limiting PRC1 repressive activity. This property may not
be surprising given that the activity of the complex is opposite to
that of PRC1 in the regulation of H2A ubiquitination and that
PRC1 and ASXL1 show rather distinct localization patterns
9. The
more limited dependency on PRC2 activity that we observed is
likely the result of partly divergent functions between the two
Polycomb complexes, and in particular the ability of PRC1 to be
recruited and silence genes independently of PRC2
42,43.
Our
findings are also in line with previous studies using
arti-ficial recruitment of BAP1 to a transgene
3, overexpressing
hyperactive forms of ASXL1
44or focusing on individual loci
30,
which all support a role for BAP1 in gene activation. An obvious
question arising from these results is whether BAP1 and Calypso
have divergent functions or whether we can reconcile their
pro-posed contributions to gene regulation in both species. First, it is
noteworthy that there is no clear consensus as to whether the
Calypso–Asx complex is generally involved in
Polycomb-mediated silencing. Indeed, mutation of Asx in Drosophila leads
to a complex phenotype that exhibits features of both Polycomb
and Trithorax mutants
45, a situation that is also found in Asxl1
mutant mouse embryos
46. Second, only a subset of Polycomb
target genes was found to be aberrantly activated upon loss of Asx
or Calypso
47. Third, part of the difference might result from the
extent to which BAP1 and Calypso regulate H2A ubiquitination.
Although loss of Asx leads to an approximate 10-fold increase in
the total levels of H2AK118ub1
22, we only observe an
approx-imate twofold increase in the level of the mark upon inactivation
of either of BAP1 or ASXL1/2. This suggests that in Drosophila,
the Calypso–Asx complex might have a more critical function in
restricting PRC1 activity to its normal site of action. Aberrant
deposition of H2AK119ub1 and consequently of H3K27me3
could indirectly impair Polycomb-mediated transcriptional
silencing. Genome-wide functional studies analyzing the global
consequences of loss of Asx or Calypso in
flies should help clarify
these questions and address whether PR-DUB and BAP1.com
have similar functions.
Interestingly, the function of BAP1 in stimulating transcription
is comparable to that of well-known general co-activators such as
SMARCB1 and CREBBP, not only to ensure steady-state gene
transcription of hundreds of genes but also in response to stimulus
as exemplified by RA treatment. Hence, efficient transcriptional
stimulation entails the action of enzymatic activities that converge
at creating a permissive chromatin environment, either through
histone eviction and/or repositioning (e.g., SMARCB1), reduction
of histone charge through acetylation (e.g., CREBBP) or removal of
repressive chromatin marks (e.g., BAP1). Interestingly, these
dif-ferent activities can be needed together or separately, as suggested
by our observation that SMARCB1, CREBBP, and BAP1 regulate
common, as well as specific sets of genes. As BAP1.com generally
colocalizes with the transcriptional machinery, we speculate that
while present at most transcribed regions, BAP1.com impacts gene
expression selectively depending on the chromatin environment.
Further investigation will be necessary to decipher what determines
the transcriptional response to BAP1 deletion. It will also be
interesting to investigate what controls BAP1.com targeting to
transcribed regions. We envision that the ASXL proteins, through
their PHD
finger, a domain that can potentially bind methylated
lysine or arginine residues
48, could participate in reading
post-translational marks associated with active transcription. Our work
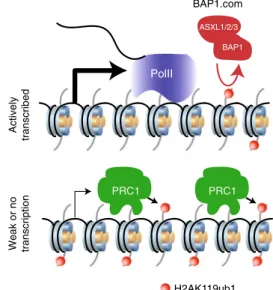
provides insight into the function of BAP1.com and paves the way
BAP1.com BAP1 ASXL1/2/3 PRC1 H2AK119ub1 Weak or no transcription Actively transcribed PRC1 PolIIfor novel strategies to target tumors harboring alterations in this
chromatin-modifying complex.
Methods
Cell lines. HAP1 cells were kindly provided by T. Brummelkamp and cultured in Iscove’s Modified Dulbecco’s Medium media supplemented with 10% fetal bovine serum (FBS) and 1%L-glutamine. HeLa-S3 cells were kindly provided by S.
Ait-Si-Ali. They were cultured in adherence in Dulbecco’s modified Eagle’s media (DMEM) supplemented with 10% FBS and 1%L-glutamine. Non-adherent culture of HeLa cells was performed in DMEM supplemented with 5% FBS and 1%L
-glutamine following guidelines from Nakatani and Ogryzko49. SF9 cells were
cultured in SF-900 II serum-free medium (Invitrogen) supplemented with 5% FBS, 1% penicillin/streptomycin (Invitrogen) and Amphotericin B at 28 °C. All cell lines were tested for mycoplasma contamination on a regular basis.
Constitutive KOs in HAP1 cell line. Mutations of BAP1, ASXL1, ASXL2, EZH2, RING1A, and SMARCB1 in HAP1 cells were performed using CRISPR/CAS9 technology using the strategy described in34. Briefly, a STOP cassette containing a
antibiotic resistance gene followed by a polyadenylation sequence from SV40 was inserted by homologous recombination in intronic or exonic sequences of the target genes. Intronic targeting vectors include the EN2 splice acceptor sequence for proper splicing of the antibiotic resistance gene. Antibiotic resistance clones were then picked in 96-well plates and genotyped. KOs were validated by RT-qPCR and western blot when the corresponding antibody was available. The selected clones were thus used as constitutive KOs, using the parental cell line as a control in all experiments. RING1B and CREBBP KO HAP1 cells were purchased from Horizon Discovery.
Stable expression in HeLa cells. For mass spectrometry analysis of Flag-tagged BAP1, ASXL1, ASXL2, and KDM1B in HeLa cells, complementary DNAs (cDNAs) encoding the different proteins werefirst subcloned in pRev retroviral plasmid (gift from S. Ait-Si-Ali), downstream a 2xFlag-2xHA sequence and upstream an internal ribosome entry site sequence followed by CD25 cDNA. Retroviruses were pro-duced by transfection of a 293 Phoenix cell line (gift from S. Ait-Si-Ali) and HeLa-S3 cells were infected by incubation with viral supernatants for 3 h at 37 °C. Infected cells were then selected byfluorescence activated cell sorting against CD25 expression using CD25-FITC antibody and following manufacturer’s instructions (BD Biosciences 553866). Expression was assessed by western blot analysis of nuclear extracts.
Rescue experiment (BAP1 WT and C91S). Reintroduction of wild-type or enzymatically dead (C91S) BAP1 was performed by infection of BAP1 KO cells with a pBABE retrovirus50. Production of retroviral particles was performed in
293T cells. Transduction was performed by incubating the cells with viral particles mixed with Polybrene (final concentration, 8 μg/ml) for 3 h at 37 °C and subse-quently selected with puromycin.
Proliferation assays. In all, 10,000 cells were plated in six-well plates in triplicates and counted every 24 h over 4 days using a Vi-cells counter (Beckman-Coulter). RT-qPCR. Total RNA was isolated using Trizol-Chloroform extraction and iso-propanol precipitation. cDNA was synthesized using High Capacity cDNA RT kit (4368814-Applied Biosystems) and quantitative PCR was performed with technical triplicate using SYBR green reagent (Roche) on a ViiA7 equipment (Applied Biosystems). At least two independent experiments (biological replicates) were performed for each assay and RT negative controls were always included. Primer sequences for qPCR analysis are provided in Supplementary Table 1.
RNA sequencing. RNA sequencing were performed for two independent biolo-gical replicates for each condition. In total, 100-bp single-end reads were generated for the RA analysis and 100-bp paired-end reads for all other samples using the HiSeq 2500 platform. Raw reads were trimmed with cutadapt (1.12;51) using the
Trim Galore! (0.4.4;bioinformatics.babraham.ac.uk) wrapper (default settings) and subsequently aligned to the complete human ribosomal RNA sequence with bowtie (1.2;52). Reads that did not align to rRNA were then mapped to the human
reference genome (GRCh37/hg19) and gene counts generated with STAR (2.5.2b;53) using the following parameters: --quantMode GeneCounts
SAMtype BAM SortedByCoordinate --runMode alignReads
--out-FilterMismatchNmax 6 --outFilterMultimapNmax 20 --outSAMmultNmax 20 --outSAMprimaryFlag OneBestScore. Counts were generated using properly paired (for paired-end data) and uniquely mapped reads that overlap the exon boundaries of each gene. More than 94% of reads mapped uniquely for all paired-end sequencing samples and >92% for single end. Per sample read counts are provided in Supplementary Table 2.
BAMfiles for the CREBBP-KO and HAP1-WT samples were obtained from the Institut de Cancérologie Gustave Roussy and gene counts for these samples were generated using featureCounts (1.5.1;54) with the following parameters: -C -p -s 2
-T 8 -F GTF -t exon. Raw reads were trimmed as part of bcl2fastq for Illumina adapters and aligned with RSEM (1.2.25;55) and Bowtie2 (2.2.6;52) to GRCh37/
hg19 using default parameters. Total uniquely mapping reads were calculated using RSeQC (2.6.4;56).
The reference FASTA was downloaded from UCSC (http://hgdownload.cse. ucsc.edu/goldenPath/hg19/) and the annotation (GTF)file from gencodegenes.org (comprehensive gene annotation Release 19/GRCh37.p13).
Differential expression analysis. Genes werefiltered to include those with counts per million (CPM) > 0.5 in at least two samples. Raw count data were transformed to log2-CPM and normalized with the TMM method using edgeR (3.18.1; Robinson 2010 and McCarthy 2012). A linear model wasfit to the normalized expression values for each gene and empirical Bayes statistics were computed for each KO versus wild-type or rescue with limma (3.32.7; Ritchie, 2015). DE genes were identified from the linear fit after adjusting for multiple comparisons and filtered to include those with FDR < 0.05 and absolute logFC > 1.
GO enrichment analysis was performed with goseq (1.28.0) using the Wallenius method to calculate a probability weighting function for top differential genes as a function of a gene’s median transcript length. GO terms with FDR < 0.01 were collapsed using REVIGO57.
CREBBP, SMARCB1, BAP1 analysis. Raw data for SMARCB1 and WT were downloaded from GEO (GSE75515). RNA-seq analysis was performed as described previously. Only genes common to all datasets were used in the analysis. Sig-nificance of overlap for significantly upregulated and downregulated genes between all three KOs was determined applying a one-sided Fisher’s exact test (alternative hypothesis= greater).
Chromatin immunoprecipitation. For ChIPs experiment, cell confluence and amount of starting material were kept constant by plating defined number of cells 2 days before cross-linking. Briefly, cells were fixed in 1% formaldehyde for 10 min at room temperature, quenched by adding glycine to afinal concentration of 0.125 M, rinsed with phosphate-buffered saline (PBS) and resuspended in buffer LB1 (Hepes-KOH pH 7.5 50 mM, NaCl 140 mM, EDTA 1 mM, glycerol 10%, NP-40 0.5%, Triton X-100 0.25%+ Protease inhibitors). Cells were rocked at 4 °C for 10 min, pelleted and resuspended in buffer LB2 (NaCl 200 mM, EDTA 1 mM, EGTA 0.5 mM, Tris pH 8 10 mM+ Protease inhibitors), pelleted again and resuspended in buffer LB3 (EDTA 1 mM, EGTA 0.5 mM, Tris pH 8 10 mM+ Protease inhi-bitors). Sonication was performed on a Bioruptor (Diagenode), 0.5% N-lauroyl-sarcosine added and after rocking at room temperature for 10 min supernatant was kept. For the immunoprecipitation, chromatin (10μg) was incubated antibodies (around 2μg) overnight in presence of 1% Triton and 0.1% sodium deoxycholate. Beads blocked with bovine serum albumin were added the day after and incubated at 4 °C for 3 h before processing to the washes in RIPA buffer six times (50 mM Hepes pH 7.6, 10 mM EDTA, 0.7% DOC, 1% NP-40, 0.5 M LiCl+ Protease inhibitors) and once in buffer TEN (10 mM Tris pH 8.0, 1 mM EDTA, 50 mM NaCl). Elution was done in buffer TES (50 mM Tris pH 8.0, 10 mM EDTA, 1% sodium dodecyl sulfate), before reversing the crosslink overnight and incubating the samples successively with RNAse A and proteinase K prior to phenol/ chloroform/isoamyl-alcohol DNA extraction. ChIPs were analyzed by qPCR using the primers described in Supplementary Table 1.
ChIP sequencing. In total, 100-bp single-end reads were generated using the HiSeq2500 platform. Reads were mapped to the human reference genome (GRCh37/hg19) with Bowtie2 (2.2.9) using default parameters. PCR duplicates were removed with Picard Tools MarkDuplicates (1.97;http://broadinstitute. github.io/picard). Total uniquely mapping reads were calculated using RSeQC bam_stat.py (2.6.4). BAMfiles were filtered to exclude common artifact regions (merged consensus artifact regions:http://mitra.stanford.edu/kundaje/akundaje/ release/blacklists/hg19-human/). Reads were counted in bins of length 25, RPKM normalized, and converted to bigWig format using DeepTools bamCoverage (2.4.1) for all heatmaps.
Scores upstream and downstream of transcription start sites (TSSs) were computed from normalized bigWigfiles with deepTools computeMatrix (2.4.1) using reference-point mode. TSS plots were generated with deepTools plotHeatmap (2.4.1).
To identify regions that gain or lose H2AK119ub1, differential analysis was performed using SICER (1.1) between the BAP1 KO and WT H2AK119ub1 using random background to determine statistically enriched regions. To assess the window and gap sizes used in the analysis, we plotted the aggregate score versus the gap size for window sizes of 200, 400, 600, and 800 and gap sizes 1w to 5w. Increasing the window size to 800 showed saturation near a gap of 4w. A gap size of 2400 (3w) corresponded with a score that was sufficiently close to saturation and was chosen for thefinal analysis. For gap sizes 1w up to 5w, BAP1 KO showed an average of 3.6× more H2AK119ub1 enriched regions than the WT. With w= 800 and g= 2400, 12,388 regions (average length = 24,714.2) were significantly increased (E= 1000, L = 0.74) in the H2AK119ub1 BAP1 KO v. WT and 3456 regions (average length= 30,712.9) were significantly decreased.
PolII, BAP1 and ASXL1 ChIP-seq analysis. Raw data were downloaded from GEO (GSE40723, GSE36027, GSE51673, and GSE31477). FASTQfiles were merged for samples with multiple runs and mapping was performed as previously described to hg19 or mm10. bigWigfiles were generated with deepTools bamCoverage (2.4.1).