HAL Id: hal-01922096
https://hal.archives-ouvertes.fr/hal-01922096
Submitted on 14 Nov 2018
HAL is a multi-disciplinary open access
archive for the deposit and dissemination of
sci-entific research documents, whether they are
pub-lished or not. The documents may come from
teaching and research institutions in France or
abroad, or from public or private research centers.
L’archive ouverte pluridisciplinaire HAL, est
destinée au dépôt et à la diffusion de documents
scientifiques de niveau recherche, publiés ou non,
émanant des établissements d’enseignement et de
recherche français ou étrangers, des laboratoires
publics ou privés.
Combination of supervised learning and unsupervised
learning based on object association for land cover
classification
Na Li, Arnaud Martin, Rémi Estival
To cite this version:
Na Li, Arnaud Martin, Rémi Estival. Combination of supervised learning and unsupervised learning
based on object association for land cover classification. DICTA2018, Dec 2018, Canberra, Australia.
�hal-01922096�
Combination of supervised learning and
unsupervised learning based on object association
for land cover classification
Na Li
IRISA - University of Rennes 1 - Total France
Email: li.na@irisa.fr
Arnaud Martin
IRISA - University of Rennes 1 France
Email: arnaud.martin@irisa.fr
R´emi Estival
Total, Innovative acquisition France
Email: remi.estival@total.com
Abstract—Conventional supervised classification approaches have significant limitations in the land cover classification from remote sensing data because a large amount of high quality labeled samples are difficult to guarantee. To overcome this limitation, combination with unsupervised approach is considered as one promising candidate. In this paper, we propose a novel framework to achieve the combination through object association based on Dempster-Shafer theory. Inspired by object association, the framework can label the unsupervised clusters according to the supervised classes even though they have different numbers. The proposed framework has been tested on the different combi-nations of commonly used supervised and unsupervised methods. Compared with the supervise methods, our proposed framework can furthest enhance the overall accuracy approximately by 8.2%. The experiment results proved that our proposed framework has achieved twofold performance gain: better performance on the insufficient training data case and the possibility to apply on a large area.
Index Terms—Object association, land cover classification, combination of supervised learning and unsupervised learning.
I. INTRODUCTION
As an essential mid-step for environment monitoring and change detection, the generation of thematic land cover maps through remote sensing data has been considered as one of the most important applications of remote sensing. Many studies on classification methods have been carried out to produce a reliable thematic land cover map.
Supervised learning provides thematic land cover maps with high accuracy thanks to the prior knowledge used in the training process. The prior information utilized in supervised learning can be either derieved in pixel level [1], [2] or object level [3], [4], [5]. Numerous supervised classification algorithms have been developed, many of which yield very promising results. Maximum Likelihood Classification (MLC) is the most commonly used supervised classification, which assumes that training data are normally distributed. It renders satisfying performance in many studies [6], [7]. MLC has been proved robust for remote sensing images, as long as the data meets the distribution assumption (e.g. a Gaussian distribution) [8]. Even though an appropriate classification methodology and proper data sets are employed to generate land cover maps, supervised approaches usually require a large
amount of high quality reference data for training process. However, it is not always possible to collect ground truth especially for a large or inaccessible area.
Unsupervised learning is another important group of meth-ods applied on land cover classification [9]. The most highlight advantage is that it can automatically convert raw image data into distinguished clusters without prior ground knowledge. K-means and Iterative Self-Organizing Data Analysis Technique Algorithm (ISODATA) are the most commonly used unsuper-vised approaches in remote sensing thanks to their promisng performance in many studies [10], [11]. However, even though unsupervised approaches are more appropriate for large and inaccessiable areas, they can not directly produce thematic land cover maps; therefore time-consuming manually labeling process is always required. Due to the lack of prior ground information, unsupervised learning is usually less accurate than supervised learning [12].
As both supervised and unsueprvised methods have their pros and cons, it is thus necessary to consider to combine them together for better results. Although many studies have been carried out to achieve the combination, most of them focus on hierarchical structures which makes supervised learning and unsupervised learning dependent [13]. This kind of combina-tion is less robust as the mistakes from the former classifier may be hard to reduce by the latter especially when it is unsupervised. Many combinations have been also developed in feature level [14] to generate more representative feature spaces or hyper planes; therefore it is difficult to measure uncertainties of the results from each individual classifier.
The combination in the decision level of independent super-vised and unsupersuper-vised classifiers is still a big challenge. In [15], the authors applied Dempster-Shafer theory to achieve this combination, considering supervised learning and unsu-pervised learning as independent sources, through which the uncertainty and the imprecision in the fusion can be measured. However, currently existing methods do not focus on the conflict situation where the number of supervised classes is not the same as the number of unsupervised clusters.
Therefore, in this paper, we proposed a novel framework using object association based on Dempster-Shafer theory to
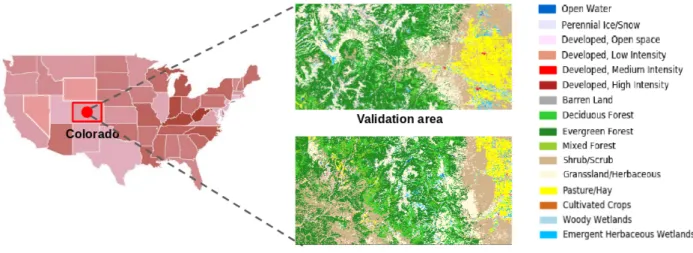
Fig. 1: Map of the study area
combine supervised learning and unsupervised learning when the number of classes and the number of clusters are different. Furthermore, this framework can be applied to improve the ac-curacy of supervised learning when training data are severely insufficient.
This paper is organized as follows: In section II, we intro-duce the study area and data set, followed by some bases of Dempster-Shafer theory in section III. Object association prob-lem is explained in section IV. Section V presents the proposed framework in details. Then, section VI illustrates results of our experiments. Conclusions are drawn in section VII.
II. STUDY AREA AND DATA SETS
A. Study area
The area of study located in Colorado in United Status, lies within latitudes 38◦30053.4400N - 36◦22023.0500N and longitudes 108◦0010.2400W - 105◦18035.6000W. It is contained San Juan National Forest and Rio Grande National Forest, as shown in Fig.1. The two national forest parks are mainly com-posed of deciduous forest, evergreen forest, mix forest. The remaining natural vegetation still occurs as shrub, grassland and herbaceous. A large area of pasture is also contained near Monte Vista. This selected area contains two national forest parks as well as various developed areas thus can be used to mimic the complex environment with a wide range of land covers. We separate the study area into two subareas of equal size: validation area and training area.
B. Satellite
The satellite used in this study is LandSat-8 OLI consisting of eight spectral bands with a spatial resolution of 30 meters, a panchromatic band with a resolution of 15 meters and two thermal bands with a resolution of 100 meters. The image acquired on the 11 June 2018 was obtained from USGS Earth Explorer [16]. Geometric correction of the image has already done through UTM map projection by NASA. The bands used for our study include band 1-7 which are all spectral bands.
C. Training and validation data
Training and validation data applied in our study was obtained from National Land Cover Database 2011 (NLCD 2011) [17], which was created by the Multi-Resolution Land Characteristics (MRLC) Consortium. NLCD 2011 has 16-class land cover 16-classification scheme that has been applied consistently across the United States at a spatial resolution of 30 meters. The code of the land cover classification scheme of NLCD 2011 is shown in Table I.
TABLE I: Land cover classification scheme of NLCD 2011
Code Legend Code Legend 11 Open Water 42 Evergreen Forest 12 Perennial Ice/Snow 43 Mixed Forest 21 Developed, Open Space 52 Shrub/Scrub 22 Developed, Low Intensity 71 Grassland/Herbaceous 23 Developed, Medium Intensity 81 Pasture/Hay 24 Developed, High Intensity 82 Clutivated Crops 31 Barren Land (Rock/Sand/Clay) 90 Woody Wetlands 41 Deciduous Forest 95 Emergent Herbaceous
Wetlands
In our study, we select half of the study area as the training area which includes all 16 types of land covers mentioned in Table I with the size of 2000×4000 pixels to generate training samples, as shown in Fig. 1. The other half of the study area with the same size is chosen as validation area as shown in Fig. 1. To simulate the situation where training samples are insufficient for supervised classifier, only a small amount of pixels per class are randomly selected as training samples, which will be explained in details in section VI
III. DEMPSTER-SHAFER THEORY
As a generalization of traditional probability, Dempster-Shafer theory [18], [19] allows to distribute support to not only a single proposition itself but also to the union of propositions. One of the greatest advantages of Dempster-Shafer theory is that it allows to take into consideration uncertainty and
imprecision at the same time via two functions: belief and plausibility, derived from mass function. The mass function is defined on all the subsets of the frame of discernment Ω = {ω1, . . . , ωn}, and assigns belief degree to all the
elements in the power set of discernment, noted as 2Ω. The sum of the masses of all the propositions is one:
X
A⊆Ω
m(A) = 1 (1) On the contrary, the mass function of the null proposition ∅ is usually set to zero but it is also possible to be a positive value. m(∅) = 0 refers to a closed world hypothesis, in which the discernment Ω contains all the possible situations in reality. If m(∅) is superior to 0, this corresponds to an open world hypothesis, where unknown situation outside of Ω can be considered. m(A) can be considered as a degree of evidence supporting the claim that a specific element of Ω belongs to the set A, yet not to any subset of A [20].
IV. OBJECT ASSOCIATION
Object association was originally derived from tracking problem to estimate the status of mobile objects detected by multiple sensors. Mathematically speaking, object association refers to match two finite set of objects E = {e1, ..., en} and
F = {f1, ...fp} with possibly different combinations. It is
usually assumed that each object in one set should be matched with at most one object in the other set. An object is possible to disappear between two successive time frames, which leads to no correspondent counterpart for this object in the other set. The problem could be considered in the framework of Dempster-Shafer theory, also referred as Belief function. Therefore, a piece of evidence presenting the possible as-sociation of two objects ei and fj can be modeled by a
mass function mij on the discernment Θij = {0, 1}. Let
Rij represent the relation between the object ei and fj. The
mass function mij({1}) refers to the probability of Rij = 1,
mij({0}) is the probability Rij = 0 and mij({0, 1}) is the
probability of knowing nothing about the relation Rij .
Several solutions about choosing the best relation R∗based on pairwise mass functions mij have been proposed. In [25],
the authors combines the mass function mij for each i and
then find the best relation R∗ through maximum pignistic probability. In [26], the problem is transferred into an equiva-lent linear assignment problem and then searches for the most plausible relation as the best one, which thus can be solved in polynomial time. Since the number of classes and clusters is large in our study, we applied the approach proposed in [26] on the combination of supervised learning and unsupervised leaning. It can be stated as the following inter linear program:
max( n X i=1 p X j=1 ωijRij) (2) subject to p X j=1 Rij ≤ 1 ∀i ∈ {1, ..., n} (3) n X i=1 Rij ≤ 1 ∀j ∈ {1, ..., p} (4) Rij ∈ {0, 1} ∀i ∈ {1, ..., n}, ∀j ∈ {1, ..., p} (5)
in which wij is a coefficient generated by mij presenting the
uncertainty as well as imprecision on the evidence of relation between ei and fj.
V. THE PROPOSED FRAMEWORK
A. Combination of supervised learning and unsupervised learning
Let us denote S as the set of classes generated from supervised learning and C as the set of clusters derived from unsupervised learning. Based on the principle of object association, we have to match elements from two sets of objects S = {s1, ..., sn} and C = {c1, ..., cp} with the most
possible combination.
As explained in Section IV, mass function mij with 1 ≤
i ≤ n, 1 ≤ j ≤ q, indicates all available evidences about the association between S and C. Each mij encodes a piece of
evidence about a binary variableRij. This variable indicates
si is the same type as cjwhen it equals to 1, and 0 otherwise.
Each mij is thus on the discernment Θ = {0, 1} having:
mij({1}) = αij (6)
mij({0}) = βij (7)
mij({0, 1}) = 1 − αij− βij (8)
where αij and βij is measured based on the similarity between
a class si and a cluster cj.
We assumed that n < p because the number of class, a kind of prior knowledge, can be consider as the lower bound of the number of cluster which is an unknown variable in real situation. Hence, a cluster cj is usually smaller than a class
si. To measure the similarity between si and cj, we consider
the percentage of pixels in cj is labeled as si. We thus use the
ratio of pixels in intersection of si in cj to pixels in cj as the
similarity δij, shown as follows:
δij =
|si∪ cj|
|cj|
(9) For αij and βij, we have:
αij = γδij (10)
βij = γ(1 − δij) (11)
in which γ represents a discounting coefficient ranging from 0 to 1 to measure the reliability of classifiers.
To assign label of classes to clusters, we consider the following linear optimization problem:
max
R (
X
i,j
Fig. 2: The proposed framework. subject to p X j=1 Rij ≥ 1 ∀i ∈ {1, ..., n} (13) n X i=1 Rij = 1 ∀j ∈ {1, ..., p} (14) Rij ∈ {0, 1} ∀i ∈ {1, ..., n}, ∀j ∈ {1, ..., p} (15) with ωij = ln 1 − βij 1 − αij (16) The most plausible relation R∗, which indicates assignments between classes and clusters, can thus be found by solving the above optimization problem.
Unlike to classical object association problem where each object in one set has at most one counterpart in the other set, in our problem, each class sican be assigned to multiple clusters
while each cluster cj is merely matched with one class as we
always have n < p.
B. Generation of land cover map for a large area
The proposed framework can produce a thematic land cover map on a large area merely by deploying a supervised approach on a small slice of the validation region. We select a slice of area containing all types of land covers to employ a supervised learning approach. On the contrary, unsupervised learning approach is applied on the whole area. The principal ideal behind the proposed framework is to assign the most plausible label to each clusters in the same area where thematic labels are offered by the supervised approach; later we can enlarge these labeled clusters to the whole area.
The main steps of the proposed framework is shown in Fig 2, in which the region marked with orange rectangular denoted as A is the selected slice for conducting supervised learning approach. The set of classes produced by the super-vised approach deployed on the region A is denoted as:
SA= {sA1, ..., sAn} (17) The set of clusters from the unsupervised learning on the entire validation area is denoted as:
C = {c1, ..., cp} (18)
The set of clusters in the region A denoted as CA is defined as:
CA= {cAi|c A
i = ci∩ SA} (19)
The object association is firstly applied between the set SA and the set CA; therefore clusters in CA can be all assigned by a thematic label from the supervised approach. To enlarge thematic labels to the whole area representing by the set of clusters C, we assign each cluster ci with the same label as
its subset cA
i shown as follows:
L(ci) = L(cAi) (20)
where L(x) represents the final thematic label of object x. VI. EXPERIMENT RESULTS AND DISCUSSION
In this section, we tested the proposed framework with different combinations of supervised learning and unsuper-vised learning. To verify the possibility to apply the proposed framework on a large area, we only carried out supervised learning on a quarter of the validation area. Based on the labels it generates, a thematic land cover map of the entire
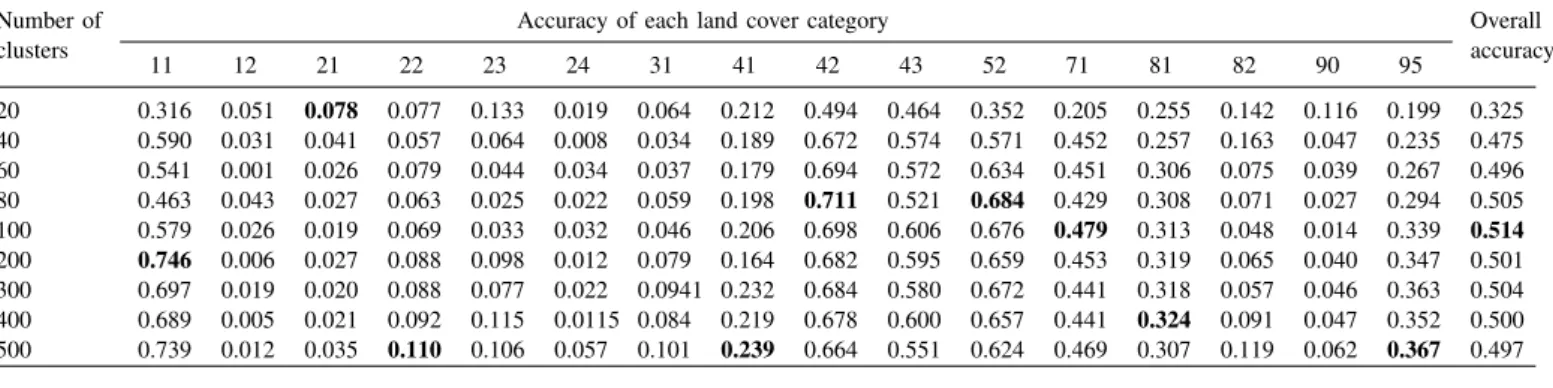
TABLE II: Comparison of MLC and MLC + ISODATA in classification accuracy.
Number of clusters
Accuracy of each land cover category Overall accuracy 11 12 21 22 23 24 31 41 42 43 52 71 81 82 90 95 20 0.316 0.051 0.078 0.077 0.133 0.019 0.064 0.212 0.494 0.464 0.352 0.205 0.255 0.142 0.116 0.199 0.325 40 0.590 0.031 0.041 0.057 0.064 0.008 0.034 0.189 0.672 0.574 0.571 0.452 0.257 0.163 0.047 0.235 0.475 60 0.541 0.001 0.026 0.079 0.044 0.034 0.037 0.179 0.694 0.572 0.634 0.451 0.306 0.075 0.039 0.267 0.496 80 0.463 0.043 0.027 0.063 0.025 0.022 0.059 0.198 0.711 0.521 0.684 0.429 0.308 0.071 0.027 0.294 0.505 100 0.579 0.026 0.019 0.069 0.033 0.032 0.046 0.206 0.698 0.606 0.676 0.479 0.313 0.048 0.014 0.339 0.514 200 0.746 0.006 0.027 0.088 0.098 0.012 0.079 0.164 0.682 0.595 0.659 0.453 0.319 0.065 0.040 0.347 0.501 300 0.697 0.019 0.020 0.088 0.077 0.022 0.0941 0.232 0.684 0.580 0.672 0.441 0.318 0.057 0.046 0.363 0.504 400 0.689 0.005 0.021 0.092 0.115 0.0115 0.084 0.219 0.678 0.600 0.657 0.441 0.324 0.091 0.047 0.352 0.500 500 0.739 0.012 0.035 0.110 0.106 0.057 0.101 0.239 0.664 0.551 0.624 0.469 0.307 0.119 0.062 0.367 0.497 MLC 0.771 0.064 0.065 0.109 0.375 0.294 0.591 0.231 0.572 0.764 0.449 0.377 0.278 0.262 0.180 0.327 0.432
TABLE III: Overall accuracy of MLC and MLC+ISODATA with different size of training samples.
Percentage in the training area 0.05% 0.1% 0.2% 0.4% 0.8% 1.2% 1.6% 2.0% 2.4% 5.0% 10.0% 20.0% 40.0% 80.0% 100.0% MLC 0.418 0.437 0.446 0.447 0.451 0.453 0.456 0.457 0.456 0.460 0.470 0.484 0.499 0.528 0.539 MLC+ISODATA 0.475 0.504 0.513 0.510 0.505 0.508 0.507 0.509 0.509 0.511 0.514 0.518 0.529 0.554 0.562
validation area can be produced by the proposed framework, as illustrated in Fig. 2. We also applied supervised learning on the entire validation area to compared with the results from the proposed framework.
Apart from the experiments on different combination of methods, we also conducted the proposed framework with different size of training data and made the comparison with supervised learning. We repeated all the experiments in our study 10 times to take their average results.
A. Combination of MLC and ISODATA
We have first used the combination of MLC and ISODATA in the proposed framework with the number of clusters ranging from 20 to 500. To mimic the situation where training samples are severely insufficient, we first selected a very small amount of training samples to train MLC. Table II summarizes the comparison between the proposed framework and MLC on the validation area with training samples accounting for 0.2% in the training area. The overall accuracy and the accuracy of each land cover category in Table II were measured by confusion matrix. Due to the limitation of space, we have employed the code of NLCD classification mentioned in Table I to represent each land cover category and marked the best accuracy in bold. The overall accuracy of the proposed framework improves as the number of clusters k increasing and the best performance is reached when k = 100.
We displayed the results of MLC shown in Fig. 3a to compare with the best thematic land cover map generated through the combination of MLC and ISODATA, as shown in Fig. 3b. MLC apparently misclassifed a part of shrub as medium intensity developed area. However, after the combi-nation with ISODATA in the proposed framework, the best
(a) Results of MLC.
(b) Results of MLC + ISODATA when k=100.
Fig. 3: Thematic land cover maps
accuracy of shrub is enhanced to 0.684%. This improvement is presented by the reduction of the red area in Fig. 3b.
Besides shrub, other terrestrial vegetation such as decid-uous forest, evergreen forest and grassland also have good improvements of classification accuracy after the combina-tion. However, some land cover categories such as developed areas, barren land and emergent herbaceous wetlands, shows unsatisfying classification accuracy, which are also difficult to
Fig. 4: Accuracy with different size of training samples. enhance in the proposed framework.
We also tested the proposed framework and MLC with the different quantities of training samples fixing k = 100. We started the test on the severely insufficient training samples which only represent 0.05% of the training area. Table. III reports the overall accuracy of MLC and the proposed frame-work with the combination of MLC and ISODATA on the validation area. Fig. 4. gives a more apparent display of the enhancement of their accuracies with the increasing of training samples. The proposed framework always performs better than MLC when the percentage of training samples ranging from 0.05% to 100% and the largest enhancement of accuracy occurs at 0.2%.
B. Combination of SVM and ISODATA
A combination of Support Vector Machine (SVM) and ISODATA was also considered in the proposed framework. In our study, we selected Radial Basis Function (RBF) kernel as it is proved to have better results for LandSat data with 7 bands [27]. The error weight and Gamma value in SVM were set separately to 100 and 0.167 as is proposed in [28].
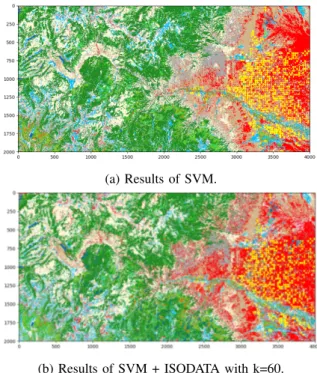
Table IV reports the overall accuracy as well as the accuracy of each individual land cover category when training samples account for 0.2%. The performance of SVM on the entire validation area is also displayed at the bottom of the Table IV to make the comparison. The number of clusters k ranged from 20 to 500 with the best performance of each land cover category marked in bold. For this combination, the best overall accuracy is reach when k is 60 and the correspondent results are shown in Fig. 5a and Fig. 5b.
Compared with MLC, SVM is obviously less competitive to distinguish shrub and medium intensity developed area when training data is severely insufficient. This kind of combina-tion has a good improvement of the accuracy of shrub and grassland. However, the enhancement of overall accuracy from 0.441 to 0.467 is less apparent than the combination of MLC and ISODATA.
Another experiment to exterminate the performance of the proposed framework with different size of training data was also conducted. The number of clusters k in ISODATA is fixed at 60 at which this combination achieves the best performance in the previous experiment. The results are summarized in
Table V and Fig. 6. The overall accuracy is improved when percentage of training data is from 0.05% to 0.8%, which is less satisfying than the combination of MLC and ISODATA. C. Discussion
We applied two combinations in the proposed framework: MLC with ISODATA, and SVM with ISODATA. For the experiments with different number of clusters k, we all started when k is 20, which is approximate to the number of classes set by MLC and SVM. However, the two combinations are both less accurate than MLC or SVM in this situation because of the limitation of unsupervised learning. As a clustering method, ISODATA separates data merely based on their spec-tral dissimilarities in the seven optical bands used in the study. In the complex natural environment, however, different types of land cover may have similar spectral properties and the same type may reflects differently in spectral bands due to varieties of temperature and illumination. A direct application of ISODATA on our study data is thus less satisfying. The proposed framework based on object association is to achieve the combination in the decision level. It can be considered as an average results of supervised learning and unsupervised learning when the number of clusters is approximate to the number of classes. Therefore, the combination of MLC and ISODATA or SVM and ISODATA is less accurate than the original supervised approach.
(a) Results of SVM.
(b) Results of SVM + ISODATA with k=60.
Fig. 5: Thematic land cover maps
However, when the number of clusters is largely superior to the number of classes, the overall accuracy is gradually promoted with the increment of k. For the combination of MLC and ISODATA, the overall accuracy achieves the optimal value at k = 100 and gradually converges when k is closing
TABLE IV: Comparison of SVM and SVM + ISODATA in classification accuracy
Number of clusters
Accuracy of each land cover category Overall accuracy 11 12 21 22 23 24 31 41 42 43 52 71 81 82 90 95 20 0.010 0.070 0.202 0.104 0.245 0.001 0.219 0.285 0.569 0.436 0.193 0.126 0.263 0.161 0.202 0.232 0.321 40 0.014 0.011 0.056 0.046 0.562 0.007 0.274 0.243 0.661 0.270 0.126 0.584 0.268 0.149 0.112 0.084 0.445 60 0.737 0.032 0.006 0.097 0.437 0.001 0.320 0.411 0.629 0.003 0.503 0.424 0.344 0.029 0.045 0.214 0.467 80 0.756 0.187 0.026 0.092 0.491 0.006 0.351 0.406 0.668 0.373 0.335 0.427 0.278 0.073 0.058 0.328 0.457 100 0.772 0.027 0.041 0.124 0.565 0.008 0.383 0.336 0.670 0.227 0.223 0.464 0.312 0.053 0.092 0.287 0.450 200 0.739 0.025 0.015 0.153 0.545 0.001 0.339 0.342 0.665 0.262 0.214 0.447 0.347 0.014 0.149 0.299 0.448 300 0.739 0.008 0.015 0.153 0.545 0.001 0.339 0.342 0.665 0.262 0.214 0.447 0.346 0.014 0.149 0.299 0.443 400 0.681 0.010 0.033 0.169 0.649 0.002 0.368 0.331 0.684 0.401 0.232 0.422 0.331 0.113 0.125 0.312 0.450 500 0.716 0.014 0.013 0.207 0.541 0.001 0.410 0.318 0.668 0.404 0.258 0.423 0.338 0.094 0.146 0.335 0.451 SVM 0.765 0.058 0.057 0.202 0.686 0.106 0.503 0.313 0.683 0.522 0.202 0.439 0.321 0.209 0.158 0.359 0.441
TABLE V: Overall accuracy of SVM and SVM+ISODATA with different size of training samples.
Percentage in the training area 0.05% 0.1% 0.2% 0.4% 0.8% 1.2% 1.6% 2.0% 2.4% 5.0% 10.0% 20.0% 40.0% 80.0% 100.0% SVM 0.381 0.428 0.442 0.461 0.464 0.490 0.493 0.493 0.492 0.525 0.571 0.604 0.676 0.709 0.713 SVM+ISODATA 0.392 0.423 0.468 0.470 0.472 0.485 0.483 0.477 0.482 0.516 0.556 0.586 0.658 0.681 0.679
Fig. 6: Accuracy with different size of training samples
to 500. The combination of SVM and ISODATA reaches its best performance at k = 60. However, the increment of k after 60 doesn’t render more enhancement of accuracy.
A relatively large value of k in ISODATA can separate original data into multiple homogeneous clusters which thus can be considered as over-segmentation or super pixels in spectral space. In this situation, pixels in each pure cluster are gathered as an entire object whose label is associated by the proposed framework. Compared to an individual supervised approach in pixel level, the proposed framework can generate the thematic land cover maps on object level; therefore, it has an evident improvement of the overall accuracy. With the increment of k, the combination of SVM and ISODATA is less efficient than MLC and ISODATA probably because the spectral properties of land covers in our study area are more distinguishable for MLC than SVM when training data is insufficient.
With the different size of training data, the combination of MLC and ISODATA always renders better performances
than MLC alone and this improvement of accuracy is most satisfying when the training samples account for 0.2% in the training area. However, for SVM and ISODATA, the enhancement of overall accuracy only occurs when training samples are from 0.1% to 0.8 possibly because SVM is hard to find appropriate hyper planes for classification through such limited training data. Therefore, this combination is less effective than the first one in our study area.
The uncertainty and imprecision are measured through mass functions in the object association. We applied the ratio of pixels in intersection of a class siin a cluster cjto pixels in cj
as the similarity between a class and a cluster. The uncertainty thus reduces when the number of clusters increases, which explains why results become better with large k. However, when k becomes too large, the results are less competitive due to the loss of information in unsupervised learning.
VII. CONCLUSION
We proposed a novel framework to combine supervised learning and unsupervised especially focusing on the conflict situation where the number of classes is not the same as the number of clusters. It can thus be applied in large or inaccessible areas where not enough ground truth is available. The combination conducted in the framework takes merely spectral information as consideration. Therefore, in our future work, we will concentrate on enlarging this framework to combine various formats of information such as contextual information and ancillary data in the decision level to gener-ated more accurate thematic land cover maps. On the other hand, as uncertainty and imprecision take important roles in classification, the application of Dempster-Shafer theory in the fusion framework is also another promising aspect in our future work.
REFERENCES
[1] B. R. Deilmai, B. B. Ahmad, and H. Zabihi, Comparison of two classification methods (mlc and svm) to extract land use and land cover in johor malaysia, IOP Conference Series: Earth and Environmental Science, vol. 20, no. 1, p. 012052, 2014.
[2] JA. Taufik and S. S. S. Ahmad, Land cover classification of landsat 8 satellite data based on fuzzy logic approach, IOP Conference Series: Earth and Environmental Science, vol. 37, no. 1, p. 012062, 2016. [3] L. Ma, L. Cheng, M. Li, Y. Liu, and X. Ma, Training set size,
scale, and features in geographic object-based image analysis of very high resolution unmanned aerial vehicle imagery, ISPRS Journal of Photogrammetry and Remote Sensing, vol. 102, pp. 14 - 27, 2015. [4] L. Ma, T. Fu, T. Blaschke, M. Li, D. Tiede, Z. Zhou, X. Ma, and
D. Chen, Evaluation of feature selection methods for object-based land cover mapping of unmanned aerial vehicle imagery using random forest and support vector machine classifiers, ISPRS International Journal of Geo- Information, vol. 6, no. 2, 2017.
[5] J. M. Pea-Barragn, M. K. Ngugi, R. E. Plant, and J. Six, Object-based crop identification using multiple vegetation indices, textural features and crop phenology, Remote Sensing of Environment, vol. 115, no. 6, pp. 1301 - 1316, 2011.
[6] J. Sun, J. Yang, C. Zhang, W. Yun, and J. Qu, Automatic remotely sensed image classification in a grid environment based on the maximum likelihood method, Mathematical and Computer Modelling, vol. 58, no. 3, pp. 573 - 581, 2013, computer and Computing Technologies in Agriculture 2011 and Computer and Computing Technologies in Agriculture 2012.
[7] P. S. Sisodia, V. Tiwari, and A. Kumar, Analysis of supervised maximum likelihood classification for remote sensing image, in International Con-ference on Recent Advances and Innovations in Engineering (ICRAIE-2014), May 2014, pp. 1 - 4.
[8] L. Wang, W. P. Sousa, P. Gong, and G. S. Biging, Comparison of ikonos and quickbird images for mapping mangrove species on the caribbean coast of panama, Remote Sensing of Environment, vol. 91, no. 3, pp. 432 - 440, 2004.
[9] D. Wang and B. Cheng, An unsupervised classification method of remote sensing images based on ant colony optimization algorithm, in Advanced Data Mining and Applications, L. Cao, Y. Feng, and J. Zhong, Eds. Berlin, Heidelberg: Springer Berlin Heidelberg, 2010, pp. 294 - 301. [10] A. Abbas, N. Minallh, N. Ahmad, S. Abdur Rehman Abid, and M. Khan,
K-means and isodata clustering algorithms for landcover classification using remote sensing, vol. 48, pp. 315 - 318, 04 2016.
[11] B. Li, H. Zhao, and Z. Lv, Parallel isodata clustering of remote sensing images based on mapreduce, in 2010 International Conference on Cyber-Enabled Distributed Computing and Knowledge Discovery, Oct 2010, pp. 380 - 383.
[12] M. H. Ismail, H. Pakhriazad, and M. Shahrin, Evaluating supervised and unsupervised techniques for land cover mapping using remote sensing data, 01 2009.
[13] U. Markowska-Kaczmar and T. Switek, Combined unsupervisedsu-pervised classification method, in Knowledge-Based and Intelligent Information and Engineering Systems, J. D. Velasquez, S. A. Ros, R. J. Howlett, and L. C. Jain, Eds. Berlin, Heidelberg: Springer Berlin Heidelberg, 2009, pp. 861 - 868.
[14] I. Castelli and E. Trentin, Combination of supervised and unsupervised learning for training the activation functions of neural networks, Pattern Recogn. Lett., vol. 37, pp. 178 - 191, Feb. 2014.
[15] F. Karem, M. Dhibi, and A. Martin, Combination of supervised and unsupervised classification using the theory of belief functions, in Belief Functions: Theory and Applications, T. Denoeux and M.-H. Masson, Eds. Berlin, Heidelberg: Springer Berlin Heidelberg, 2012, pp. 85 - 92. [16] USGS, https://earthexplorer.usgs.gov/
[17] C. Homer, J. Dewitz, L. Yang, S. Jin, P. Danielson, G. Xian, J. Coulston, N. Herold, J. Wickham, and K. Megown, Completion of the 2011 national land cover database for the conterminous united states -representing a decade of land cover change information, vol. 81, pp. 346 - 354, 05 2015.
[18] A. P. Dempster, Upper and lower probabilities induced by a multivalued mapping, Ann. Math. Statist., vol. 38, no. 2, pp. 325 - 339, 04 1967. [19] G. Shafer, A Mathematical Theory of Evidence. Princeton: Princeton
University Press, 1976.
[20] G. J. Klir and T. A. Folger, Fuzzy Sets, Uncertainty, and Information. Upper Saddle River, NJ, USA: Prentice-Hall, Inc., 1987.
[21] T. Denoeux, Reasoning with imprecise belief structures, International Journal of Approximate Reasoning, vol. 20, no. 1, pp. 79 - 111, 1999. [22] P. Smets, The transferable belief model, Artif. Intell., vol. 66, no. 2, pp.
191 - 234, Apr. 1994.
[23] T. Denoeux, The cautious rule of combination for belief functions and some extensions, in 2006 9th International Conference on Information Fusion, July 2006, pp. 1 - 8.
[24] P. Smets, Constructing the pignistic probability function in a context of uncertainty, in Proceedings of the Fifth Annual Conference on Uncertainty in Artificial Intelligence, ser. UAI 89. Amsterdam, The Netherlands, The Netherlands: North- Holland Publishing Co., 1990, pp. 29 - 40.
[25] D. Mercier, ric Lefvre, and D. Jolly, Object association with belief functions, an application with vehicles, Information Sciences, vol. 181, no. 24, pp. 5485 - 5500, 2011.
[26] T. Denoeux, N. E. Zoghby, V. Cherfaoui, and A. Jouglet, Optimal object association in the dempster-shafer framework, IEEE Transactions on Cybernetics, vol. 44, no. 12, pp. 2521 - 2531, Dec 2014.
[27] C. Huang, L. S. Davis, and J. R. G. Townshend, An assessment of support vector machines for land cover classification, International Journal of Remote Sensing, vol. 23, no. 4, pp. 725 - 749, 2002. [28] X. Yang, Parameterizing support vector machines for land cover