Journal of Fundamental and Applied Sciences is licensed under aCreative Commons Attribution-NonCommercial 4.0 International License. Libraries Resource Directory. We are listed under Research Associations category.
A FIELD STUDY OF INDICATORS OF THE PERFORMANCE OF FOUR ABSORPTION CHILLERS IN THE SUDANO-SAHELIAN REGION OF CAMEROON
A N N Chedop1, N Djongyang1, *, R Tchinda2, A Zaatri3, J D Kana4,*
1
Department of Renewable Energy, The Higher Institute of the Sahel, University of Maroua, PO Box 46 Maroua, Cameroon
2
LISIE, Fotso Victor University Institute of Technology, University of Dschang, PO Box 136 Bandjoun, Cameroon
3
Department of Mechanical Engineering, Faculty of Engineering Science, University of Constantine 1 ; Cité Filali, Bat : F, No 2, 25000, Constantine, Algeria.
4
School of Geology and Mining Engineering, University of Maroua, PO Box 46 Maroua, Cameroon.
Received: 10 September 2015 / Accepted: 08 December 2015 / Published online: 01 January 2016
ABSTRACT
This paper presents a field study of indicators of the performance of absorption refrigerating systems in the Sudano-Sahelian region of Cameroon. A modeling of various components of the system is performed in order to choose the technology best adapted for the region. Based on the characteristics from the manufacturers, four absorption chillers were studied; namely: EAW Schüco LB 15 and 30; Rotartica Solar 045 and Sonnenklima Suninverse. The model of Kühn and Ziegler and meteorological data of the city of Maroua ((14.33 °E, 10.58 °N) were used to assess the coefficient of the performance (COP) of these machines. Results showed that the Sonnenklima Suninverse technology is best suited for the climatic conditions of the Sudano-Sahelian region with COP values between 1.5 and 3.5.
Keywords: Solar cooling; Absorption chillers; Performance indicators; Sudano-Sahelian region.
Author Correspondence, e-mail: noeldjongyang@gmail.com
doi: http://dx.doi.org/10.4314/jfas.v8i1.2
ISSN 1112-9867
1. INTRODUCTION
The study of solar cooling systems can go through a purely fundamental approach with since the beginning of last century; the average surface temperature of the Earth has increased by about 0.6 °C according to the Intergovernmental Panel on Climate Change. This temperature could increase by 1.4 to 4.5 °C by 2100 [1-3]. The signs of this warming are becoming more numerous and are manifested by melting glaciers, rising sea levels and extreme heat waves, etc. Although there are natural elements that have contributed to global warming, climate change observed over the last 50 years are likely due to human activities [2-4]. After realizing the gravity of the situation, the world community decided to take action to slow the process. One of these efforts is the Kyoto Protocol, an international treaty on global warming which took effect in 2005. This protocol is a legal agreement under which industrialized countries must reduce their emissions of greenhouse gases, calculated on an average basis over five years from 2008 to 2012 by 5% compared to 1990. The main objectives are the reduction of 8% for the EU, 7% for the US and 6% for Japan. Heating and air conditioning installations are among the most affected areas to achieve these objectives. Since more than fifteen years, the requirements of commercial buildings or occupants of homes have changed significantly. There is a demand for comfort increasingly strict especially in summer. This increased air conditioning needs induces a significant increase in electricity consumption as conventional technologies (mechanical vapor compression) used are very energy intensive. With electricity generating power limited means and operating in part with imported fossil fuels, the energy context of Sudano-Sahelian region of Cameroon is special. In this challenging energy environment, solar cooling systems are part of the interesting alternatives to conventional air conditioning systems, to the extent that the primary energy is mainly consumed as heat from the sun, so free. The other great advantage of these methods is that the refresh requirement coincides mostly with the availability of solar radiation.
The study of solar cooling systems can go through a purely fundamental approach with the development of numerical models to predict the behavior of the various system components [1-4]. Indeed, numerical simulation allows virtually investigate physical systems and effectively test the validity of the proposed solutions [5-6]. This method remains best suited
for understanding the behavior of systems in order to optimize them. Numerical simulation therefore remains on the validity of the developed models, which should translate physical phenomena with relevance to predict the best behavior of the studied systems.
The climate of the Sudano-Sahelian regions is characterized by a higher evaporation to precipitation and an average annual temperature above 28 ° C. The long dry season and high temperatures encountered in its desert or semi – desert, led to a high use of air conditioners, fans, refrigerators and cold storage while causing a high peak power consumption and failure in the distribution of electricity. With this, it is then important to ask, how can the peak power consumption by a solar cold production method to reduce the cost of consumer users.
The main objective of this work is to choose an absorption chiller most prevalent among those that can be adapted to the climatic conditions of the Sudano Sahelian region of Cameroon. The first part presents the complete modeling of the various components of the solar absorption cooling plant, then in the second part, is detailed features of four examples of absorption chillers including: EAW Schüco LB 15 and 30; Rotartica the Solar 045 and Sonnenklima Suninverse. Finally in the last part we present the evolution of indicators of the performance parameters in terms of power and COP according to the climatic data of the study area.
2. STUDY AREA
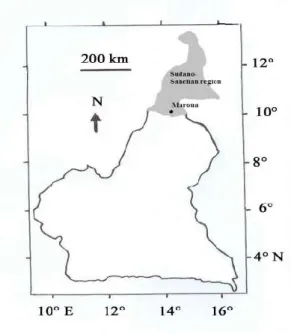
Cameroon is situated between latitude of 2°N to 13°N, longitude of 9°E to 17°E and covers a land area of about 475 442 km² (figure 1).
The current study was carried-out in Maroua (14.33°E, 10.58°N), situated at an altitude of 394 m above sea level. The average temperature is 27.7 °C, while the average insolation is 5.70 kWh/m²/day. The wind speeds are up to 3.8 m/s on average, with peaks around 4.6 m/s.
Fig.1. Study area
Table 1 presents the monthly average insolation in Maroua (2000 to 2010; approximately a solar cycle), while figure 2 shows the evolution of the mean monthly outdoor temperatures recorded during the study period.
Table 1. Mean monthly insolation in Maroua from 2000 to 2010 (Source: Meteorological Service of the Airport of Maroua-Salak)
Months Jan Feb Mar Apr May Jun Jul Aug Sep Oct Nov Dec Average
Insolation 5.61 6.24 6.56 6.31 5.96 5.50 5.03 4.85 5.34 5.70 5.85 5.56 5.70
From the above it could be seen that the Sudano-Sahelian region of Cameroon is particularly favorable for solar refrigeration system coupled to the Absorption chiller.
0 2 4 6 8 10 12 14 16 18 20 22 24 18 20 22 24 26 28 30 32 34 36 38 40 42 44 August June May March April July January February September December October November T em perat ure (°C) Time (Hours)
Fig.2. Mean hourly variation of outdoor temperature for the year 2012 in Maroua
3. MATERIAL AND METHODS
The studied system is made of several elements connected to each other via pairs of input/output water devices. Each element interacts with the elements to which it is connected and possibly with the environment or the building and its occupants [7-9]. The principle of the solar cooling installation diagram is shown in Figure 3.
Fig.3. Schematic diagram of a solar cooling plant; 1. Solar collectors field; 2. Hot water tank; 3. Absorption chiller;4. Cold water tank; 5. Cooling tower; 6. Building
The heat generated by the solar collector field (1) is stored in the hot water tank (2) before powering the generator of the absorption machine (3). The cold water produced at the evaporator of the absorption machine is stored in the cold water tank (4) before being
distributed in the building to be cooled (6). Finally, the absorber and the condenser of the absorption machine are cooled by the cooling tower (5).
3.1 Modeling the absorption machine
- The method of Kühn and Ziegler
The modeling of absorption chillers developed by Ziegler et al. [8-9] has several advantages: • It determines quickly the expected performance of the machine depending on the external operating temperatures,
• It allows the development of simple and accurate digital models of the machine characterized and easily integrated in a simulation environment (eg. TRNSYS).
• It does not require knowledge of the thermodynamic properties of the working fluid, • It is accessible without prior knowledge of the principle of absorption cycle.
A single effect absorption machine can be seen as consisting of four interchanges: the desorber, absorber, condenser and evaporator, as one can see in Figure 4.
Fig.4. Single effect absorption cycle
These exchangers are governed by heat and mass transfer theory that can be expressed as a function of temperature by the following equation [11-12]:
Q US T (1)
Where US is the overall exchange coefficient brought to the surface per unit time (W/K) and T represents the operating temperature range which can be expressed by the difference between the average internal (T) and external (t) temperatures[8-9].
T T t
(2) Based on equations (1) and (2), it is possible to write the respective energy balances of each component of the absorption machine by equations (3), (4), (5) and (6) [11].
evap evap evap evap
Q US t T (3)
cond cond cond cond
Q US t T (4)
abs abs abs abs
Q US t T (5)
desorb desorb desorb desorb
Q US t T (6)
Thanks to Dühring diagram and arithmetic internal temperatures T, it is possible to write the following relationship considering that the solution is an absorbent [11]:
TdesorbTabs
R
Tcond Tevap
(7) where R is a constant representing the difference between the slope of the vapor pressure of the representative line of the solution and that of pure water. For the couple water and lithiumbromide (H2O/LiBr), R is 1.1 in the case of a single acting machine.
Using the first law of thermodynamics, as well as combining equations (2) and (7), we have the following equations:
desorb abs
cond evap
t T T R T T
(8)
desorb abs
cond evap
t t t R t t
(9)
With machines using a complex cycles system than those with a simple effect Ziegler et al. [1], one defines the extensions of temperatures characteristic for seven different cycles.
Kühn and Ziegler [8] studied from the method of Ziegler et al. [9] the relevance of correlations
by applying them to an absorption chiller of 10 kW, operating torque H20/LiBr by plotting the
relation:
evap
Q f t (10)
The results can be correlated by the following relationship:
1 evap
Q Ct (11)
But the authors note a deviation at the beginning and end of the ΔΔt zone. To correct this deviation, the authors defined a characteristic function of arbitrary temperatures ΔΔt' which is expressed in the form of equation (12), and the linear expression of the cooling capacity.
2 / 3 out
' desorb enter .abs cond enter .evap
t t C t C t
(12)
4. ' 5 4. 4 2. / enter 4 3. out 5
evap desorb enter abs cond evap
Q C t C C t C C t C C t C (13) Thanks to the experimental results, it is possible to realize a digital sintering to define the
values of the coefficients C of the equations (12) and (13). The results thus obtained are shown in Table 2.
Table 2. Values of the coefficients of the equations (12) and (13), Kühn and Ziegler [8-9]
Type of absorption Chillers C2 C3 Evaporator Desorber R2 evap Q R2 desorb Q C4 C5 C4’ C5’ ROTARTICA 2.2 1.5 0.218 -1.832 0.277 -0.037 0.986 0.986 SONNENKLIMA (P) 2.9 2.4 0.259 0.977 0.285 3.906 0.984 0.987 SONNENKLIMA (V) 2.7 2.5 0.222 -0.493 0.250 2.400 0.980 0.953 EAW SCHÜCO LB15 2.51 1.9 0.467 0.926 0.570 6.778 0.980 0.980 EAW SCHÜCO LB30 0.1 1.1 0.216 0.835 1.031 -56.181 0.901 0.940 3.2 Performance indicators
In order to study and analyze a solar cooling absorption plant, performance indicators were defined. These parameters reflect the effectiveness of the various exchanges of thermal and mechanical energy that take place within the system.
Definitions of different thermal energies involve:
Qsol the incident solar energy in terms of sensors,
Qcapt the energy captured by the collector field,
Qabs/cond theenergy released by all absorber / condenser
Qevap the refrigerating energy generated by the evaporator of the absorption machine.
Definitions of the various electric energy consumed by the system involve:
Wp the electrical energy consumed by the pump of the desorber system,
Welec the electricity consumed without total distribution.
Thanks to these various energies, it is possible to define performance indicators for this type of installation.
The collector array performance is given by the relation [11-12]: capt Qcapt Qsol
(14) This indicator assesses the collector array's ability to convert sunlight into heat energy. The thermal coefficient of performance of the absorption machine is:
th evap desorb
COP Q Q (15) This is the factor used by the manufacturer to assess the performance of his machine. Its value is 0.62 in the nominal operating conditions of temperature and flow rate. It depends to the manufacturer.
The net solar coefficient of performance is [11-12]:
sol evap sol
COP Q Q (16)
This indicator is more appropriate to carry out a performance comparison between different solar cooling systems (drying, adsorption or absorption) since it involves only the incident solar energy and that produced. The electrical performance factor of production is:
elec evap elec
4. MAIN FEATURES OF THE STUDIED ABSORPTION CHILLERS
Four types of absorption chillers are studied. The characteristics of each are presented in Tab. 3. Table 3. Summary of the main characteristics of the machines studied [11].
Model ROTARTICA Solar 045 SONNENKLIMA SUNINVERSE EAW SCHÜCO LB 15 EAW SCHÜCO LB 30
Type Drum rotary Classical Classical Classical
Couple Water / LiBr Water / LiBr Water / LiBr Wter / LiBr
Power / COPth 4.5 kW / 0.6 10kW / 0.78 15 kW / 0.75 30kW / 0.75 Temperature Range Input desorber 70-108°C 55-95°C 70-110°C 70-95°C Input abs/cond 30-45°C 27-36°C 25-40°C 25-40°C Output evaporator 7-20°C > 6°C > 6°C > 6°C Nominal flows Desorber 900 L/h 1200 L/h 2000 L/h 3600 L/h Absorber/condenser 1980 L/h 2600 L/h 5000 L/h 10700 L/h Evaporator 1560 L/h 2900 L/h 1900 L/h 4200 L/h
Thanks to the various tests performed on these machines, an identification method of their characteristic parameters has been developed. Table 4 recalls the values identified for each machine [11].
Table 4. Summary of identified dimensional parameters.
Machine
evap
US USdesorb USabs UScond d Efficiency
[W/K] [W/K] [W/K] [W/K] [L/S] - ROTARTICA Solar 045 4330 1740 1200 2300 0.0773 67.6% SONNENKLIMA 4260 1950 1980 3650 0.066 46% EAW SCHÜCO LB15 4960 4370 5990 4660 0.1259 55% EAW SCHÜCO LB30 5850 6650 9940 4320 0.2086 57.4%
5. RESULTS AND DISCUSSION
The model of Kühn and Ziegler [8-9] has been applied to various characteristics of four
absorption machines to assess their performance. The coefficient of performance (COPth) and
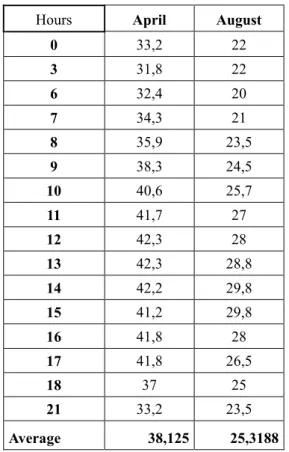
power (Q) have been calculated using data of the year 2012. We considered two months (the hottest month (April) and the cooler month (August) as presented in table 5.
Table 5. Evolution temperatures (in C) of April and August in the town of Maroua in 2012
Hours April August
0 33,2 22 3 31,8 22 6 32,4 20 7 34,3 21 8 35,9 23,5 9 38,3 24,5 10 40,6 25,7 11 41,7 27 12 42,3 28 13 42,3 28,8 14 42,2 29,8 15 41,2 29,8 16 41,8 28 17 41,8 26,5 18 37 25 21 33,2 23,5 Average 38,125 25,3188 5.1 EAW Schüco LB 30
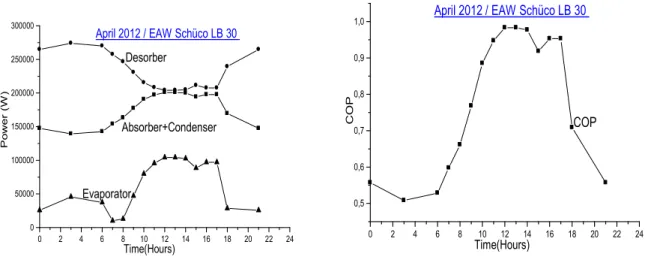
In the case of EAW Schüco LB 30 machine, we varied temperatures in order to have a range from 73 °C to 84 °C for the desorber input, from 27 °C to 29 °C for the absorber / condenser input and from 8.7 °C to 10.4 °C for the evaporator output. Figure 5 shows the variation of refrigeration coefficient of performance and power for the machine EAW Schüco LB 30 respectively at the desorber, absorber + condenser and evaporator according to the time for the month of Avril. One can see that the power input of the desorber is greater than the powers respectively observed in the condenser + absorber and evaporator. This allows to have a coefficient of cooling performance (COP) between 0.51 and 0.98; with peaks obtained between 12h and 14h. From the values numerically and experimentally obtained by (William A, 2011), one can conclude that the characteristics of the absorption machine EAW Schüco LB 30 are not adaptable to April in the city of Maroua due to low COP values.
0 2 4 6 8 10 12 14 16 18 20 22 24 0 50000 100000 150000 200000 250000 300000
April 2012 / EAW Schüco LB 30
Evaporator Absorber+Condenser Desorber Po w er ( W ) Time(Hours)
Fig.5. Evolution of the power and the COP of EAW Schüco LB 30’S machine for the month of April 2012
Figure 6 shows the evolution of the power and the COP of the machine EAW Schüco LB 30 during the worst month of sunshine. One can note that the power values obtained in during this month is very low compared to those obtained previously in the month of April, leading to a drop in COP ranging from 0.19 to 0.45. We can therefore conclude that the evolution of the COP of an absorption machine depends on the sunshine of the site locality: it is weak to unfavorable month (August) and high for favorable sunshine month (April).
0 2 4 6 8 10 12 14 16 18 20 22 24 50000 100000 150000 200000 250000 300000 350000
August 2012 / EAW Schüco LB 30
Evaporator Absorber+Condenser Desorber Po we r (W ) Time (Hours) 0 2 4 6 8 10 12 14 16 18 20 22 24 0,20 0,25 0,30 0,35 0,40 0,45
August 2012 / EAW Schüco LB 30
COP
C
O
P
Time(Hours)
Fig.6. Evolution of the power and the COP of EAW Schüco LB 30’S machine for the month of August 2012 0 2 4 6 8 10 12 14 16 18 20 22 24 0,5 0,6 0,7 0,8 0,9
1,0 April 2012 / EAW Schüco LB 30
COP
C
OP
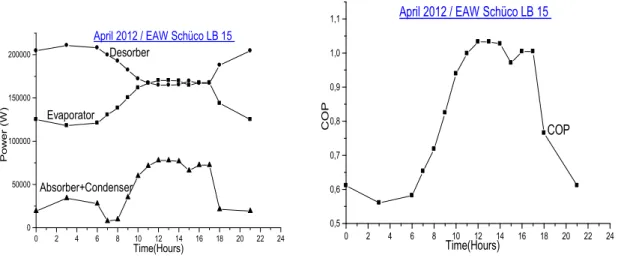
5.2 EAW Schüco LB 15
In the case of EAW Schüco LB 15 machine, we varied temperatures in order to have a range from 70 °C to 90 °C for the desorber input, from 25 °C to 35 °C for the absorber / condenser input and from 6 °C to 11 °C for the evaporator output. Figure 7 shows the evolution of cooling performance and power coefficient for the machine EAW Schüco LB 15, depending on the time of day for the month of April.
0 2 4 6 8 10 12 14 16 18 20 22 24 0 50000 100000 150000 200000
April 2012 / EAW Schüco LB 15
Absorber+Condenser Desorber Evaporator P o w er ( W ) Time(Hours) 0 2 4 6 8 10 12 14 16 18 20 22 24 0,5 0,6 0,7 0,8 0,9 1,0
1,1 April 2012 / EAW Schüco LB 15
COP
C
OP
Time(Hours)
Fig.7. Evolution of the power and the COP of EAW Schüco LB 15’S machine for the month of April 2012
We note that, unlike the machine EAW Schüco LB 30 the power input of the desorber is less than or equal to that at the entrance of the evaporator between 11h and 17h. Which allows having a coefficient of cooling performance (COP) between 0.55 and 1.05; with peaks also obtained between 12h and 14h. We can conclude that the characteristics of the absorption machine EAW Schüco LB 15 are more favorable than those of the machine EAW Schüco LB 30 to April in the city of Maroua.
Figure 8 shows the evolution of the power and the COP of the machine EAW Schüco LB 15 for the month of August. We also note that the values of the powers obtained this month are very low compared to those obtained in the month of April, which led to a fall in the COP, ranging between 0.23 and 0.49 and we can also say that sunlight plays a very important role in the performance of absorption chillers because more sunlight is high, are better indicators of performance parameters.
0 2 4 6 8 10 12 14 16 18 20 22 24 50000 100000 150000 200000 250000
August 2012 / EAW Schüco LB 15
Evaporator Absorber+Condenser Desorber P ow e r (W ) Time(Hours) 0 2 4 6 8 10 12 14 16 18 20 22 24 0,20 0,25 0,30 0,35 0,40 0,45
0,50 August 2012 / EAW Schüco LB 15
COP
COP
Time(Hours)
Fig.8. Evolution of the power and the COP of EAW Schüco LB 15’S machine for the month of August 2012
5.3. Sonnenklima Suninverse
In the case of Sonnenklima Suninverse machine, we varied temperatures in order to have a range from 55°C to 93°C for the desorber input, from 27 °C to 36 °C for the absorber / condenser input and from 6 °C to 11 °C for the evaporator output. Figure 9 shows the evolution of cooling performance and power coefficient for the machine Sonnenklima Suninverse, depending on the time for the month of April.
0 2 4 6 8 10 12 14 16 18 20 22 24 0 10000 20000 30000 40000 50000 60000 70000 80000 90000 100000 110000 120000 130000 140000
150000 April 2012 / Sonnenklima SUNINVERSE
Desorber Absorber+Condenser Evap orat or Pow er (W ) Time(Hours) 0 2 4 6 8 10 12 14 16 18 20 22 24 1,4 1,6 1,8 2,0 2,2 2,4 2,6 2,8 3,0 3,2
3,4 April 2012 / Sonnenklima SUNINVERSE
COP
COP
Time(Hours)
Fig.9. Evolution of the power and the COP of Sonnenklima SUNINVERSE’S machine for the month of April 2012
We note that, contrary to the EAW Schüco LB 30 and 15 machines, the power input of the desorber is less than that at the inlet of the evaporator during the day, and the power to the condenser inlet absorber + is greater than that of the desorber between 11h and 14h, which allows to have a cooling coefficient of performance (COP) of greater than 1 between 1.5 and 3.5; with peaks also obtained between 12h and 14h, we can conclude that the characteristics of the absorption machine Sonnenklima SUNINVERSE are more favorable than those of the machine EAW Schüco LB 30 and 15 in the month of April in the city of Maroua, because has the best beaches in COP.
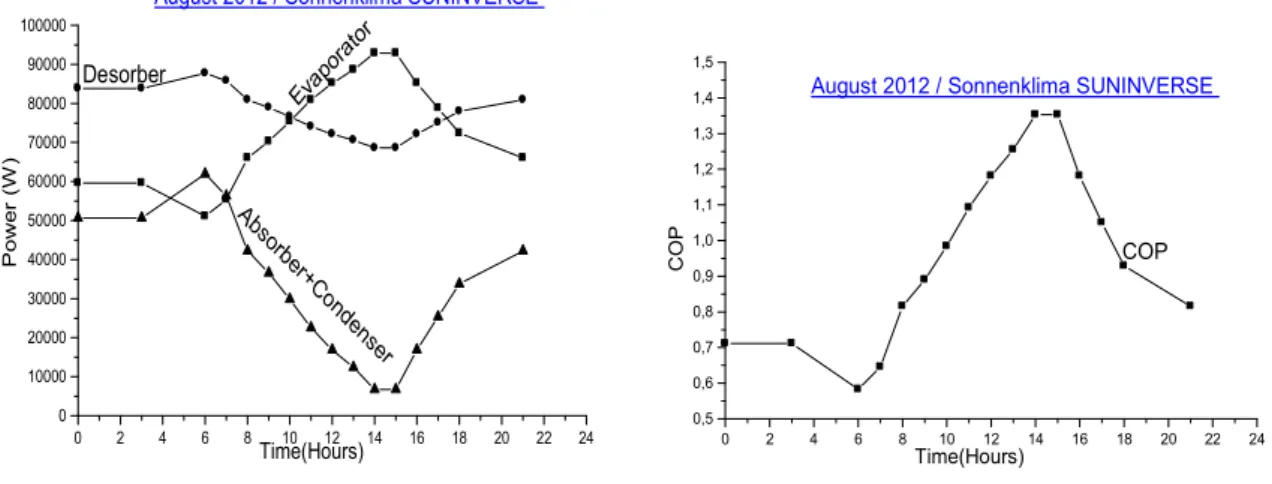
Figure 10 shows the evolution of the power and the COP of the machine Sonnenklima SUNINVERSE for the month of August. We find that the values of the powers of this month obtained court are low compared to those obtained in the month of April, however it is important to note that the coefficient of performance (COP) drops but retains values above 1 between 11h and 16h, which is very interesting for this August where climatic conditions are unfavorable regularly in the city of Maroua, this shows the effectiveness of this machine in this city compared to machines EAW Schüco LB 30 and 15.
0 2 4 6 8 10 12 14 16 18 20 22 24 0 10000 20000 30000 40000 50000 60000 70000 80000 90000 100000
August 2012 / Sonnenklima SUNINVERSE
Ab sorb er+C on de nser Desorber Evap orat or Pow e r (W ) Time(Hours) 0 2 4 6 8 10 12 14 16 18 20 22 24 0,5 0,6 0,7 0,8 0,9 1,0 1,1 1,2 1,3 1,4 1,5
August 2012 / Sonnenklima SUNINVERSE
COP
COP
Time(Hours)
Fig.10. Evolution of the power and the COP of Sonnenklima SUNINVERSE’S machine for the month of August 2012
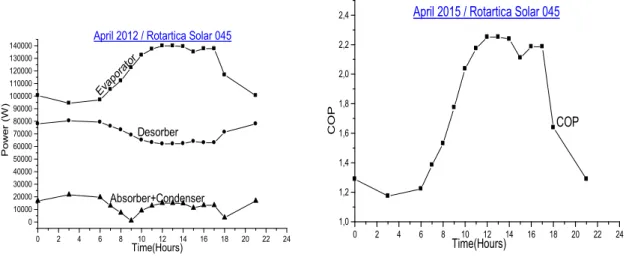
5.4 Rotartica Solar 045
In the case of Rotartica Solar 045 machine, we varied temperatures in order to have a range from 80°C to 100°C for the desorber input, from 35 °C to 40 °C for the absorber / condenser
input and from 7 °C to 15 °C for the evaporator output. Figure 11 shows the development of refrigeration coefficient of performance and power for the machine Rotartica Solar 045, depending on the time of day for the month of April. We find that the power input of the desorber is also lower than that at the inlet of the evaporator during the day, and the power to the condenser inlet + absorber is well below that of the desorber and the evaporator. The refrigeration coefficient of performance (COP) of this machine is greater than 1, it is between 1.17 and 2.3; with peaks also obtained between 12h and 14h, we can conclude that the characteristics of the 045 Rotartica Solar absorption machine are slightly more favorable than those of machines EAW Schüco LB 30 and 15, but less than that of the month of April in the city of Maroua. We also find that the best machine performance indicators are observed during periods of the day when the sun is high (11h - 14h).
0 2 4 6 8 10 12 14 16 18 20 22 24 0 10000 20000 30000 40000 50000 60000 70000 80000 90000 100000 110000 120000 130000
140000 April 2012 / Rotartica Solar 045
Absorber+Condenser Desorber Eva pora tor Po w e r (W ) Time(Hours) 0 2 4 6 8 10 12 14 16 18 20 22 24 1,0 1,2 1,4 1,6 1,8 2,0 2,2
2,4 April 2015 / Rotartica Solar 045
COP
C
OP
Time(Hours)
Fig.11. Evolution of the power and the COP of Rotartica Solar 045’S machine for the month of April 2012
Figure 12 shows the evolution of the power and the COP of the machine for the month of August. We note again that the values of the powers of this month obtained court are low compared to those obtained in the month of April, the coefficient of performance (COP) fall but also keeps values above 1 between 14h and 16h, it which is very interesting for the month of August which are regularly unfavorable climatic conditions in the city of Maroua. We can conclude that the characteristics of the 045 Rotartica Solar absorption machine can be adapted in the town of Maroua.
0 2 4 6 8 10 12 14 16 18 20 22 24 30000 40000 50000 60000 70000 80000 90000 100000
August 2012 / Rotartica Solar 045
Absorber+Condenser Desorber Evap ora tor P ow er (W ) Time(Hours) 0 2 4 6 8 10 12 14 16 18 20 22 24 0,4 0,5 0,6 0,7 0,8 0,9 1,0
1,1 August 2012 / Rotartica Solar 045
COP
C
O
P
Time(Hours)
Fig.12. Evolution of the power and the COP of Rotartica Solar 045’S machine for the month of August 2012
5. CONCLUSION AND RECOMMENDATION
In this paper, we have done in the first instance a complete modeling of absorption chillers for air conditioning of a room. Then we introduced four machines for domestic single effect absorption. Various features have been identified on each of them. First, in technology with a classic design for Sonnenklima EAW and Schüco machines and innovative design using a rotating drum for Rotartica. Each of these machines has more or less different operating conditions, that is to say in terms of light-off temperature, but also minimum and maximum tolerated. Finally we used the Kühn & Ziegler method to study the behavior of indicators of machine performance parameters including the refrigeration coefficient of performance (COP) and the power of the months of April and August 2012 in the town of Maroua in Cameroon. From the results we have obtained, the Sonnenklima machine offers the best returns relative to EAW Schüco and Rotartica machines with a COP of 1.5 to 3.5. The Rotartica the second best performance with a COP of between 1.17 and 2.3 and finally come EAW Schüco 15 and 30. Compared to the work of (William A, 2011) at the University of Pau in France, where the best performances were given by the machine EAW Schüco 15, rather we obtained the best performance with the Sonnenklima machine in weather conditions in Sudan-Sahelian regions of Cameroon. We can therefore conclude that the temperature and climate play an important role in the behavior of absorption machines at the plant efficiency. In the continuation of our
work we will perform modeling of the space to cool and make the overall system simulations using the Sonnenklima absorption machine that has the most favorable performance for our study area and using the software TRNSYS.
6. ACKNOWLEDGEMENTS
Authors are grateful to the Meteorological service of the airport of Maroua-Salak for providing them with data necessary to the realization of this work.
7. REFERENCES
[1] Atmaca, I., A. Yigit (2003). Simulation of solar-powered absorption cooling system. Renewable Energy 28(8): 1277-1293.
[2] Gibout, S., J. Castaing-Lasvignottes, et al. (2005). Modélisation en régime variable d’une machine frigorifique à absorption pour une application solaire." Revue Générale du Froid 1058.
[3] Castaing-Lasvignottes, J., O. Marc, et al. (2008). Modélisation et simulation dynamique
d’une machine frigorifique à absorption H2O/LiBr: Application Solaire. COFRET.
Nantes.
[4] Grossman, G. (2002). "Solar-powered systems for cooling, dehumidification and air conditioning." Solar Energy 72 (1).
[5] Castro, J., A. Oliva, et al. (2008). "Modelling of the heat exchangers of a small capacity,
hot water driven, air-cooled H2O–LiBr absorption cooling machine." International
Journal of Refrigeration 31(1).
[6] Hammad, M., S. Habali (2000). "Design and performance study of a solar energy powered vaccine cabinet." Applied Thermal Engineering 20: 1785-1798.
[7] Florides, G. A., S. A. Kalogirou, et al. (2003). "Design and construction of a LiBr–water absorption machine." Energy Conversion and Management 44: 2483–2508.
[8] Kühn A., Ziegler F., Operational results of a 10 kW absorption chiller and adaptation of the characteristic equation, In: Proc. First Int. Conference Solar Air Conditioning, Bad-Staffelstein, 2005.
[9] Ziegler F., Hellmann H.M., Schweigler C., an approximative method for modeling the operating characteristics of advanced absorption chillers, 20th International Congress of Refrigeration, IIR/IIF, Sydney, 1999.
[10] Ngueche Chedop A. N., Djongyang N. and Zaatri A. (2014). ‘’Modelling of the performance of a solar electric-vapor compression refrigeration system in dry tropical regions’’. International Journal of Science and Research 3 (11) 1066 – 1076.
[11] Marc, O. (2010). Etude expérimentale, modélisation et optimisation d'un procédé de rafraîchissement solaire à absorption couplé au bâtiment. Université de La Réunion. PhD. [12] Anies, G. (2011). Modélisation, simulation dynamique, validation expérimentale et
optimisation énergétique d’une unité de rafraîchissement solaire par absorption. Université de Pau et des Pays de l’Adour. PhD.
[13] Kapseu C, Djongyang N, George, Petsoko ENM et Daniel Egbe AM. Energies renouvelables en Afrique subsaharienne’’, Harmattan, 2012.
[14] Djongyang N, Tchinda R, Njomo D. Estimation of some comfort parameters for sleeping environments in dry-tropical sub-Saharan Africa region. Energy Conversion and Management, (2012), 58, 110-119.
[15] Castaing-Lasvignottes J., Belhani M., Strub F., Gibout S., Alaphilippe M., Modelisation and experimental validation of the unsteady behaviour of a liquid absorption refrigeration machine, Application to solar external conditions, HPC 2004 3rd International Conference on heat powered cycles Larnaca-Cyprus, 11-13 October 2004.
[16] Rotartica Solar 045, Linea solar termica, manual de instalacion y mantenimiento, v.MI080530sc.
[17] Chatagnon N., Bachmann M., Caractérisation technique de la machine à absorption solaire Rotartica en régime dynamique– Phase 2, annexe - Projet ABCLIMSOL WP1, 2 octobre 2009.
[18] Jobard X., Développement d'une méthode d'essai dynamique semi-virtuelle pour caractériser les systèmes de climatisation/chauffage solaire, Septembre 2011.
[19] Boudéhenn F., Albaric M., AbClimSol : Définition des protocoles d’essais en dynamique sur banc d’essais thermiques des machines à absorption,
[20] Albaric M., Anies G., Benabdelmoumene N., Boudehenn F., Castaing-Lasvignottes J., Chatagnon N., Deque F., Ghiaus C., Jabbour N., Heintz J., Papillon P. Mémoire. ABCLIM-SOL, Projet/ANR-07-PBAT-001-01.
[21] Suninverse S., Climatiseur par absorption 10 kW, caractéristiques techniques (modèles de démonstration).
[22] Benabdelmoumene N., Rapport essais de la machine Phoenix Sonnenklima en régime statique, Août 2009.
[23] Boudéhenn F., Projet AbClimSol, Rapport de tests en régime dynamique des machines à absorption EAW et Sonnenklima avec détail du protocole, Rapport technique DTS/DR/2010/031.
[24] Schüco, Systèmes solaires, machine frigorifique à absorption Schüco LB15 et LB30, notice de montage et d'utilisation, version 02, edition 08/2007, No d'article 249 543. [25] Anies G., Chatagnon N., Deque F., Stouffs P., Castaing-Lasvignottes J., Study of a
domestic absorption chiller. Part 1: experimental results, soumis à Energy Conversion and Management en Août 2011,
[26] Anies G., Chatagnon N., Deque F., Stouffs P., Castaing-Lasvignottes J., Study of a domestic absorption chiller. Part 2: numerical modeling, soumis à Energy Conversion and Management en Août 2011.
[27] Marc, O., G. Danet, et al. (2010c). Modélisation et éléments de validation expérimentale d'une installation de rafraîchissement solaire couplée au bâtiment sous l’environnement EnergyPlus. IBPSA Moret-sur-Loing, France.
[28] Marc, O., F. Lucas, et al. (2008a). Modélisation simplifiée et éléments de validation expérimentale d’une installation de rafraîchissement solaire par absorption en climat tropical. IBPSA Lyon, France.
[29] Lucas, F. (2001). Développement et validation de modèles thermo-hydriques dans les bâtiments ; Influence de la condensation et des systèmes de traitement d'air couplés aux bâtiments. Université de La Réunion. PhD.
How to cite this article:
Chedop ANN, Djongyang N, Tchinda R, Zaatri A, Kana JD. A field study of indicators of the performance of four absorption chillers in the sudano-sahelian region of Cameroon. J. Fundam. Appl. Sci., 2016, 8(1), 20-40.
![Table 2. Values of the coefficients of the equations (12) and (13), Kühn and Ziegler [8-9]](https://thumb-eu.123doks.com/thumbv2/123doknet/11615411.303682/8.892.89.799.619.834/table-values-coefficients-equations-kühn-ziegler.webp)
![Table 3. Summary of the main characteristics of the machines studied [11].](https://thumb-eu.123doks.com/thumbv2/123doknet/11615411.303682/10.892.112.788.226.577/table-summary-main-characteristics-machines-studied.webp)