HAL Id: hal-01082869
https://hal-mines-paristech.archives-ouvertes.fr/hal-01082869
Submitted on 14 Nov 2014
HAL is a multi-disciplinary open access
archive for the deposit and dissemination of
sci-entific research documents, whether they are
pub-lished or not. The documents may come from
teaching and research institutions in France or
abroad, or from public or private research centers.
L’archive ouverte pluridisciplinaire HAL, est
destinée au dépôt et à la diffusion de documents
scientifiques de niveau recherche, publiés ou non,
émanant des établissements d’enseignement et de
recherche français ou étrangers, des laboratoires
publics ou privés.
Multimedia data mining for automatic diabetic
retinopathy screening
Gwénolé Quellec, Mathieu Lamard, Béatrice Cochener, Etienne Decencière,
Bruno Lay, Agnès Chabouis, Christian Roux, Guy Cazuguel
To cite this version:
Gwénolé Quellec, Mathieu Lamard, Béatrice Cochener, Etienne Decencière, Bruno Lay, et al..
Mul-timedia data mining for automatic diabetic retinopathy screening. Engineering in Medicine and
Bi-ology Society (EMBC), Jul 2013, Osaka, Japan. pp.7144 - 7147, �10.1109/EMBC.2013.6611205�.
�hal-01082869�
Multimedia Data Mining for Automatic Diabetic Retinopathy Screening
Gw´enol´e Quellec, Mathieu Lamard, B´eatrice Cochener, Etienne Decenci`ere,
Bruno Lay, Agn`es Chabouis, Christian Roux, Guy Cazuguel
Abstract— This paper presents TeleOphta, an automatic sys-tem for screening diabetic retinopathy in teleophthalmology networks. Its goal is to reduce the burden on ophthalmologists by automatically detecting non referable examination records, i.e. examination records presenting no image quality problems and no pathological signs related to diabetic retinopathy or any other retinal pathology. TeleOphta is an attempt to put into practice years of algorithmic developments from our groups. It combines image quality metrics, specific lesion detectors and a generic pathological pattern miner to process the visual content of eye fundus photographs. This visual information is further combined with contextual data in order to compute an abnormality risk for each examination record. The TeleOphta system was trained and tested on a large dataset of 25,702 examination records from the OPHDIAT screening network in Paris. It was able to automatically detect 68% of the non referable examination records while achieving the same sensitivity as a second ophthalmologist. This suggests that it could safely reduce the burden on ophthalmologists by 56%.
I. INTRODUCTION
Retinal pathologies are the main cause of vision impair-ment. The early detection of these pathologies helps stopping or slowing down their progress and increases the chances of healing. In order to achieve early detection, systematic mass screening is necessary. Telemedical networks are emerging as one of the main tools to reach this objective. In par-ticular, many networks are devoted to the early detection of Diabetic Retinopathy (DR), a complication of diabetes mellitus [1], [2], [3], [4]. However, the decreasing number of ophthalmologists and the increasing incidence of diabetes [5] limits the development of these networks. A tool able to automatically detect healthy cases would reduce the burden on ophthalmologists and therefore foster the development of teleophthalmology networks. This is the objective of TeleOphta.
TeleOphta is a project funded by the French National Research Agency since 2009. It relies on retinal image
G. Quellec, M. Lamard, B. Cochener, C. Roux and G. Cazuguel are with Inserm, UMR 1101, Brest, F-29200 France
G. Quellec is with ARTORG Center for Biomedical Engineering Re-search, University of Bern, Bern, CH-3010 Switzerland
M. Lamard and B. Cochener are with Univ Bretagne Occidentale, Brest, F-29200 France
B. Cochener is with CHRU Brest, Service d’Ophtalmologie, Brest, F-29200 France
E. Decenci`ere is with Centre for Mathematical Morphology, Systems and Mathematics Department, MINES ParisTech, Fontainebleau, F-77300 France
B. Lay is with ADCIS, Saint-Contest, F-14280 France
A. Chabouis is with Hˆopital Lariboisi`ere - APHP, Service d’Ophtalmologie, Paris, F-75475 France
C. Roux and G. Cazuguel are with Institut Mines-Telecom; Telecom Bretagne; UEB; Dpt ITI, Brest, F-29200 France
processing and data mining methodologies developed in the past few years by the Centre for Mathematical Morphology [6], [7], [8], in Paris, and by the LaTIM Laboratory [9], [10], [11], [12], in Brest, France. The project benefits from a large amount of data collected in the OPHDIAT telemedical net-work for diabetic retinopathy screening [3]. It resulted into a system able to automatically classify an examination record, acquired in the OPHDIAT network, as ”non referable” or ”to be referred to a specialist”.
II. CLINICAL APPLICATION - CHALLENGES AND PROPOSED STRATEGY
The development of image processing methods for the analysis of eye fundus photographs has been very active in the last 15 years [13], [14]. The first studies involved rela-tively small and homogeneous databases. However, teleoph-thalmology networks involve tens of screening centers (29 centers in OPHDIAT). It implies that several image charac-teristics, such as quality, size or lighting conditions change greatly from one examination to another. Besides, the number of images per examination record also varies greatly (from 1 to 19 in OPHDIAT). In order to bridge the gap between academic solutions and clinical applications, image analysis algorithms should be able to deal with these heterogeneities. Retinal experts do not rely exclusively on fundus pho-tographs to make a referral decision. They also take contex-tual information into account: the patient’s age, the patient’s diabetes history, whether or not the patient is pregnant, etc. In fact, experts cannot reliably produce referral decisions without contextual information. Similarly, to produce reliable referral decisions, automatic systems must take contextual in-formation into account. This was the second major challenge the project had to face.
Another challenge is the variety of retinal pathologies in DR screening centers. An automatic system that can only detect DR, even perfectly, cannot be used reliably in a screening network: ophthalmologists won’t trust a system that misses patients with a retinal pathology, even if this is not the target pathology.
In TeleOphta, lesion detectors and image quality metrics are combined with image mining and heterogeneous data mining algorithms in order to overcome these three chal-lenges. The overall system was trained, in a very large screening dataset provided by the OPHDIAT network, to reliably reproduce the referral decision process of retinal experts. The system is summarized in Fig. 1.
35th Annual International Conference of the IEEE EMBS Osaka, Japan, 3 - 7 July, 2013
Fig. 1: Outline of the TeleOphta system
III. LESION DETECTION
Microaneurysms (MA) and exudates (EX) are usually the first signs of DR in eye fundus photographs [13]. So their detection is of primary importance. Algorithms developed by both research groups in the past few years were improved to increase their robustness. These improvements were assisted by larger and more heterogeneous datasets of manually segmented images (see section VI).
A. Microaneurysm Detection
Two MA detectors are used in TeleOphta: the first one is based on mathematical morphology [8], the second is based on template matching in wavelet spaces [9]. New efforts were mostly directed towards the first detector [15]: in particular, the feature extraction and classification steps were improved. In the new version, MA candidates are obtained with an alternate sequential filter that extracts small structures. Then, local, geometrical and contextual features are extracted from each candidate. Finally, a pathological probability is assigned to each candidate by a random forest classifier [16] trained on a large manually annotated dataset (see section VI). B. Exudate Detection
The robustness of our previous EX detector [7] was also improved [17]. As a preprocessing step, the improved detec-tor searches for structures that can be erroneously considered as exudates: the optic disk, hazes at the border of the field of view, reflections in the middle of blood vessels, bright artifacts caused by camera lenses, etc. Then, EX candidates are extracted through morphological ultimate opening and features are extracted from each candidate. Finally, a patho-logical probability is assigned to each candidate by a random forest classifier trained on a large manually annotated dataset.
IV. MINING PATHOLOGICAL PATTERNS IN IMAGES
We have seen in the previous section how microaneurysms and exudates can be finely detected in images. We present in this section a general solution to roughly detect the remaining signs of DR, and of other retinal pathologies. The proposed solution relies on wavelet-based image characterizations de-veloped in previous works [18].
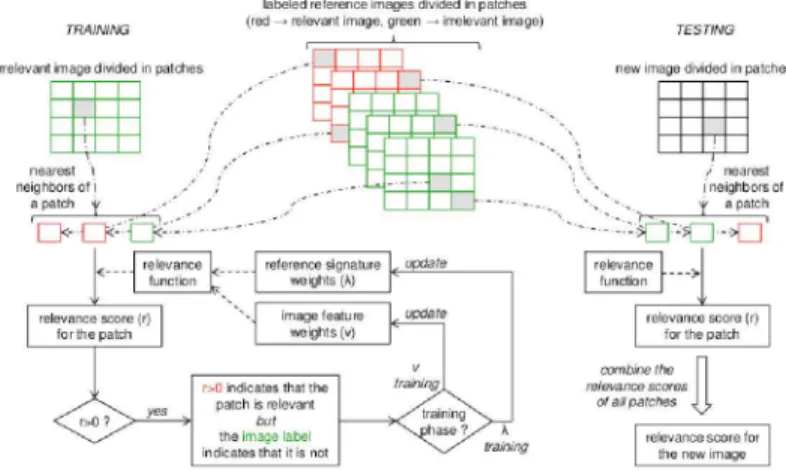
Each image in an examination record is divided into patches. Then, a vector of image characterizations, called signature, is extracted from each patch. A machine learning algorithm was designed to recognize those signatures that only appear in pathological examination records [19]. This algorithm relies on the multiple-instance learning paradigm. In order to detect various pathological patterns, several sizes of patches are used simultaneously. A global pathological index is then derived for the examination record as a whole: it combines local pathological scores computed in image patches individually [11]. The algorithm is summarized in Fig. 2. In order to push the classification performance further, the shape of the wavelet filters used to extract image characterizations is tuned by a genetic algorithm [18], [20]. Note that, unlike the MA and EX detectors, this signature-based detector is not supervised by manual segmentations. Instead, it is supervised by the decision attached to exami-nation records as a whole: whether or not the patient should be referred to an ophthalmologist.
V. CLASSIFYING EXAMINATION RECORDS Now that the visual content of images has been character-ized, we present how image characterizations are combined with contextual data (age, weight, diabetes type, etc.) in order to decide whether or not a patient should be referred to an ophthalmologist. This classification problem has two main challenges. First, we need to process a varying number of 7145
TRAINING
labeled reference images divided in p atches (red -+ relevant image. green -. irrelevant image)
TESTING
irre lev ant image dlVld ed 1n patches
•
new 1maged1v1ded in patches
m
nearest ·, neighOOrs of 1 ~patch ±.. ···
:
~~L
·' ,' ', ', 1 neighbors of , ' ,/ · ---- _ _ ' ,: -,__ ± a patcho -o :
image feature weights (v) r::.O indk:ates that thepatch is relevant
bul
the image label in dk:atesthat it is not
· . . --::5c::i-co -u '
combine the
il
relevance scoresof ail p.atches
relevance soore for the new image
Fig. 2: Pathological pattern mining
lesion detections per examination record. Second, we need to process sparse contextual data. The workflow is summarized in Fig. 1.
A. Lesion-based Pathological Score
To address the first challenge, we first compute a single pathological score per examination record and per lesion detector. In that purpose, the joint cumulative distribution function (CDF) of the lesion probabilities and of the lesion sizes is built for each examination record. This CDF is then mapped to a single pathological score using a linear discriminant analysis [21]. The mapping process is tuned to maximize classification performance in a large training set (see section VII).
Using a trained classifier for the distribution of lesion probabilities and sizes, rather than counting the number of lesions above a hard probability threshold for instance, increases the robustness of the lesion detectors. It is a simple way to make any lesion detector aware of the variety of images in real-live teleophthalmology networks.
B. Heterogeneous Information Fusion
The second step consists in classifying a sparse vector of heterogeneous descriptors: one pathological score per lesion detector, one signature-based pathological score, six quality metrics [21] and up to 27 contextual information fields (see section VI). Solutions based on decision trees [22] and the Dezert-Smarandache theory [12] have been proposed in previous works. A novel solution based on Apriori, the most popular algorithm for association rule mining [23], proved more efficient in this study. Rules associating a subset of descriptors with a referral decision (e.g. {70
<=
age<
75, diabetes_type = NIDDM, MA_score
>
0.75} --+ref er _to_ophthalmologist) are mined in a training set (see section VII). Their sensitivity and specificity are measured in the training set. In order to classify a new examination record, all the relevant association rules are selected. Then, based on the sensitivity and specificity of the selected rules, an abnormality risk is computed for the new record. This solution is particularly well suited to sparse data.
VI. DATASETS
The TeleOphta project has produced several datasets. All these datasets were collected in the OPHDIAT screening network.
The main dataset, called e-ophtha, is the anonymized extraction of all examination records collected in the screen-ing network durscreen-ing the years 2008 and 2009. It consists of 25,702 examination records, each containing four eye fundus photographs on average (two per eye) and up to 27 contextual information fields: 9 demographic information fields and 18 diabetes-related information fields. For practical reasons related to network bandwidth, all images were JPEG-compressed. Each examination record also comes with the referral decision provided by the OPHDIAT reader as well as the severity of DR in each eye.
Five hundred examination records, randomly selected from e-ophtha, were read by a second OPHDIAT reader. The dataset is referred to as e-ophtha "double read".
For the purpose of training the lesion detectors, lesions were manually outlined by an ophthalmologist in randomly selected images. These annotations were checked afterwards by a second ophthalmologist. Two datasets of manually annotated images were created. The first one, called e-ophtha EX, consists of 47 pathological images with 12,278 manually segmented exudates, as well as 35 healthy images. The sec-ond dataset, called e-ophtha MA, consists of 148 pathological images with 1,306 manually segmented microaneurysms, as well as 233 healthy images.
VII. EVALUATION AND RESULTS
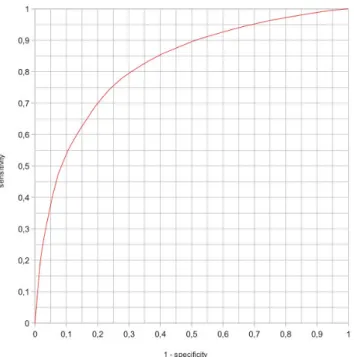
Algorithms designed by both research groups were im-plemented by the ADCIS image processing company. The resulting system was evaluated in e-ophtha. The dataset was divided randomly into a training set and a test set of equal sizes. A Receiver Operating Characteristic (ROC) curve was built by varying a threshold on the abnormality risk provided by the system. The optimal threshold was chosen so that the sensitivity of the system equals the sensitivity of the second expert reader in e-ophtha "double read".
Fig. 3: Performance of the TeleOphta system
In e-ophtha ”double read”, the second expert reader achieved a sensitivity of 80.9% (and a specificity of 81.5%). The ROC curve obtained for the TeleOphta system in the test subset of e-ophtha is reported in Fig. 3. It can be seen that, for a sensitivity of 80.9%, the system achieves a specificity of 68.0%. Given the prevalence of referable patients in e-ophtha (24.9%), it implies that the system could safely reduce by 55.8% the number of patients that must be seen by a human reader (68.0% × 75.1% + 19.1% × 24.9%).
VIII. CONCLUSION
We have presented TeleOphta, a novel strategy to relieve the burden on ophthalmologists in Diabetic Retinopathy (DR) screening networks. Thanks to multimedia data mining in a large screening dataset, the system was able to deal with image heterogeneities and with the variety of retinal pathologies in such screening networks. To our knowledge, TeleOphta is the first DR screening tool that combines visual and contextual information to generate referral decisions. A ROC analysis performed in a large screening dataset validates the relevance of the proposed approach and the system will soon be ready for clinical trials.
ACKNOWLEDGMENT
This work was supported in part by the French Agence Nationale de la Recherche(ANR), within the framework of the TeleOphta project (see http://www.teleophta.fr).
REFERENCES
[1] M. D. Abr`amoff and M. S. A. Suttorp-Schulten, “Web-based screening for diabetic retinopathy in a primary care population: the EyeCheck project,” Telemed J E Health, vol. 11, no. 6, pp. 668–674, 2005.
[2] S. Philip, A. D. Fleming, and K. A. Goatman et al., “The efficacy of automated “disease/no disease” grading for diabetic retinopathy in a systematic screening programme,” Br J Ophthalmol, vol. 91, no. 11, pp. 1512–1517, 2007.
[3] P. Massin, A. Chabouis, A. Erginay, C. Viens-Bitker, A. Lecleire-Collet, and T. Meas et al., “OPHDIAT: a telemedical network screen-ing system for diabetic retinopathy in the Ile-de-France,” Diabetes Metab, vol. 34, no. 3, pp. 227–234, 2008.
[4] Y. Li, T. P. Karnowski, K. W. Tobin, L. Giancardo, S. Morris, S. E. Sparrow, S. Garg, K. Fox, and E. Chaum, “A health insurance portability and accountability act-compliant ocular telehealth network for the remote diagnosis and management of diabetic retinopathy,” Telemed J E Health, vol. 17, no. 8, pp. 627–634, October 2011. [5] S. Wild, G. Roglic, A. Green, R. Sicree, and H. King, “Global
prevalence of diabetes: Estimates for the year 2000 and projections for 2030,” Diabetes Care, vol. 27, no. 5, pp. 1047–1053, 2004. [6] F. Zana and J. C. Klein, “Segmentation of vessel-like patterns using
mathematical morphology and curvature evaluation,” IEEE Trans Image Process, vol. 10, no. 7, pp. 1010–1019, 2001.
[7] T. Walter, J. C. Klein, P. Massin, and A. Erginay, “A contribution of image processing to the diagnosis of diabetic retinopathy-detection of exudates in color fundus images of the human retina,” IEEE Trans Med Imaging, vol. 21, no. 10, pp. 1236–1243, 2003.
[8] T. Walter, P. Massin, A. Erginay, R. Ordonez, C. Jeulin, and J. C. Klein, “Automatic detection of microaneurysms in color fundus images,” Med Image Anal, vol. 11, no. 6, pp. 555–566, December 2007.
[9] G. Quellec, M. Lamard, P. M. Josselin, G. Cazuguel, B. Cochener, and C. Roux, “Optimal wavelet transform for the detection of microa-neurysms in retina photographs,” IEEE Trans Med Imaging, vol. 27, no. 9, pp. 1230–1241, 2008.
[10] G. Quellec, M. Lamard, G. Cazuguel, L. Bekri, W. Daccache, C. Roux, and B. Cochener, “Automated assessment of diabetic retinopathy severity using content-based image retrieval in multimodal fundus photographs,” Invest Ophthalmol Vis Sci, vol. 52, no. 11, pp. 8342– 8348, 2011.
[11] G. Quellec, M. Lamard, M. D. Abr`amoff, E. Decenci`ere, B. Lay, A. Erginay, B. Cochener, and G. Cazuguel, “A multiple-instance learning framework for diabetic retinopathy screening,” Med Image Anal, vol. 16, no. 6, pp. 1228–1240, 2012.
[12] G. Quellec, M. Lamard, G. Cazuguel, C. Roux, and B. Cochener, “Case retrieval in medical databases by fusing heterogeneous infor-mation,” IEEE Trans Med Imaging, vol. 30, no. 1, pp. 108–118, 2011. [13] M. D. Abr`amoff, M. K. Garvin, and M. Sonka, “Retinal imaging and image analysis,” IEEE Rev Biomed Eng, vol. 3, pp. 169–2008, 2010. [14] M. Niemeijer, B. van Ginneken, M. J. Cree, A. Mizutani, G. Quellec, and C. I. Sanch´ez et al., “Retinopathy online challenge: Automatic detection of microaneurysms in digital color fundus photographs,” IEEE Trans Med Imaging, vol. 29, no. 1, pp. 185–195, 2010. [15] X. Zhang, G. Thibault, and E. Decenci`ere et al., “Application of the
morphological ultimate opening to the detection of microaneurysms on eye fundus images from clinical databases,” in Int Congress Stereology (ICS), 2011.
[16] L. Breiman, “Random forests,” Machine Learning, vol. 45, no. 1, pp. 5–32, 2001.
[17] X. Zhang, G. Thibault, and E. Decenci`ere et al., “Automatic detection of exudates in color retinal images,” in ARVO, May 2012.
[18] G. Quellec, M. Lamard, G. Cazuguel, B. Cochener, and C. Roux, “Wavelet optimization for content-based image retrieval in medical databases,” Med Image Anal, vol. 14, no. 2, pp. 227–241, 2010. [19] G. Quellec, M. Lamard, G. Cazuguel, M. D. Abr`amoff, B. Cochener,
and C. Roux, “Weakly supervised classification of medical images,” in Proc IEEE Int Symp Biomed Imaging, 2012, pp. 110–113. [20] G. Quellec, M. Lamard, G. Cazuguel, B. Cochener, and C. Roux,
“Adaptive nonseparable wavelet transform via lifting and its appli-cation to content-based image retrieval,” IEEE Trans Image Process, vol. 19, no. 1, pp. 25–35, 2010.
[21] G. Quellec, M. Lamard, B. Cochener, Z. Droueche, B. Lay, A. Chabouis, C. R. C, and G. Cazuguel, “Studying disagreements among retinal experts through image analysis,” in Proc Int Conf IEEE EMBS, 2012, pp. 5959–5962.
[22] G. Quellec, M. L. L. Bekri, G. Cazuguel, C. Roux, and B. Cochener, “Medical case retrieval from a committee of decision trees,” IEEE Trans Inform Technol Biomed, vol. 15, no. 5, pp. 1227–1235, 2010. [23] R. Agrawal and B. Srikant, “Fast algorithms for mining association
rules in large databases,” in Proc Int Conf VLDB, 1994, pp. 487–99.