HAL Id: pastel-00656201
https://pastel.archives-ouvertes.fr/pastel-00656201
Submitted on 3 Jan 2012
HAL is a multi-disciplinary open access archive for the deposit and dissemination of sci-entific research documents, whether they are pub-lished or not. The documents may come from teaching and research institutions in France or abroad, or from public or private research centers.
L’archive ouverte pluridisciplinaire HAL, est destinée au dépôt et à la diffusion de documents scientifiques de niveau recherche, publiés ou non, émanant des établissements d’enseignement et de recherche français ou étrangers, des laboratoires publics ou privés.
Measurement of cicular dichroism dynamics in a
temperature jump experiment for the study of protein
folding
Mai-Thu Khuc
To cite this version:
Mai-Thu Khuc. Measurement of cicular dichroism dynamics in a temperature jump experiment for the study of protein folding. Biological Physics [physics.bio-ph]. Ecole Polytechnique X, 2011. English. �pastel-00656201�
PhD thesis
presented by
Mai-Thu KHUC
On the subject of:
Measurement of Circular Dichroism Dynamics
in a Temperature Jump Experiment for
the Study of Protein Folding
Defended on December 5
th, 2011
Pascale CHANGENET-BARRET Reviewer Kokou Dodzi DORKENOO Reviewer Gilbert ZALCZER President
Martin VOLK Examiner
ACKNOWLEDGEMENT
I would like to thank the jury for accepting and giving me the honor to present my PhD project. They also have provided me useful ideas and encouragements for this PhD thesis.
I would like to thank “generous” Jean-Louis Martin for accepting and welcoming me to do my three years of PhD in LOB.
I was extremely lucky to be given the opportunity to work with François Hache as my advisor. I could never thank him enough for his continuous and incredible support, help and advices through my three years of PhD.
Martin Volk was the one who gave me the knowledge of temperature jump experiment. I was very lucky to have a chance to work in his laboratory which is one of the world expertises in temperature jump experiment. Martin has also given me lots of advices, support and encouragement for my PhD project. I was very happy to have him as one of my jury.
I would like to thank Monique Martin, Pascal Plaza and Johanna Brazard from Ecole Normale Supérieure de Paris who have given us their precious OBIP and OxyBP samples. Also thanks to their indispensable ideas and opinions, I was able to obtain my first scientific publication about OBIP.
A great acknowledgement goes to Xavier Solinas (our LOB’s excellent technician) who has built up our sophisticated synchronization electronics. My PhD can not be completed without his wonderful hands and his so-bright head.
I would also like to thank Lucille Medonça (my very kind group mate) who has done a lot of important experiments for temperature jump estimation. She also let me learn her work of temperature jump simulation. Moreover, Lucille was the one who implemented successfully the Fast Fourier Transform technique for our signal detection. She always discussed and gave me her useful ideas and encouragement. Not only for work, was she also my lifesaver who helped me a lot with my administrative problems and so on. Also, thank you
Latifa Bouzhir-Sima was another lifesaver. Most of my medical calls were made by her. Also thank you for your work help, your wise health advices as well as your usual talk.
I would also like to thank Jean-Marc who was always there to solve our mechanical problems.
Another acknowledgement goes to our secretarial staff (Laure Lapapelle and Christelle François) for their kind administrative assistance.
I was very happy to work with LOB people who were always nice, helpful and encouraging. Thank you all!
CNRS (for financial support) and EDX people (Pierre Legrain, Audrey Lemarechal, Fabric Baronnet, Christine Ferret) are gratefully acknowledged.
Finally, I would like to thank my family and friends who have been always there, encouraging me and keeping me sane.
TABLE OF CONTENTS
1 Introduction………... 9
1.1 Importance of proteins/protein folding……… 9
1.2 Techniques for observation of fast folding processes in real-time……….. 14
1.2.1 Absorbance……….… 15
1.2.2 Infrared absorbance……… 15
1.2.3 Fluorescence……….. 16
1.2.4 UV resonance Raman scattering……… 17
1.2.5 Optical rotatory dispersion (ORD)………. 17
1.2.6 Other techniques………. 17
1.2.7 Circular dichroism: principle and its role in the determination of secondary structure of proteins/peptides………. …18
1.2.7.1 Optical activity and circular dichroism………. 18
1.2.7.2 Origin of optical activity……… 21
1.2.7.3 Role of circular dichroism in the determination of secondary structure of proteins and peptides………. …… 22 1.3 Methods for fast initiation of peptide or protein folding……….…… 23
1.3.1 Rapid mixing methods………... 23
1.3.2 Relaxation methods……… 24
1.3.3 Photochemical methods………. 25
1.3.4 Laser-induced temperature jumps and its role in time-resolved studies of folding/unfolding processes of proteins/peptides……….. …… 26 1.4 Outlook on the thesis………... 28
2 Experimental details……….. 31
2.1 Temperature jump set-up……… 32
2.1.1.1 Photostability measurements for Fuchsin dye and gold nanoparticles………..
……
32
2.1.1.2 Direct heating set-up……….. 33
2.1.2 Pump laser system……….. 34
2.1.3 Probe laser system……….. 35
2.1.3.1 1kHz Titanium-Sapphire laser system………... 36
2.1.3.2 Generation of tunable UV pulses………... 37
2.1.3.2.1 White-light generation………... 37
2.1.3.2.2 Optical parametric amplification……….. 39
2.1.3.2.3 Generation of a tunable UV probe……… 41
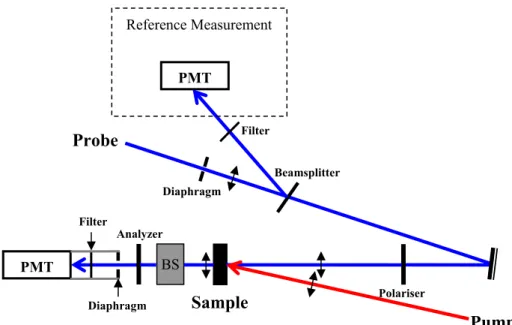
2.1.4 CD/T-jump experimental set-up……… 43
2.1.5 Precise alignment of pump and probe beams……… 44
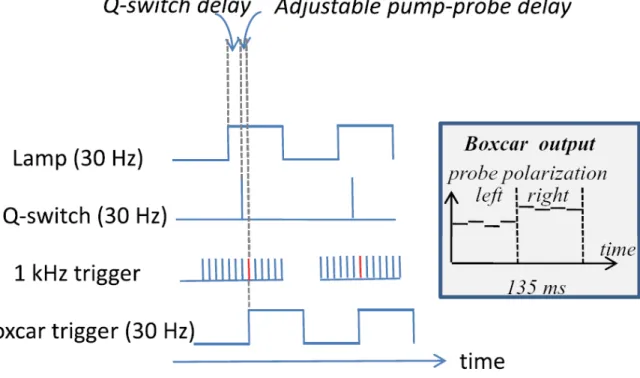
2.2 Electronic synchronization………. 45
2.3 Measurement of circular dichroism……… 46
2.3.1 Principle of the technique……….. 46
2.3.2 Three detection schemes……… 46
2.4 First experimental set-up and unsolvable artifacts………. 47
3 Temperature jump measurements……….. 51
3.1 Introduction………. 51
3.2 Estimation of the temperature jump……… 51
3.3 Simulation of the temperature jump……… 52
3.4 Temperature jump measurements……… 55
3.4.1 Choice of a temperature indicator………. 56
3.4.2 Temperature jump calibration……… 56
3.4.3 Temperature jump measurements……….. 58
3.5 Conclusion………... 61
4 Helix-coil dynamics of Poly(α-L-glutamic acid)………... 63
4.1 Introduction……….…. 63
4.2 Sample preparation……….…. 64
4.3 Results and discussions……… 65
4.3.1 Steady-state temperature-dependent absorption measurements………….… 65
4.3.2 Steady-state temperature-dependent CD measurements………..….. 68
4.3.4 Comparison with IR observations……….. 74
4.4 Conclusion……….. 76
5 Unfolding dynamics of a coiled-coil peptide dimer studied by temperature jump experiment in combination with IR spectroscopy………. …… 77 5.1 Introduction………. 77
5.1.1 IR spectroscopy in the study of secondary structures of proteins and peptides………... …… 78 5.1.2 Folding/unfolding dynamics of coiled-coil peptides……….…. 79
5.2 Sample and preparation……… 81
5.2.1 Material………... 81
5.2.2 CD measurements………... 81
5.2.3 Temperature jump measurements………... 81
5.2.4 FTIR measurements……… 82
5.3 Technical details………. 82
5.3.1 Experimental set-up……….... 82
5.3.2 Pump beam profiles………..….. 84
5.3.3 Optimisation of pump and probe beam overlap……….… 85
5.3.4 Data analysis………..…. 86
5.3.5 Sample cells………..….. 90
5.4 Results and discussions………..…….. 90
5.4.1 CD measurements………..…………. 90
5.4.2 Temperature-dependent FTIR measurements……….…..….. 91
5.4.3 Temperature jump measurements………..………. 94
5.5 Conclusion……….………….. 99
6 Picosecond transient circular dichroism of the photoreceptor protein of the light-adapted form Blepharisma japonicum………..……….. …… 101 6.1 Introduction………. 101
6.2 Materials and sample preparation……….... 104
6.3 Experimental details……….… 105
6.3.1 Experimental set-up………..….. 105
6.3.2 Optimization of pump/probe overlap………. 107 6.3.3 Calculation of absorption and circular dichroism variations induced by the
pump………..
……
6.3.3.1 Probe alone: Jones matrix analysis……… 108
6.3.3.2 Pump-probe experiment………. 110
6.3.4 Sample cell………. 113
6.4 Results and discussions……… 113
6.4.1 Absorption spectra………. 113 6.4.2 Pump-probe experiment……… 114 6.4.3 Discussion……….. 117 6.5 Conclusion………... 118 Conclusion……….. 121 Bibliography……… 125
CHAPTER 1
INTRODUCTION
1.1. Importance of proteins/protein folding
Proteins are the biological workhorses that carry out numerous vital functions in every cell. Of all the molecules found in living organisms, proteins are the most important. They function as catalysts, they support the skeleton, they defend against infections, they generate movement, they control growth and differentiation, they transmit nerve impulses, and they transport and store other molecules such as oxygen. Without proteins, life that we know doesn’t exist.
a) b)
Figure 1.1 Chemical structure of: a) A peptide bond, b) An α-amino acid in its unionized form.
Proteins are polypeptides constructed from a set of only 20 building blocks, known as amino acids, bonded together by peptide bonds between the carboxyl and amino groups of adjacent amino acid residues (figure 1.1a). The sequence of amino acids in a protein is
the same basic structure consisting of an amino group, a carboxyl group and a hydrogen atom but differ due to the presence of a side-chain (known as R, figure 1.1b). An amino acid can be hydrophilic (water-attracting) or hydrophobic (water-repelling), acidic or basic, depending on the properties of the side-chain.
To carry out their task, proteins must fold into a complex three-dimensional structure. The shape into which a protein naturally folds is known as its native conformation. There are four levels of protein structure:
• Primary structure defined by the amino acid sequence,
• Secondary structure is regularly repeating local structures stabilized by hydrogen bonds. The most common types are the α-helix (supported by intra-peptide hydrogen bonding between residues i and i+4), beta sheet (supported by intra-peptide hydrogen bonding between residues further apart than in the α-helix, or between different peptide strands) and random coil (showing no regular intra-peptide hydrogen bond).
• Tertiary structure is the global shape of a single protein molecule, which is formed by the spatial relationship of the secondary structures to one another. Tertiary structure is generally stabilized by nonlocal interactions, most commonly the formation of a hydrophobic core, but also through salt bridges, hydrogen bonds, disulfide bonds, and van der Waals bonds. The tertiary controls the basic function of the protein.
• Quaternary structure is the structure formed by non-covalent forces among several protein molecules (polypeptide chains), which function as a single protein complex. Although the primary structure of a protein can be derived from the sequence of a gene, its tertiary structure can not be determined. The mystery of how polypeptides or proteins fold into their characteristic and functional three-dimensional structure is an exciting and unique challenge that has been currently being investigated in biological research.
One of the most important results in understanding the process of protein folding was a thought-provoking experiment that was carried out by C. B. Anfinsen and colleagues in the early 1960s [1]. They investigated an enzyme ribonuclease that was made of 124 amino acids. Their results demonstrated that the unfolding or “denaturation” of the enzyme was reversible. After the cleavage of disulfide bonds and disruption of tertiary structure, the enzyme spontaneously refolds to native form and its function returns. Therefore, Anfinsen proposed that the native conformation of a protein corresponds to the one of lowest Gibbs free energy
(figure 1.2) and should be determined by the amino acid sequence (“thermodymamic hypothesis”, Nobel Prize 1972).
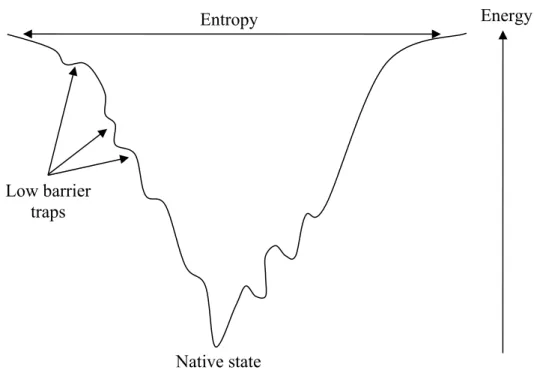
Figure 1.2 Cross section through a folding funnel. The width of the funnel represents the entropy of the
polypeptide chain and the height its energy.
In 1969, C. Levinthal calculated that even if a protein only consisted of 150 amino acids and if one knows the bond angles to be better than a tenth of a radian, the protein could theoretically adopt as many as 10300 possible conformations (Levinthal’s paradox, 1969). Assuming a protein could try out 10100 different conformations per second, it would still take 10200 years to try all possibilities. However, proteins in nature are observed to fold within milliseconds to seconds. So, Levinthal suggested protein folding is speeded and highly guided by the rapid formation of local interactions which serve as nucleation points in the folding process. Then, the final conformation does not have to be the one of lowest free energy, however, it must be a metastable state which is in a sufficient low energy to survive possible perturbations in a biological system.
Different protein folding pathways that have been investigated experimentally and theoretically in recent years have provided interesting hypotheses but still have left lots of disagreements. For proteins of less than 100 amino acids, only two levels of folding can be observed, the unfolded protein and the finished, folded, functional protein [2-7]. In the case of
Native state
Energy Entropy
Low barrier traps
describe this process and the underlying mechanism. These include the framework model, the diffusion-collision model, the hydrophobic collapse model and the nucleation-condensation model (see table 1.1).
Models Mechanisms References
Framework (figure 1.3)
Some peptide segments fold into secondary structure before being packing together to form the final three-dimensional protein. The initial secondary structures are thought to be stable.
8
Diffusion-collision Similarly to the framework model, some peptide segments with secondary structure are formed first before packing up into the final three dimensional structures. However, the segments with secondary structure are highly unstable and present in the unfolded peptide with low probabilities. They stabilize each other only when coming into contact.
9
Hydrophobic collapse (figure 1.3)
The unfolded protein undergoes fast collapse driven by the hydrophobic effect and becomes a disordered compact state with hydrophobic side-chains in the inside and hydrophilic side-side-chains on the outside. Secondary structure and tertiary contacts are then formed within this compact aggregate.
10
Nucleation-condensation (figure 1.3)
Formation of a small nucleus (formation of highly-unstable secondary structure with only few residues) acts as the nucleation site for the fast propagation of the rest of the protein.
11
Figure 1.3 Schematic illustrations of three different models of protein folding pathways: framework model,
nucleation condensation model and hydrophobic collapse model. Figure is extracted from reference [12].
As with all spontaneous processes in nature, protein folding also consumes energy. Obeying the laws of thermodynamics, a protein must fold so that it attains the lowest possible energy. It is thought that this is achieved by using an energy gradient or funnel (figure 1.2) along the path from the random tangle to the folded protein [13]. As each protein seeks out its natural shape through a funnel of declining energy, it can take many folding routes and still reach its target of the completed three-dimensional structure. So, fixed reaction pathways are not any more necessary. This understanding of protein folding was obtained from both computational simulations of model proteins and experimental studies [14], and it has been used to improve methods for protein structure prediction and design [14].
As mention previously, Anfinsen has shown that if proteins become unfolded, they fold back into their original proper shape; no shaper or folder is needed. However, we know now that protein folding can go wrong. For example, when an egg is boiled, the proteins in the white part unfold. But when the egg cools, the proteins don’t turn back to their original structures. Instead, they form a solid, insoluble mass. This is misfolding. A fully denatured protein exists as a random coil. Under certain conditions, some proteins can refold into their original three-dimensional conformation. However, in many cases, denaturation is
fibers instead of folding back to their initial three-dimensional structures [15]. Misfolding of proteins, in which proteins convert into highly ordered fibrillar aggregates, is behind many diseases such as prion-related illnesses (Creutzfeldt-Jakob disease, mad cow disease), amyloid-related illnesses (Alzheimer's disease, familial amyloid polyneuropathy), as well as intracytoplasmic aggregation diseases (Huntington's and Parkinson's disease) [16]. It is thought that the misfolding process is provoked by secondary structure transformation from α-helices into β-sheets, which prevents normal cellular processes.
On the other hand, dynamic aspects of protein folding are important for correct prediction of the folding pathway of any natural or design protein, and so are of great value for the prediction of its final three-dimensional structure [12]. Besides, information on the dynamic of protein folding, and of secondary structure formation in particular, may also help explain the molecular mechanisms behind conditions that leads to misfolding of proteins [12], and thus, may be useful for prevention or treatment for the diseases involved.
It is often believed that the formation of secondary structural elements, such as α-helices, β-strands or β-turns, is the first rapid stage of protein folding, in which the fully unfolded polypeptide collapses into a more compact form [8, 9, 11]. After the formation of the secondary structures, the number of possible conformations that the protein has to explore in the search for the lowest free energy state is greatly reduced. These secondary structure elements may then act as nucleation sites for the further collapse to the final native conformation. This project aims to investigate the fast folding dynamics of α-helices, which is the most common secondary structure found in almost all native proteins for a purpose of understanding the initial phrase of the whole process of protein folding.
1.2. Techniques for observation of fast folding processes in
real-time
According to molecular dynamics simulations, α-helix formation was predicted to occur on the 10-ns timescale [17]. Numerous techniques are currently available for the real-time observation of fast folding dynamics of peptides or proteins on such a short real-timescale. Some of these techniques allow monitoring of highly localized structural changes, whereas others are sensitive to overall secondary structural changes or global movements of the whole protein structure. These techniques are thus complementary and can provide different
information (local and global) on the folding dynamics of a same protein. The simultaneous use of several methods usually significantly enhances the interpretation of results obtained from a particular experiment.
1.2.1. Absorbance
The movement of a cofactor from an exterior environment into the protein interior shifts the position of its absorbance bands, which is usually sensitive to local environmental changes. For example, time-resolved absorption spectroscopy has been used to monitor the ligand-binding process of heme proteins [18-21] or the whole collapse process of such proteins [22] by following the change in absorption of the proteins’ heme groups in the spectral range of 400-430 nm.
1.2.2. Infrared absorbance
Infrared spectroscopy is generally applied for direct observing secondary structural changes in proteins and peptides. The peptide amide I band near 1650 cm-1, which mainly originates from the C=O stretch vibration of the peptide backbone, is very sensitive to changes in secondary structure of proteins/peptides [23]. Upon secondary structure formation, its frequency is shifted by hydrogen bonding and transition dipole coupling, both of which depend on the relative geometry of the peptide groups [24]. For example, an increase in the temperature shifts the helix-coil equilibrium of a peptide towards less helical conformation. This results in a broadening of the amide I band and a shift of the band maximum to higher frequency [25]. Time-resolved IR spectroscopy has been used to monitor the changes in the overall secondary and tertiary structure of proteins [26-29] and peptides [2, 4, 6, 25, 30-33].
Local probing at residue level can be achieved with the help of isotopic labeling such as the replacement of 12C=16O by 13C=16O/13C=18O, which shifts the amide I band by approximately 40 cm-1 (13C=16O labeling [34])/60 cm-1 (13C=18O labeling [35]) toward lower frequencies. 13C=16O isotope-edited IR spectroscopy has been used to selectively determine the stability of different parts of an α-helical peptide [36]. Ultrafast protein folding dynamics at residue specific resolution has been studied in time-resolved IR measurements using
1.2.3. Fluorescence
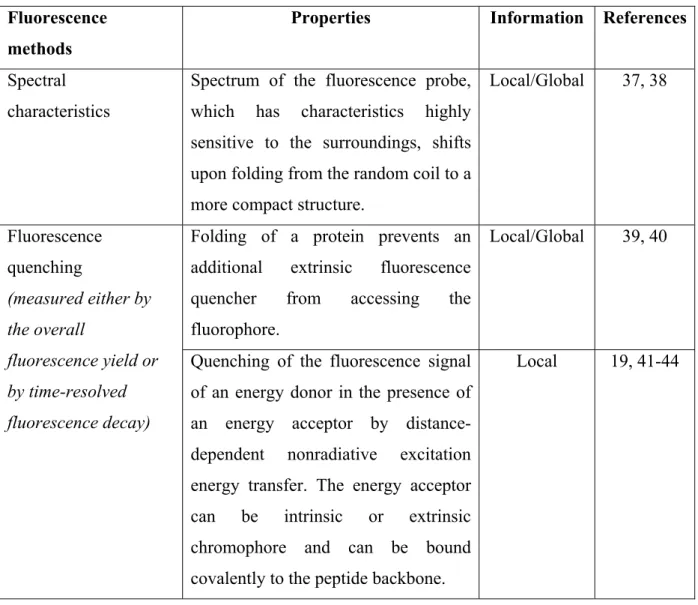
The aromatic amino acid residues of proteins can be used as intrinsic fluorescence probes, avoiding any distortion effects on the proteins. On the other hand, external fluorophores can be bound to the peptide chain covalently or attached noncovalently as extrinsic probes. Fluorescence methods can be used to observe both local and global structural changes of proteins, depending on the property of the fluorophore, the presence of fluorescence quenchers and the particular fluorescence characteristics being measured (table 1.2).
Fluorescence methods
Properties Information References
Spectral characteristics
Spectrum of the fluorescence probe, which has characteristics highly sensitive to the surroundings, shifts upon folding from the random coil to a more compact structure.
Local/Global 37, 38
Folding of a protein prevents an additional extrinsic fluorescence quencher from accessing the fluorophore. Local/Global 39, 40 Fluorescence quenching (measured either by the overall fluorescence yield or by time-resolved fluorescence decay)
Quenching of the fluorescence signal of an energy donor in the presence of an energy acceptor by distance-dependent nonradiative excitation energy transfer. The energy acceptor can be intrinsic or extrinsic chromophore and can be bound covalently to the peptide backbone.
Local 19, 41-44
1.2.4. UV resonance Raman scattering
UV Resonance Raman (UVRR) spectroscopy has been proved to have potential in the studies of protein folding for observing overall secondary structure or local structure changes, depending on the chromophore under investigation (such as amide groups, aromatic side- chains or protein cofactor) [45, 46]. One advantage of UVRR scattering is that the amide III region can be accessed, whereas IR spectroscopy is limited to the amide I region which overlaps with side-chain vibrations and absorption of solvent H2O (or D2O). Secondary
structure can be reported via the intensities of resolved UVRR components of the amide III and S spectral envelopes, or by least squares fitting, over all four amide regions, with secondary structure spectra determined from crystallographically characterized protein sets [45, 46]. Time-resolve UVRR has been used to follow fast changes of overall helical structure of some α-helical peptides [47-50] or protein [51]. Slow secondary conformation change like β-sheet formation process has also been studied by time-resolved UVRR on some proteins [52, 53]. Local probing can be achieved by isotope-edited UV resonance Raman spectroscopy and has been applied to study the spatial dependence of the unfolding dynamics of the secondary structure of an alanine-based α-helical peptide which has two perdeuterated end parts and a non-deuterated center [54].
1.2.5. Optical rotatory dispersion (ORD)
ORD, which is the wavelength dependence of the orientation of a linearly-polarized light, is well-known as a determination method for the secondary structures of proteins/peptides. Recently, time-resolved ORD spectroscopy has been used to monitor the fast folding/unfolding dynamics of secondary structure of α-helical peptides [55] and proteins [56, 57]. As a quantitative technique, the change in the helical content upon the secondary structural changes can be reported [55].
1.2.6. Other techniques
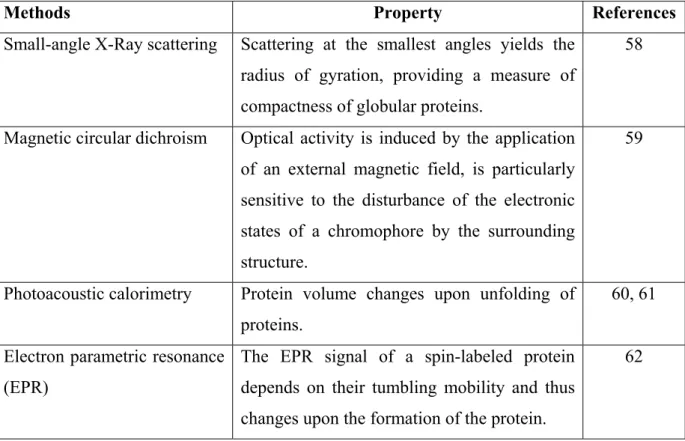
Many other, more specialized methods have been applied to investigate fast folding processes of proteins (table 1.3).
Methods Property References
Small-angle X-Ray scattering Scattering at the smallest angles yields the radius of gyration, providing a measure of compactness of globular proteins.
58
Magnetic circular dichroism Optical activity is induced by the application of an external magnetic field, is particularly sensitive to the disturbance of the electronic states of a chromophore by the surrounding structure.
59
Photoacoustic calorimetry Protein volume changes upon unfolding of proteins.
60, 61 Electron parametric resonance
(EPR)
The EPR signal of a spin-labeled protein depends on their tumbling mobility and thus changes upon the formation of the protein.
62
Table 1.3 Some other, more specialized techniques used for observing fast folding process of proteins.
1.2.7. Circular dichroism: principle and its role in the determination
of secondary structure of proteins/peptides
1.2.7.1. Optical activity and circular dichroism
When a molecule is optically active, it has a different refractive index for right- and left- circularly polarized light. This results in the rotation of the plane of polarization of the light. The rotation is wavelength-dependent, thus the effect is called optical rotatory dispersion (ORD). Besides, the molecule also absorbs the two polarizations of light to different extents. This is called circular dichroism (CD). When a molecule exhibits a combination of ORD and CD in the region of absorbance, then the transmitted light becomes elliptically polarized which is observed in circular dichroism.
Let consider a light wave linearly-polarized in the x direction: ⎟⎟ ⎠ ⎞ ⎜⎜ ⎝ ⎛ = − 0 1 ) ( 0 t kz i e E Er ω , (1.1)
where E0 is the vibration amplitude, k is the wavevector, ω is the angular speed. This
linearly-polarized light wave can be analysed as a superposition of left- and right- circularly linearly-polarized light waves: ⎟⎟ ⎠ ⎞ ⎜⎜ ⎝ ⎛ + ⎟⎟ ⎠ ⎞ ⎜⎜ ⎝ ⎛ − = + = − − i e E i e E E E E ikz t ikz t R L 1 2 1 2 ) ( 0 ) ( 0 ϖ ϖ r r r . (1.2) By passing through an optically-active medium of thickness l, the two vibration components meet different refractive indices (nL, nR), where nL and nR are the refractive index of left- and
right-circularly polarized light respectively, and different linear absorption coefficients (αL, αR), where αL and αR are absorption indices of left- and right-circularly polarized light
respectively. Thus, the two transmitted vibrations have a complex phase difference of
(
) (
)
[
nL nR iαL αR]
lλ π
φ= 2 − − − , (1.3)
where λ is the wavelength. Therefore, we obtain a complex rotation
(
) (
)
[
nL nR iαL αR]
l λ π φ θ = = − − − 2 . (1.4) On the other hand, the amplitudes of the two transmitted vibration components become:l L L e E E λα π 2 0 ' 2 − = , (1.5) l R R e E E λα π 2 0 ' 2 − = , (1.6)
As a result, we obtain an elliptic vibration, which have the axes:
' ' R L E E A= + , (1.7) ' ' R L E E B= − . (1.8)
) ( 2 ) ( 2 tan 2 2 2 2 0 2 2 0 l l l l R L R L e e E e e E B A α π α π α λπ α λπ ψ ψ − − − − + − = = ≅ l l L R L R e e ) ( 2 ) ( 2 1 1 α α λ π α α λπ − − − − − − = l th (αL αR) λ π − =
(
αL αR)
l λ π − = in radian. (1.9) As being defined, CD is the difference in absorption of left- and right-circularly polarized light: ' 0 ' 0 log log R L R L I I I I A A A= − = − Δ , (1.10) where I0, I and L' ' RI are the intensities of the linearly-polarized incident light, the transmitted
left- and right-circularly polarized components. Then, we have
L R L R I I e I I A=log =log .ln Δ 2 ' 2 ' ln . log L R E E e = l l L R e E e E e α λπ α λπ 4 2 0 4 2 0 2 2 ln . log − − ⎟ ⎠ ⎞ ⎜ ⎝ ⎛ ⎟ ⎠ ⎞ ⎜ ⎝ ⎛ = e
(
αL αR)
l λ π − =log .4 . (1.11) On the other hand, by applying Beer-Lambert’s law, CD can also expressed as(
)
ClCl
A=Δε = εL−εR
Δ , (1.12)
where εL, εR are the molar extinction coefficients for left- and right-circularly polarized light
respectively, C is the molar concentration and Δε is defined as the molar dichroic absorption coefficient. Combining two equations (1.11) and (1.12), we obtain
(
)
e l Cl R L log . 4 ε α α λ π − = Δ . (1.13) Comparing (1.9) and (1.12), one gete Cl log 4 ε ψ = Δ . (1.14) The term “molecular ellipticity” is usually used and is defined in degrees.mol-1.L.m-1 as
ε π ε Δ = × Δ = Θ 180 3298 log 4 100 e , (1.15)
where Δε is expressed in mol-1.L.cm-1.
1.2.7.2. Origin of optical activity
An electronic transition is the result of the movement of charges when electrons of a molecule are perturbed by the electric field of an electromagnetic radiation. Similarly, the magnetic field can induce a magnetic transition The optical activity associated with a transition depends on the electric dipole moment and the magnetic dipole moment induced by the action of the electromagnetic radiation on the electrons in the molecule. The rotational strength Rk of a transition is defined as the product of two vectors of the electric dipole μr e
and the magnetic dipole times the cosine of the angle γ between the two vectors:
γ μ μe mcos k
R = r r . (1.16) If a molecule has a plane or center of symmetry, either the sum of all the induced electric and magnetic dipoles is zero, or the vectors representing the magnetic and electric dipoles are orthogonal to one another. And thus, there is no optical activity. However, there are molecules that have neither reflection plane nor symmetry center, and so the molecules are optically active and they are said to be chiral. In such cases, three phenomena may exist:
• Two transitions occur in a single chromophore, one is magnetic and one is electric. The asymmetry in the molecule perturbs the field, resulting in a symmetry breakdown in the chromophore and so the two transitions are no longer perpendicular to one another. The n-π* transition is electrically forbidden but is magnetically permitted. In
an asymmetric molecule, such a transition can have very low total absorption of light but high optical activity. This case is found in all helical polypeptides and proteins. • Two groups have simple electric transitions. These are coupled by their proximity to
produce a magnetic moment. This phenomenon is responsible for most of the optical activity of helices.
• Two chromophores are present in a single molecule. One has a magnetic transition and one has an electric transition. These are coupled in the molecule and strengthen each other.
1.2.7.3. Role of circular dichroism in the determination of secondary structure of proteins and peptides
As proteins and peptides consist of amino acid residues which are chiral molecules, they exhibit optical activity and so CD. The chromophore which interacts with light is the amide bond. Three electronic transitions are thought to occur in the range of 130-230 nm, including a weak n→π* transition (210-230 nm), a strong π→π* transition (170-195 nm), and a second, weaker π→π* transition (135-160 nm) [63-65]. In the CD spectrum of α-helices, a weak n→π* electronic transition occurs at ~220 nm while a higher frequency π→π* electronic transition takes place at ~190 nm [63, 64]. This π→π* transition undergoes exciton splitting that gives rise to two dipole-allowed transitions: one perpendicular to the helical axis at 190 nm and the second parallel to the axis at 205 nm. For β-sheets, the n→π* transition occurs at ~217 nm regardless of strand orientation in the sheet while the π→π* transition occurs at ~194 nm for parallel sheets and ~196 nm for anti-parallel sheets [65]. These transitions can be observed characteristically in a CD spectrum (see chapter 4 for more details). From the CD spectrum, one can extract the information on the fraction of a molecule that is in the α-helix shape, the β-sheet configuration or random coil conformation (see chapter 4 for the analysis).
Static CD measurements of the amide bond absorption in the far UV (190-230nm) have been widely used for the quantitative determination of secondary structures of proteins and peptides [66]. This field has recently known an important progress with the appearance of SRCD (Syncrotron Radiation CD) and protein secondary structure determination can be performed through websites such as DICHROWEB [67] Another advantage of CD spectroscopy is that the measurements can be performed in aqueous solution instead of heavy
water which must be done with IR spectroscopy. This makes the experiment more accessible and closer to physiological conditions of proteins.
1.3. Methods for fast initiation of peptide or protein folding
In order to be able to observe any process on a short timescale, it is essential to start the process fast enough, i.e., within the desired time resolution. The most general methods for the initiation of protein folding or unfolding are based on fast mixing techniques, in which solution conditions, such as denaturant concentration or pH, are rapidly changed from unfavorable for folding/unfolding to favorable by mixing with other suitable solutions. Since the mixing methods rely on diffusion of molecules in solutions, the experiments using these methods are normally restricted to observing processes on millisecond, or longer timescales. However, in many cases, rapid mixing measurements show indications of unresolved fast processes of protein folding occurring during a burst phase within the dead time of the measurements [68, 69]. As mentioned previously, by using molecular dynamic simulation, α-helix formation is predicted to occur on the 10-ns timescale, which is much shorter than the required time for efficient mixing of the standard rapid mixing techniques. Recently, some innovative approaches have been successful in providing initial insights into the fast processes of peptide and protein folding on short timescales (< 1 ms).
1.3.1. Rapid mixing methods
Rapid mixing is a standard method for triggering protein-folding reactions by the fast reduction of the concentration of denaturants, such as guanidine hydrochloride (GuHCl) or urea, or by a sudden change in the pH of the solution to a value more favorable for the folded protein. This technique has been widely used for the studies of protein-folding dynamics, although its time resolution is limited to the timescale of milliseconds. Two strategies have been pursued to maximize the time resolutions of these rapid mixing techniques:
• The first approach is based on turbulent flow to achieve mixing of two solutions. The purpose is to attain highly turbulent flow conditions in a small volume. One example following this strategy is designed by Regenfuss et al. [70]. They used a tapered outer capillary and an inner, smaller-outer diameter capillary to introduce the two flows to be mixed. The openings of the two capillaries were nearly plugged by a platinum
rate, causing fast mixing. The mixed stream then went through an observation cell where fluorescence, absorbance or resonance Raman spectrum can be obtained as a function of distance along the flow, which can be converted to time using the flow rate and volume of the cell. Using a two-dimensional UV-sensitized CCD detector can provide full temporal and spectral response simultaneously [71]. 100µs dead time can be achieved with this mixer design. The fastest time resolution reported for turbulent flow mixing is 50 µs [72]. One main advantage of this approach is the use of a large amount of sample. A number of laboratories have used a turbulent flow mixer to study the folding dynamics of horse cytochrome c [72, 73].
•
Another strategy is to use microfluidic devices which are based on the principle that diffusional mixing times scale as the square of the linear dimension of the mixing volume. Short mixing times are attainable by hydrodynamic focusing, which creates a micron or submicron stream of protein solution in contact with a surrounding (sheath) stream. Because flow rates are much smaller in these cases, the flow is laminar and the sample and sheath stream do not mix. In stead, the folding/unfolding process is initiated by diffusion of denaturants/protons from the sheath flow into the central protein stream. Pollack et al. [59] has fabricated and used such a microfluidic device for the observation of fast folding dynamics of cytochrome c. This approach only consumes a very small quantity of sample and is useful for any processes that can be photochemically initiated.1.3.2. Relaxation methods
Relaxation methods, such as dielectric relaxation, ultrasonic attenuation and ultrasonic velocimetry, rely on a rapid change of an extrinsic variable such as pressure to perturb the biological system. These methods were applied in very early researches to investigate the helix-coil dynamics of α-helical homopolymers, yielding relaxation times in the range of 10 ns to 10 µs [74, 75]. Studying the conformational relaxation of the acidic molten globule state of α-lactalbumin by using ultrasonic velocimetry, Nölting et al. [76] has indicated that the structural relaxation of the protein occurs significantly in less than 500 ns. These relaxation methods, however, only give indirect structural information on the folding dynamics of proteins.
Intra-chain diffusion is regarded as an important elementary process that determines the maximum rate at which a protein can fold [77]. Recently, triplet-triplet energy transfer between chromophores which are attached to opposite ends of a short peptide chain with purely random coil structure has been used to investigate the formation of intramolecular contact in some small peptides [77, 78]. The triplet state of one chromophore (donor) is quenched upon electron exchange during contact formation with the chromophore (acceptor) at the other peptide end. The triplet decay rate is thus identical to the rate of quenching which is also close to the rate of contact formation. Therefore, the contact formation time can be evaluated based on measurements of the lifetime of the triplet state of the chromophore “donor”, which was observed to be in the range of 10-100 ns, depending on the length of the peptide chain.
1.3.3. Photochemical methods
Photochemical methods have been used early on for triggering the folding of heme proteins such as cytochromes by photodissociation of carbon monoxide (CO) from the heme cofactor or electron transfer to the heme. CO photodissociation relies on denaturant concentrations at which a reduced heme protein without a CO ligand remains folded, while the same protein with a CO ligand is unfolded. Under such conditions, fast photodissociation of CO, which occurs on a picosecond timescale, causes the protein to be unligated in its unfolded form, and then relaxes to the more stable folded structure. Upon initiation of refolding of the heme protein, peptide chain diffusion-limited ligation of the heme can be observed by following the fast changes in the heme absorbance spectrum [18, 45, 79, 80], or by using time-resolved CD spectroscopy [21] or time-resolved MCD measurements [58].
On the other hand, it can be also found that at certain denaturant concentrations, the heme proteins are unfolded in the oxidized state while remaining folded in the reduced state. Thus, electron transfer to an oxidized unfolded heme protein, which can be induced by photoexcitation of a suitable chromophore, can trigger the refolding process of the protein. However, the timescale of initiation of protein folding by this method is limited by the electron transfer time, which is less than 1 µs with freely diffusing electron donors [81]. Shorter timescales can be achieved by covalently linking an extrinsic chromophore to the protein. Protein folding initiated by electron transfer has been studied on some heme proteins [20, 81, 82].
Although these ligand dissociation or electron transfer methods are almost ideal for triggering folding processes of heme proteins on very short timescales, their application is limited to these proteins and cannot easily be extended to other types of samples. Furthermore, the folding dynamics of heme proteins which are initiated by these techniques are likely governed by ligand formation and exchange processes rather than by intrinsic protein-folding dynamics. Thus, one can not apply the conclusions from such experiments on a general protein folding problem. Besides, both methods require the presence of great amounts of denaturants, which significantly affect the folding dynamics of proteins [20, 72, 81].
1.3.4. Laser-induced temperature jumps and its role in time-resolved
studies of folding/unfolding processes of proteins/peptides
Laser-induced temperature jump technique is the most versatile and simplest of the fast initiation approaches for the time-resolved studies of folding/unfolding processes of proteins/peptides. This technique relies on the thermal instability of proteins/peptides. As proteins/peptides are stable only over a limited range of temperatures, increasing temperature above the limited range will cause the proteins/peptides lose their native structure [12]. Note that in several cases, proteins can also unfold at low temperatures; this phenomenon is known as cold denaturation [83]. In many cases, the denaturation process is observed to be fully reversible and the protein refolds spontaneously upon returning to physiological temperatures. Thermodynamically, the protein ensemble exists in an equilibrium between the folded structure and unfolded conformations, which shifts with temperature. For proteins, the equilibrium shifts from completely folded to completely unfolded conformation only over a few degrees [12]. However, for shorter peptides, the transition region is usually much larger, often ranging over several tens of degrees [31, 84, 85].
A sudden increase in temperature (temperature jump), which is too fast for the protein ensemble to respond simultaneously, initially leaves the protein ensemble in a conformational distribution that does not correspond to the equilibrium distribution at the new temperature. The late response of the protein ensemble towards the new thermal equilibrium can be observed by an appropriate probe, allowing monitoring of the folding/unfolding process of the protein [12]. The use of temperature jump to displace thermodynamic equilibrium was pioneered by Czerlinski and Eigen [86] who used rapid capacitance discharge to produce
Joule heating in conducting solution within several microseconds. Faster temperature jump can be achieved by using short laser pulses which directly or indirectly heat up the solvent and enables observation of protein dynamics on very short timescales (nanoseconds, picoseconds). In indirect heating, the laser pulse energy is absorbed by an inert dye that undergoes fast internal conversion [25, 26, 87]. Direct heating can be achieved by direct excitation of weak overtone bands of H2O near 1.5 µm or D2O near 2 µm, which have been
made routinely by Raman shifting of Nd:YAG laser pulses [4, 6] or by difference frequency generation with dye laser pulses [27]. The time resolution of temperature jump methods is determined by the time needed to achieve a homogeneous temperature increase. Vibrational relaxation of the excited modes and energy flow from a dye to the solvent occur on picosecond timescales in aqueous solution, and complete thermalization of the solvent and solute can be achieved within 10-20 ps [88, 89].
A temperature increase generally results in a relaxation dynamics which corresponds to an overall unfolding of the protein, except for the case of cold denaturation which will induce net folding. Analysis of temperature jump dynamics requires a dynamic model in order to relate the observed relaxation times to the rate constants of the model reaction. The simplest model is the relaxation between fully-folded state and completely-unfolded state. If it is the case, the equilibrium relaxation time constant τrel is determined by
u f rel k k + = 1 τ
where kf and ku are the rate constants for folding and unfolding reactions, respectively.
Therefore, the relaxation towards the unfolded protein yields the same information as the relaxation towards the folded protein. The folding/unfolding rate constants can be calculated from τrel and the equilibrium constant K = kf/ku. Relaxation dynamics of more complicated
systems, which do not exhibit simple two-state equilibrium behaviour, requires more sophisticated models to be analysed [90], nevertheless, folding and unfolding relaxation still should give the same information.
Laser-induced temperature jump is currently the most widely-used initiation approach for the investigation of fast folding/unfolding processes of proteins/peptides. The major advantage of temperature jump methods that distinguishes them from the rapid mixing methods and the fast photochemical methods is that it doesn’t require the presence of
native solvent conditions; this avoids any possible undesired effect on the folding/unfolding dynamics caused by the denaturants. Furthermore, laser-induced temperature jump techniques rely on temperature-induced folding/unfolding of proteins and peptides and are thus applicable to a very broad range of proteins and peptides. Finally, once again laser-induced temperature jump with the used of short laser pulses allows observation of protein-folding dynamics on very short time scales (nanoseconds, microseconds).
1.4. Outlook on the thesis
As one has learnt how important it is to understand the mechanism behind the processes of protein folding/unfolding, knowing that CD spectroscopy offers quantitative determination on the secondary structure of proteins and peptides, realizing the advantages of laser-induced temperature jump (T-jump) for the initiation of fast folding/unfolding processes of proteins and peptides, we have developed a nanosecond T-jump experiment in combination with UV-CD spectroscopy for a quantitative investigation of the folding/unfolding dynamics of proteins and peptides.
Time-resolved CD was pionneered as soon as 1985 by Prof. Kliger [91] who demonstrated the potentiality of the technique by monitoring conformational changes in carboxy-myoglobin with a 50 ns time resolution. Prof. Simon then improved the time resolution down to 80 ps [92]. In recent years, demonstration of sub-picosecond CD measurements was carried out in the Laboratory for Optics and Biosciences [93]. Other similar time-resolved techniques have also been developed: optical rotation dispersion, magnetic circular dichroism, linear dichroism... A recent review is given in [94]. Recently, several groups have developed time-resolved CD spectroscopy with broadband sources which allow the simultaneous measurement of a complete CD spectrum with a very high resolution [95].
In all these studies, triggering of the conformational change was performed by photochemical methods such as the photodissociation of carboxymyoglobin. However, these techniques are limited to specific proteins and not well adapted to the study of protein folding. On the other hand, as we have seen above, T-jump experiments provide a very efficient way to mimick denaturation processes in peptides or proteins in their physiological environment. We have therefore decided to mix these techniques and to measure the CD in the far UV after a T-jump excitation. This thesis contains six chapters:
• Chapter 1 has been written as an introduction to protein-folding problem and the tools that have been used to solve it.
• Chapter 2 describes experimental details that we have developed and experienced to build up a nanosecond T-jump/CD experiment.
• Chapter 3 introduces our temperature jump measurements as well as our calculation for applying temperature jump approach to study proteins/peptides unfolding in our experiment.
• Chapter 4 investigates the unfolding dynamics of poly (α-L-glutamic) acid using our T-jump/CD experiments. From our T-jump measurements, information on the change in helical fraction of the peptide has been extracted. Furthermore, the results have been compared with those obtained from Dr. Volk’s T-jump/IR measurements (University of Liverpool, UK).
• Chapter 5 presents our work in the course of our collaboration with Dr. Volk to study the folding dynamics of a coiled-coil dimmer, measured by Volk’s T-jump/IR measurements.
• Chapter 6 describes a picosecond time-resolved CD experiment and our results obtained from studying a fast photoinduced reaction on a putative photoreceptor protein involved in the photophobic response of Blepharisma japonicum. Our results demonstrate the local geometrical changes that accompany this process.
CHAPTER 2
EXPERIMENTAL DETAILS
This chapter presents experimental details on our temperature jump experiments which allow a quantitative observation of the helix-coil dynamics of α-helical peptides. The idea is to combine the use of a temperature jump with probing of the change in circular dichroism of these peptides in the far UV, where the secondary structures reveal with characteristic CD features. The CD feature, which shows up at 220 nm, is commonly used to estimate the α-helical content of proteins. By measuring the variation of circular dichroism of a polypeptide, one obtains the variation of the helical fraction in the peptide.
In order to heat up water with nanosecond pulses, two strategies can be employed. One can use indirect heating where a dye [26] excited by the second harmonic of the laser serves as heat transducer. Alternatively, one can directly heat the water solvent using IR laser pulses. The latter method yields less cavitation problems [2], but demands a nanosecond IR source whereas the former one is directly implementable with a Nd:YAG laser. We have therefore carried out a series of test on the indirect mechanism that we will present in the next section.
However, considering the experimental problems with indirect heating, we have finally decided to buy a nanosecond OPO directly operating in the infrared. The two laser sources needed to carry out a CD/T-jump experiment are then presented. On the one-hand, one needs a nanosecond IR source to induce the temperature jump, hereafter called the "pump". On the other hand, a UV source compatible with the detection of the CD is necessary (the "probe"). Finally, electronic synchronization of the two sources and of the various
2.1. Temperature jump set-up
2.1.1. Choice of the heating mechanism
Because indirect heating is much cheaper, we have started considering this mechanism for our T-jump experiment. This indirect heating is the result of the following steps:
Dye absorption of laser pulses.
Fast internal conversion of photon energy into vibrational energy. Vibration relaxation and heat diffusion into the surrounding.
Uniform temperature heat diffusion (in pumped volume) during laser pulse duration (100 ps).
Temperature stability in the pumped volume (1 ms).
One of the drawbacks of this indirect heating technique is the bleaching of the dye which is used as an intermediate for energy transfer. As far as we know, gold nanoparticles give the possibility of absorption at the Nd:YAG wavelength of 532 nm. The need for understanding of the photostability of these compounds to choose an appropriate material is one of the first requirements for a T-jump experiment.
2.1.1.1. Photostability measurements for Fuchsin dye and gold nanoparticles
We have studied two samples: the Fuchsin dye and gold nanoparticles. Both compounds have a strong absorption around 530 nm and release rapidly their heat to water after excitation. Fuchsin in the form of powder was dissolved in double-distilled water (pH = 8.45) to get a 3 mM fuchsin solution. The solution was then diluted to get a 0.075 mM solution with a 0.56 optical density was achieved. Gold nanospheres suspended in water was fabricated following Turkevich et al. method [96, 97].
In order to measure the photostability, sample is irradiated by a Nd:YAG laser at 532 nm wavelength. Green light coming out of the laser is split into two beams, one is for reference and the other will be sent to the sample. The two beams are then directed to two photodiodes, of which the two signals will be treated by two averagers and modulated by a module card which is connected to a computer. The averagers and module card are triggered by an electrical signal from the laser.
After several measurements on photostability of fuchsin and gold nanoparticles, one can conclude that gold nanoparticles show very promising photostability over fuchsin dye. Under irradiation of Nd:YAG laser with a 27 mW power, fuchsin exhibits a continuous slow degradation over time with a 13.2 hour time constant at room temperature and a dramatic soaring of transmission signal with a 5.2 minute time constant at 52°C. Although gold nanoparticles undergo some small changes in transmission at the beginning of laser irradiation, they show up a good stability after four hours with the same laser power. One can also notice that the changes of gold nanoparticles due to laser irradiation take longer time at higher temperature. Actually, in order to use such gold nanoparticles in T-jump experiment, they should be irradiated during 4 hours at room temperature and at least 1 hour at 52°C before use so that one can expect a good stability.
Unfortunately, the Turkevich method provides charged nanoparticles which interact with polypeptides. Mixing these particles with a peptide instantaneously resulted in the appearance of a precipitate. To correct for this effect, one should use capped nanoparticles, which are much more complicated to produce. Furthermore, even though gold nanoparticles display good stability properties, the indirect heating remains prone to cavitation problems.
2.1.1.2 Direct heating set-ups
In view of the aforementioned difficulties, we decided to go for a direct heating apparatus. Several possibilities exist to generate IR pulses from a Nd;YAG laser:
• Raman shifter: by passing the Nd:YAG pulse through a cell containing a gas, its wavelength is shifted because of Raman effect.
• Dye laser: A Nd:YAG laser can be used to pump a dye laser. A further difference frequency stage yields IR pulses.
• Nanosecond OPO's. Several possibilities exist for Nd:YAG pumped OPO's. They can be based on PPLN or on BBO crystals.
We have had the opportunity to buy a commercial nanosecond OPO which is very convenient. We will now present the laser systems in details.
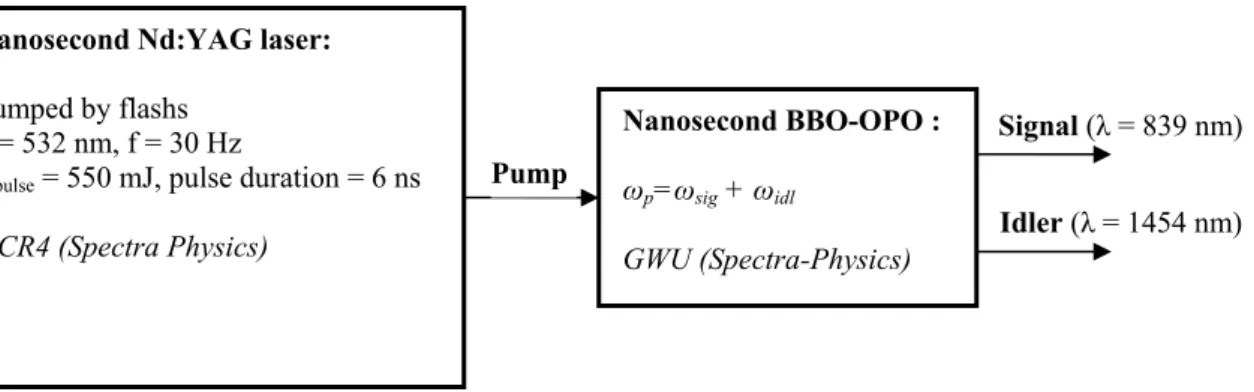
2.1.2. Pump laser system
Our pump laser system is based on a nanosecond frequency-doubled Nd:YAG laser (GCR4, Spectra-Physics). The active medium is a rod of neodymium-doped yttrium aluminium, which is pumped by a flash lamp that emits white light. Excited electrons quickly drop to the upper level of the lasing transition, where they remain for a relatively long time-about 230 s. The most probable lasing transition is connected with an emission of a photon at 1064 nm, because afterwards electrons quickly relax to the ground state and a population inversion is easily created. The Nd:YAG laser is designed to limit oscillation to 1064 nm light. An electro-optic Q-switch is employed to prevent oscillation, and therefore, the population inversion is built up high. At the point of maximum population inversion, the Q-switch is Q-switched to transmission mode by a fast high-voltage pulse, allowing the energy stored in the medium to be converted into a high intensity pulse of < 10ns duration. The active medium is placed in a resonant cavity, where the pulse intensity is greatly amplified by stimulated emission. The Q-switched pulse passes through a SHG (second harmonic generation) crystal where the 1064 nm light interacts with the crystal to produce 6ns pulse at 532 nm with a repetition rate of 30 Hz and an energy of 550 mJ.
Most T-jump experiments based on an IR probe necessitate the use of deuterated water and require IR pulses at 1.9 μm. Such is not the case in our set-up where we deal with a UV probe and our samples are dissolved in H2O. In that case, the IR wavelength necessary to heat
up water is about 1.5 μm, which corresponds to the excitation of the ν1+ν3 overtone mode of
H2O. Absorption at this wavelength is 32 cm-1, a weak absorption which allows uniform
heating of the sample.
In order to reach IR wavelengths, the 532 nm light beam is used to pump a commercial nanosecond OPO (GWU, Spectra-Physics) where 532 nm photons are converted into signal-idler photon pairs through second-order nonlinear optical interactions with a β-BaB2O4 (beta-barium borate or BBO) crystal [98]. For reasons of energy conservation, the
relation
idl sig p ν ν ν = + ,
where ν , p νsand νiare the frequencies of the pump, signal and idler beams respectively, must be held. The signal and idler wavelengths, which are determined by a phase-matching condition, can be varied in a wide range of 690-2300 nm. In order to obtain the idler
wavelength of 1.454 μm, the signal wavelength is precisely tuned to 839 nm. The OPO delivers up to 8 mJ pulses at 1.454 μm (idler) with a duration of 5 ns.
Figure 2.1 Description of the nanosecond laser system used to induce temperature jump.
1400 1420 1440 1460 1480 1500 1520 12 14 16 18 20 22 24 26 28 30 32 A bsorp tion c oe ffi ci en t (1/ cm) Idler wavelength (nm)
Figure 2.2 The ν1+ν3 overtone band of H2O with maximum absorption at 1.454 μm. Measurement taken in a sample of distilled H2O with a 100 μm path-length cell using a PbSe photodiode. A polynomial fit is also shown.
A description of our nanosecond system which is used to induce temperature jump is shown in figure 2.1.
The idler wavelength of 1.454 μm is chosen for a maximum water absorption (figure 2.2) measured by a PbSe photodiode.
2.1.3. Probe laser system
The probe pulse must be tunable in the far UV, especially around 220 nm where the ratio CD/absorption is the greatest. We use a sub-picosecond source based on a 1 kHz amplified Titanium-Sapphire system followed by several stages of BBO based optical
Nanosecond Nd:YAG laser:
Pumped by flashs λ = 532 nm, f = 30 Hz
Epulse = 550 mJ, pulse duration = 6 ns
GCR4 (Spectra Physics) Nanosecond BBO-OPO : ωp=ωsig + ωidl GWU (Spectra-Physics) Pump Signal (λ = 839 nm) Idler (λ = 1454 nm)
parametric amplification and frequency-mixing. This source delivers 40nJ pulses tunable between 220 and 350 nm.
2.1.3.1. 1kHz Titanium-Sapphire laser system
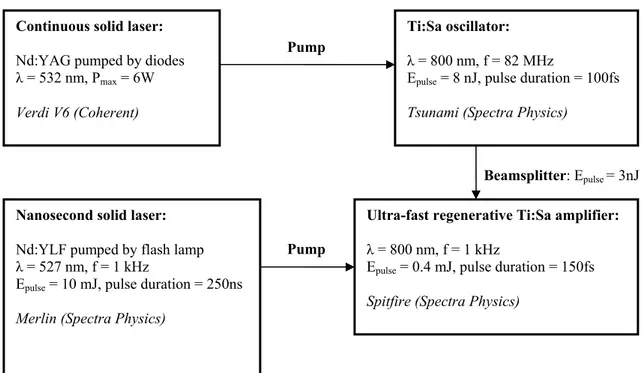
The schematic representation of our 1 kHz Titanium-Sapphire system is depicted in figure 2.3. The principle of this laser system can be briefly described as follows:
• A crystal rod of titanium-doped sapphire is placed in a cavity of an oscillator. It is pumped by a continuous solid laser with a wavelength of 532 nm and produces a large emission spectrum centered at 800 nm. The cavity of the oscillator is designed to allow all the longitudinal modes included in the spectrum and a self-mode-locking regime that is based on the optical Kerr effect induces these modes to be synchronized in phase [99]. This mode-locked oscillator generates ultra-short pulses tunable between 700 and 950 nm with a duration of 100 fs and a repetition frequency of 82 MHz. The pulse wavelength is normally tuned close to 800 nm where the maximum gain and laser efficiency are obtained.
• These pulses are sent to a regenerative amplifier [100] which is pumped by a nanosecond solid laser with frequency-doubled pulses at 527 nm and a pulse repetition of 1kHz. Before passing through the amplifier medium which contains a crystal of titanium-doped sapphire, the pulses are chirped and temporally stretched to a much longer duration by a factor of 103 to 105 by means of a grating pair (the stretcher). This reduces the peak power to a level that is sufficiently low compared with the intensity limit of gigawatts/cm2, to avoid serious damage to the gain medium through nonlinear processes. After the gain medium, another grating pair (the compressor) is used to remove the chirp and temporally compress the pulses to a duration similar to the input pulse duration.
This laser system provides pulses with a duration of 150 fs, a repetition rate of 1kHz and an energy of about 0.4mJ. Such laser beam is intense enough for latter nonlinear optic processes.
Figure 2.3 Schematic representation of the 1 kHz Titanium-Sapphire system 2.1.3.2. Generation of tunable UV pulses
In order to convert the 800 nm light into a tunable UV light, several intermediate stages of BBO based optical parametric amplification and frequency-mixing are required and described in this section:
• White-light generation from the 800 nm light
• An optical parametric amplification stage that amplifies the visible wavelengths of the continuum
• A sum frequency generation stage to attain tunable UV pulses
2.1.3.2.1. White-light generation
White-light generation by focusing femtosecond laser pulses with several microjoules of energy into a transparent condensed medium is a well-known and often-used nonlinear optics effect. There are several complex mechanisms such as Raman effect, Brillouin effect and self-phase modulation that have been introduced to explain this phenomenon.
The starting point is the self-phase modulation: According to optical Kerr effect, when passing through a medium, an intense ultra-short pulse I(t) can induces a change in refractive
Ti:Sa oscillator:
λ = 800 nm, f = 82 MHz
Epulse = 8 nJ, pulse duration = 100fs
Tsunami (Spectra Physics)
Continuous solid laser:
Nd:YAG pumped by diodes λ = 532 nm, Pmax = 6W
Verdi V6 (Coherent)
Pump
Nanosecond solid laser:
Nd:YLF pumped by flash lamp λ = 527 nm, f = 1 kHz
Epulse = 10 mJ, pulse duration = 250ns
Merlin (Spectra Physics)
Ultra-fast regenerative Ti:Sa amplifier:
λ = 800 nm, f = 1 kHz
Epulse = 0.4 mJ, pulse duration = 150fs
Spitfire (Spectra Physics)
Pump
I n n I n( )= 0+ 2 (2.1) with ( ) exp( 2/ 2) 0 t τ I t I = − , (2.2)
where we suppose that the pulse has a Gaussian form with a full width at half maximum τ , where n is the linear refractive index of the medium, and 0 n is the second-order nonlinear 2
refractive index.
We obtain the instantaneous phase φ( zt, ) of the electric field of the pulse
z I n c t z t, ) ( ) ( 0 0 ϖ ϖ φ =− + , (2.3) where ϖ0 is the central frequency of the pulse and z is the path length that the pulse travelled in the medium. In the same manner, one can write the instantaneous frequency
t z t I n c t z t z t ∂ ∂ − = ∂ ∂ − = ( , ) (, ) ) , ( 0 0 2 ω ω φ ϖ . (2.4)
Note that in the case of a pulse with a Gaussian profile, the instantaneous frequency becomes ⎥⎦ ⎤ ⎢⎣ ⎡ − ∂ ∂ − = 2 exp( / ) ) , ( 2 2 0 2 2 0 0 τ τ ω ϖ ϖ n zI t c t z t . (2.5)
Hence, the instantaneous frequency is red (blue) shifted on the leading (trailing) edge of the pulse. As a result, new frequencies are created with central frequency ϖ0, leads to
superbroadening of the spectrum. It is the phenomenon of self-phase modulation behind the formation of continuum spectrum. This resulting continuum spectrum is interesting for us because it allows us to select one wavelength from the spectrum for latter process of optical parametric amplification.
In our case, we use a Sapphire crystal with a thickness of 1 cm for the generation of a continuum spectrum. The resulting spectrum extends to the visible domain from the original infrared spectrum. An attenuator is inserted to vary the intensity of the infrared beam focusing onto the crystal. This enables the control of the stability of the continuum spectrum, ensuring a stability of the whole nonlinear optics system.
2.1.3.2.2. Optical parametric amplification
Optical parametric amplification (OPA) is a phenomenon of second-order nonlinear optical interaction. Its principle is illustrated in figure 2.4. OPA allows us to select and amplify a wavelength from the continuum.
Figure 2.4 Principle of optical parametric amplification.
The focalization of a faint “signal” beam and an intense “pump” beam into a same point on a nonlinear crystal with correct alignment induces an amplification of the “signal” beam and generation of another beam called “idler”.
Following the law of energy conservation, we have i
s p ν ν
ν = + , (2.6)
where ν , p νsand νiare the frequencies of the pump, signal and idler beams respectively. The amplification of the signal beam depends not only on the intensity of the pump but also on the characteristics of the crystal (material, thickness) and the alignment which needs to be in good agreement with two important conditions:
• Phase-matching: kp =ks +ki. When the condition is respected, the waves stay in phase while propagating in the crystal and constructively interfere.
• Group velocity matching: vrg,p =vrg,s. It requires the pump and signal beam to propagate with the same velocity in superposition in the crystal for an effective energy exchange.
Note that in all cases from now on, the p, s and i indices represent the pump, signal and idler beams.
In our case, we use a BBO crystal pumped by a 400 nm light beam (SHG of the 800 nm infrared beam) for amplifying the wavelengths of the continuum. Here, we are put in the case of type I phase matching, in which the pump and signal need to be polarized along the
BBO
Pump Signal
Signal Idler