HAL Id: tel-01082424
https://pastel.archives-ouvertes.fr/tel-01082424
Submitted on 13 Nov 2014
HAL is a multi-disciplinary open access
archive for the deposit and dissemination of sci-entific research documents, whether they are pub-lished or not. The documents may come from
L’archive ouverte pluridisciplinaire HAL, est destinée au dépôt et à la diffusion de documents scientifiques de niveau recherche, publiés ou non, émanant des établissements d’enseignement et de
Essays in Behavioral Finance
Hedi Benamar
To cite this version:
Hedi Benamar. Essays in Behavioral Finance. Business administration. HEC, 2014. English. �NNT : 2014EHEC0004�. �tel-01082424�
ECOLE DES HAUTES ETUDES COMMERCIALES DE PARIS
Ecole Doctorale « Sciences du Management/GODI » - ED 533
Gestion Organisation Décision Information
« Essays in Behavioral Finance »
THESE
présentée et soutenue publiquement le 4 juillet 2014 en vue de l’obtention du
DOCTORAT EN SCIENCES DE GESTION
Par
Hedi BENAMAR
JURY
Président du Jury : Monsieur Denis GROMBProfesseur
INSEAD, Fontainebleau – France
Directeur de Recherche : Monsieur Thierry FOUCAULT Professeur, HDR
HEC Paris – France
Rapporteurs : Monsieur Maxime MERLI
Professeur des Universités EM Strasbourg – France Monsieur Sébastien POUGET Professeur
IAE, Université de Toulouse Capitole 1– France
Suffragant : Monsieur Laurent CALVET Professeur
Ecole des Hautes Etudes Commerciales
Le Groupe HEC Paris n’entend donner aucune approbation ni improbation aux
opinions émises dans les thèses ; ces opinions doivent être considérées
Remerciements
Je tiens tout d’abord à remercier mon directeur de thèse Thierry Foucault pour son soutien absolument fondamental durant ces années de thèse à HEC. En le cotoyant, j’ai eu la chance de bénéficier de sa grande curiosité intellectuelle, de la finesse de son raisonnement économique et de son expertise du monde de la recherche académique en Finance. Sans son aide, cette thèse n’aurait sans doute pas vu le jour.
J’adresse aussi mes plus sincères remerciements aux membres de mon jury de thèse. Merci infiniment, donc, à Maxime Merli et Sébastien Pouget d’avoir accepté d’être rapporteurs, et à Laurent Calvet et Denis Gromb d’avoir accepté d’être suffragants. J’ai souvent trouvé dans leurs travaux une source d’inspiration essentielle pour améliorer mon travail de recherche.
Je souhaiterais aussi remercier tous les membres du département de Finance d’HEC Paris, professeurs et doctorants, pour nos nombreuses discussions et pour l’ambiance particulièrement collégiale qui régnait au département. Les moments passés avec vous tous resteront des temps forts de mon passage à HEC. En particulier, j’ai une dette morale envers Ulrich Hege, Johan Hombert, Stefano Lovo, Ioanid Rosu et David Thesmar pour leurs commentaires essentiels sur mon travail, et leur soutien.
Je souhaiterais de plus exprimer ma gratitude envers la fondation HEC, l’Institut Europlace de Finance et le LABEX pour leur aide financière, et envers le courtier français anonyme qui m’a permis de développer mon travail de thèse.
Enfin, sur un plan plus personnel, je dois beaucoup à femme Elise, mon petit garçon Ulysse, ma famille et à mes amis. Ils ont plus que contribué à l’achèvement de cette merveilleuse aventure doctorale. Qu’ils trouvent en ces quelques lignes l’expression de ma gratitude la plus sincère.
Contents
Remerciements 3 Introduction 10 Résumé en français 16 Chapitre premier . . . 16 Chapitre second . . . 19 Chapitre troisième . . . 23 1 Chapter one 26 1.1 Introduction . . . 28 1.2 Testable Hypothesis . . . 34 1.3 Data . . . 361.3.1 The Brokerage Dataset . . . 36
1.3.2 Variable Definition . . . 38
1.4 Methodology and Identification Strategy . . . 40
1.4.1 Trader+ . . . 40
1.4.2 Identification Strategy . . . 42
1.4.3 The Control Group . . . 44
1.5 Results . . . 47
1.5.1 Trading performance . . . 47
1.5.3 Trading Volume . . . 50
1.6 Robustness Analyses . . . 53
1.6.1 Standard difference-in-differences estimation . . . 53
1.6.2 Placebo Treatment . . . 54 1.7 Alternative Explanations . . . 55 1.7.1 Dynamic Self-Selection . . . 55 1.7.2 Trading Speed . . . 57 1.7.3 Overconfidence . . . 58 1.8 Conclusion . . . 59 1.9 Figures . . . 64 1.10 Tables . . . 76 2 Chapter Two 86 2.1 Introduction . . . 88 2.2 Methodology . . . 92
2.2.1 The brokerage dataset . . . 92
2.2.2 Investors’ round-trips . . . 94
2.3 Results . . . 97
2.3.1 Ranking investors by trading performance . . . 97
2.3.2 Differences in trading behavior across investors . . . 99
2.3.3 Is there persistence in trading performance? . . . 102
2.4 Limits-to-arbitrage and liquidity provision . . . 104
2.5 Conclusion . . . 107
2.6 Figures . . . 110
2.7 Tables . . . 114
3 Chapter Three 124 3.1 Introduction . . . 126
3.2 Data . . . 130
3.2.1 The brokerage dataset . . . 130
3.2.2 Earnings Announcements . . . 131
3.3 Methodology . . . 132
3.3.1 Event Study . . . 132
3.3.2 Investors’ round-trips . . . 134
3.4 Results . . . 138
3.4.1 Abnormal trading volume and participation around earnings announce-ments . . . 138
3.4.2 Individual trading performance and trading patterns around earnings announcements . . . 139
3.5 Conclusion . . . 143
3.6 Figures . . . 146
3.7 Tables . . . 150
List of Tables
1.1 Summary statistics of the brokerage dataset . . . 77
1.2 Estimation of the probability of using Trader+ at least once after June 2003 (using pre-treatment data only) . . . 78
1.3 Comparisons between treated investors and control investors obtained via propen-sity matching . . . 79
1.4 Summary statistics on investors’ trading channels and investors’ order choice . . 80
1.5 Does the display format of market data matters for retail investors? . . . 81
1.6 Robustness: standard difference-in-difference estimation . . . 82
1.7 Robustness: placebo test . . . 83
1.8 Heterogeneous treatment effects . . . 84
1.9 Dependent variables . . . 85
2.1 Summary statistics of the brokerage dataset . . . 115
2.2 Identification of Trading Strategies . . . 116
2.3 Sharpe ratios summary statistics . . . 116
2.4 Trading performance and liquidity provision . . . 117
2.5 Order choice . . . 118
2.6 Contrarian behavior . . . 119
2.7 Round-trips durations . . . 120
2.8 Performance Persistence . . . 121
2.10 Trading performance and limits-to-arbitrage II . . . 123
3.1 Summary statistics of the brokerage dataset . . . 151
3.2 Summary Statistics - Sample . . . 152
3.3 Summary Statistics - Announcement Time . . . 153
3.4 Identification of Trading Strategies . . . 154
3.5 Round-Trips . . . 155
3.6 Abnormal Trading Activing around Earnings Announcements . . . 156
List of Figures
1.1 Investors’ decision tree . . . 65
1.2 Main trading channels used by the broker customers before Trader+ . . . 66
1.3 Screenshot of Trader+ . . . 67
1.4 Orders submitted by treated and matched control investors, 1999-2010 . . . 68
1.5 Monitoring activity and performance . . . 69
1.6 Monitoring activity and performance: market orders vs. limit orders . . . 70
1.7 Monitoring activity and order choice . . . 71
1.8 Monitoring activity and trading volume . . . 72
1.9 Monitoring activity and trading horizon . . . 73
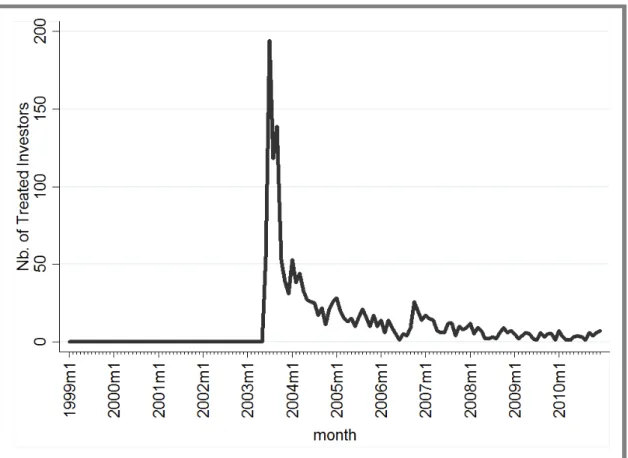
1.10 Dynamics of entry into treatment . . . 74
1.11 Causes before consequences, or consequences before causes? . . . 75
2.1 Aggregate Net Imbalance: Top Decile . . . 111
2.2 A tiny market maker . . . 112
2.3 Abnormal returns dynamics over the last decade . . . 113
3.1 Abnormal trading activity and abnormal market participation around earnings announcements . . . 147
3.2 Profit-Taking patterns on and after the announcement date . . . 148
Introduction
In the traditional finance paradigm, the homo economicus is meant to be rational: he correctly updates and processes new information according to Bayes’ rule (rational beliefs), and he makes decisions that are consistent with the Subjective Expected Utility model defined by Savage more than 50 years ago (rational preferences) (Barberis and Thaler[2003]).
However, over the last decades the growing behavioral finance literature has consistently pointed out that the fundamental axioms of the Expected Utility (EU) paradigm generate em-pirical predictions that do not appear to be consistent with the data.
Barberis and Thaler[2003]recall that, to address these difficulties, the Behavioral Finance literature uses two “building blocks”. The first one is the relaxation of some problematic assump-tions of the rational paradigm. For example, if processing information is costly for individuals, then their financial decisions may be more consistent with bounded-rationality than full ratio-nality (Simon[1955],Barber and Odean[2007]). In other words, psychology can explain the observed deviations from the normative rational models. In my thesis, I consider two possible deviations from the rational setup in the first chapter (bounded rationality) and third chapter (disposition effect).
The second building block is limits to arbitrage (seeShleifer and Vishny[1997],Gromb and Vayanos [2002]andGromb and Vayanos[2010]). Limits-to-arbitrage expresses the fact that prices deviates from their fundamental “true” value because of the actions of irrational agents (“noise traders") in the market. In this context, arbitrage opportunities may take a lot of time
and may be very costly to be exploited by rational arbitrageurs. I consider some important implications of the limits-to-arbitrage paradigm for retail investors in the second chapter of my thesis.
Broadly speaking, understanding the financial decisions of individuals is fundamental, for at least two reasons according toBarberis and Thaler[2003]. First, today more and more individ-uals are investing in equities because of lowering costs of entry into the market and second, the recent reforms in the pension sector imply that individuals are more and more responsible for their financial well being at retirement time. Therefore, perhaps not surprisingly, to understand how individuals use financial instruments and make financial decisions, Household Finance has quickly emerged as a new and very dynamic field (Campbell[2006]).
Often, the literature in this field has focused on general trading activity and portfolio choices made by individuals. In particular researchers have already established several links between particular psychological traits of investors and their trading behavior. For instance, overconfi-dence reduces and self-monitoring increases trading performance (Biais et al.[2005]), retail investors are prone to the disposition effect (Barberis and Xiong[2009],Boolell-Gunesh, Broi-hanne, and Merli[2012]) and confirmation bias among investors can generate bubbles, crashes, and reversals (Pouget and Villeneuve [2012]. In the same vein, individual variables such as IQ (Grinblatt, Keloharju, and Linnainmaa[2011]), smartness (Korniotis and Kumar [2013]) and financial sophistication (Boolell-Gunesh, Broihanne, and Merli[2009],Calvet and Sodini [2014]) are strongly associated with more efficient and better financial decisions at the individ-ual level.
Other papers have more focused on the welfare implications of those “investment mistakes” (Barber, Lee, and Odean[2006]). The usual stylized facts are that individuals are on average insufficiently diversified (Jacobs, Muller, and Weber[2013]), trade too much and do not par-ticipate enough in the financial market. However, this average behavior hides in reality a very large herogeneity in trading skills among the retail population. For instance, using Swedish government records covering all Swedish households between 1999 and 2002,Calvet,
Camp-bell, and Sodini[2007]argue that while a few households are indeed poorly diversified, most of them are through international diversification. Similarly, whileBarber and Odean[2000]
argue that active retail investors trade too much to their detriment,Linnainmaa[2011]suggest that this intense trading activity hides some important learning mechanisms.
In this context, another interesting vein of research has recently appeared. In their “questions for further research” chapter,Parlour and Seppi[2008]argue that understanding how individ-uals choose between using market or limit orders when trading is a “useful window through which to observe investor heterogeneity” such as private trading motives or urgency for trading. This new approach is particularly interesting because nowadays most of equity and derivatives exchanges around the world (such as NYSE-Euronext, the Nasdaq or Xetra) are electronic limit order markets, which allow the submission of market orders and limit orders.
Limit orders specify a number of shares and a price. Because of their pre-specified price, they must be matched with opposite market orders in order to be executed. In the meantime they are stored with other unexecuted limit orders in the limit order book, which they will exit if they are hit by subsequent orders or cancelled by the order submitter. Market orders specify a quantity, but no particular price. They are matched with the best opposite limit orders, in terms of price, available at the time of their submission and with respect to time and price priority rules.
In this new literature,Linnainmaa[2010]is a pioneer work. He reaches the important conclu-sions that the use of limit orders by individual can alter the inferences on individual’s skill that researchers derive from the data. Similarly,Kelley and Tetlock[2013]study the role of retail investors in stock pricing by separately examining the performance of retail executed market orders vs. retail executed limit orders, and obtain different implications about the information content of each order type.
The scope of my thesis was to understand more deeply which important factors can explain the individual financial decisions. Using a brokerage dataset which contains more than 15
million investor trades at the daily level from 1999 to 2010, I have had the opportunity to contribute a bit to this fascinating literature.
References
Barber, B., Lee Y.and Liu, Y., and Odean, T. (Nov. 2006). “Just How Much Do Individual Investors Lose by Trading?” Review of Financial Studies 22.2.
Barber, B. and Odean, T. (Dec. 2007). “All That Glitters: The Effect of Attention and News on the Buying Behavior of Individual and Institutional Investors”. Review of Financial Studies 21.2.
Barber, B. and Odean, T. (2000). “Trading is hazardous to your wealth: The common stock investment performance of individual investors”. The Journal of Finance 55.2.
Barberis, N. and Thaler, R. (2003). “A survey of behavioral finance”. Handbook of the Economics
of Finance. Ed. by G. M. Constantinides, M. Harris, and R. Stulz.
Barberis, N. and Xiong, W. (2009). “What Drives the Disposition Effect? An Analysis of a Long-Standing Preference-Based Explanation”. The Journal of Finance June.
Biais, B., Hilton, D., Mazurier, K., and Pouget, S. (2005). “Judgemental Overconfidence, Self-Monitoring, and Performance in an Experimental Financial Market”. Review of Economic
Studies72.2.
Boolell-Gunesh, S., Broihanne, M., and Merli, M. (2009). “Disposition effect, investor sophisti-cation and taxes: Some French Specificities”. Finance 30.
– (2012). “Sophistication of Individual Investors and Disposition Effect Dynamics”. Finance 33. Calvet, L. E., Campbell, J. Y., and Sodini, P. (Oct. 2007). “Down or Out: Assessing the Welfare
Calvet, L. E. and Sodini, P. (2014). “Twin Picks : Disentangling the Determinants of Risk-Taking in Household Portfolios”. The Journal of Finance.
Campbell, J. (2006). “Household Finance”. Journal of Finance 61.4.
Grinblatt, M., Keloharju, M., and Linnainmaa, J. (2011). “IQ, trading behavior, and perfor-mance”. Journal of Financial Economics.
Gromb, D. and Vayanos, D. (2002). “Equilibrium and welfare in markets with financially con-strained arbitrageurs”. Journal of financial Economics 66.
– (Dec. 2010). “Limits of Arbitrage”. Annual Review of Financial Economics 2.1.
Jacobs, H., Muller, S., and Weber, M. (Aug. 2013). “How should individual investors diversify? An empirical evaluation of alternative asset allocation policies”. Journal of Financial Markets. Kelley, K. and Tetlock, P. (2013). “How wise are crowds? Insights from retail orders and stock
returns”. The Journal of Finance January.
Korniotis, G. M. and Kumar, A. (Jan. 2013). “Do Portfolio Distortions Reflect Superior Informa-tion or Psychological Biases?” Journal of Financial and Quantitative Analysis 48.01.
Linnainmaa, J. (2010). “Do limit orders alter inferences about investor performance and be-havior?” The Journal of Finance LXV.4.
– (2011). “Why Do (Some) Households Trade So Much?” Review of Financial Studies 24.5. Parlour, C. A. and Seppi, D. J. (2008). “Limit Order Markets : A Survey”. Handbook of Financial
Intermediation and Banking5.33. Ed. by A. V. Thakor and A. W. A. Boot.
Pouget, S. and Villeneuve, S. (Mar. 2012). “A Mind is a Terrible Thing to Change: Confirmation Bias in Financial Markets”. 720.
Shleifer, A. and Vishny, R. (1997). “The limits of arbitrage”. The Journal of Finance LII.1. Simon, H. (1955). “A behavioral model of rational choice”. The Quarterly Journal of Economics
Résumé en français
Chapitre premier
Motivation
Les régulateurs sont de plus en plus préoccupés non seulement par la quantité d’information financière accessible aux investisseurs individuels, mais aussi par la façon avec laquelle cette information est affichée, car l’on sait désormais que le format d’affichage peut influencer les décisions financières individuelles.1
Dans le premier chapitre, je teste si le format d’affichage des données de marché utilisées par les investisseurs individuels affecte leur performance boursière. Cette question me semble importante car il est fondamental d’identifier quels sont les déterminants des décisions finan-cières des ménages (Campbell[2006];Calvet, Campbell, and Sodini[2007]). Et, en particulier, la grande hétérogénéité observée dans les données en termes de performance boursière des ménages reste encore à expliquer.
Pour comprendre pourquoi le format d’affichage des données de marché peut avoir son importance pour les investisseurs individuels, rappelons que lorsque les investisseurs ont choisi une allocation de portefeuille, ils doivent mettre en œuvre les stratégies de trading nécessaires
1VoirBenartzi and Thaler[1999],Saez[2009],Looney and Hardin[2009]etKaufmann, Weber, and Haisley
pour rééquilibrer leurs inventaires. Ces stratégies de trading impliquent nécessairement un choix entre les ordres de marché et les ordres à cours limité.
Si les investisseurs utilisent des ordres à cours limité, ils doivent alors surveiller le marché, après la soumission de leur ordre, afin de réviser ou annuler leur ordre dans le but d’atténuer les problèmes de sélection adverse et les risques de non-exécution qui découlent de l’utilisation d’ordres de ce type.
En d’autres termes, les investisseurs doivent surveiller le marché et leurs ordres à cours limité pour améliorer leur performance boursière sur ces ordres. L’hypothèse de travail de mon premier chapitre est donc la suivante: si un format d’affichage des données de marché rend cette de surveillance du marché plus efficace, toute chose égale par ailleurs, il devrait également améliorer la performance boursière des ordres à cours limité des individus.
Méthodologie
Pour tester cette hypothèse, j’exploite un contexte expérimental assez unique en son genre dans lequel la quantité d’informations de marché accessible aux investisseurs est restée inchangée, alors que son format d’affichage a subi un changement exogène à un moment donné. Plus précisément, j’utilise l’introduction en Juin 2003 par une grande maison de courtage française d’un logiciel de trading (ci-après de Trader+). Le logiciel permettait d’afficher les données de marché d’une manière plus efficace car il affichait simultanément tous les items d’information pertinents (données du marché et les ordres en cours des investisseurs) sur un écran person-nalisé par l’utilisateur. La présentation simultanée de ces items permet aux investisseurs de mieux comprendre comment les mouvements des prix des actions sont liés les uns aux autres et devrait aider les investisseurs à mieux assimiler cette information lors de la surveillance de leurs ordres à cours limité.
Vu que le logiciel affiche ces données de marché plus efficacement qu’auparavant, je m’attends donc à ce que les utilisateurs de Trader+ “monitorent” mieux leurs ordres à cours limité, ce
qui devrait avoir pour effet d’augmenter leur performance boursière sur ces ordres. Afin de tester ces implications, j’utilise un estimateur par différence-de-différences où un groupe de traitement, contenant les individus qui utilisent le logiciel au moins une fois, sont appariés (avec un algorithme par score de propension) avec des investisseurs contrôle similaires qui,
eux, n’utilisent jamais le logiciel.
Résultats
Je montre que le format d’affichage des données de marché a un impact fort sur le comporte-ment des investisseurs individuels. Comme dansGrinblatt, Keloharju, and Linnainmaa[2011]
etLinnainmaa[2010], pour chaque ordre d’achat et de vente, je calcule une mesure de perfor-mance qui a souvent été utilisée dans la littérature comme un proxy pour le risque de sélection adverse encouru par les investisseurs qui soumettent des ordres à cours limité. Mes résultats suggèrent un effet positif de Trader+ de l’ordre de 10 points de base sur les returns intraday des ordres à cours limités.
L’ampleur économique de ce résultat est plutôt importante à la lumière des études antérieures sur la performance boursière des investisseurs. Par exempleGrinblatt, Keloharju, and Linnain-maa[2011]montrent que les returns intradays des investisseurs finlandais ayant un QI élevé (dans le top 5 % de la distribution) surperforment les personnes à faible QI d’environ 11 points de base, ce qui suggère que le format d’affichage des données de marché a un effet sur la performance boursière similaire aux capacités cognitives individuelles.
Dans le premier chapitre, j’explique cette augmentation de la performance boursière en proposant que l’amélioration du format d’affichage dûe à Trader+ permet aux individus de surveiller le marché plus efficacement et, par conséquent, de placer/réviser/annuler leurs or-dres à cours limités de façon plus optimale. Cette augmentation de la performance a deux conséquences, si l’on se réfère aux les modèles classiques de la microstructure des marchés.
Premièrement, les investisseurs "traités" devraient utiliser les ordres à cours limités plus souvent qu’auparavant, car il est plus facile de gérer ces ordres avec Trader+. C’est ce que je trouve dans les données. Deuxièmement, je m’attends à ce que les investisseurs traités soient en mesure de repérer des opportunités de trading à court terme qui étaient probablement trop difficiles à saisir avant. Ce changement de comportement devrait conduire à une diminution de l’horizon de trading boursier individuel, défini comme le temps nécessaire pour déboucler une ligne de trading ouverte. Cette implication est aussi confirmée dans les données.
En résumé, les changements de comportement boursier observés dans le groupe traité, après l’introduction du logiciel, sont compatibles avec une explication basée sur les coûts cognitifs des l’activité de surveillance du marché.
Chapitre second
Motivation
Dans le deuxième chapitre, j’explique tout d’abord que des études très récentes suggèrent que les investisseurs individuels utilisent les ordres à cours limité afin d’être apporteurs de liquidités pour les investisseurs institutionnels qui ont besoin de déboucler leurs positions rapidement (Kaniel, Saar, and Titman[2008],Kelley and Tetlock[2013]). Dans ce contexte, on s’attend donc à ce que les investisseurs institutionnels fassent des concessions sur le prix d’échange boursier afin d’inciter les investisseurs individuels à remplir leur rôle de contrepartie (Grossman and Miller[1988],Campbell, Grossman, and Wang[1993]).
Cependant, il n’est pas clair dans la littérature actuelle si les individus bénéficient réellement,
après coûts de transaction, de l’utilisation de ces stratégies de trading. Par exemple, Kelley and Tetlock[2013]reconnaissent que “[leurs] données ne contiennent pas les portefeuilles des
individus, ou même les coûts de transaction encourus, ce qui exclut toute analyse directe de la performance brute ou nette des investisseurs particuliers dans[leur] échantillon”. Cette question
est néanmoins importante car il est difficile d’expliquer la forte hétérogénéité en termes de performance boursière des individus qui a été identifiée dans la littérature (Grinblatt, Keloharju, and Linnainmaa [2011], Barber et al. [2013]). En outre, du point de vue du bien-être des investisseurs, il est fondamental de savoir si les investisseurs particuliers s’engagent ou non dans des stratégies de trading qui les conduisent à des lourdes pertes financières.
L’objectif de mon deuxième chapitre est donc de tester directement si ces stratégies appor-teuses de liquidités peuvent être une source de profits éventuelle pour les investisseurs partic-uliers actifs qui les implémentent. Pour ce faire, j’exploite deux caractéristiques uniques de mes données.
Tout d’abord, les données contiennent la majeure partie des frais de transaction payés par les investisseurs particuliers. Deuxièmement, les investisseurs actifs dans ma base semblent se comporter comme des “teneurs de marché” au sens traditionnel du terme: ils utilisent beaucoup d’ordres à cours limité et ont des périodes de détention des actifs financiers plus courtes que les autres investisseurs. Par conséquent, en me concentrant sur les investisseurs les plus actifs de mon échantillon, je considère en quelque sorte la population idéale pour comprendre si être apporteur de liquidités, pour un individu, peut être profitable ou pas.
Méthodologie
Pour aborder cette question de recherche, la difficulté principale est de bien mesurer la rentabil-ité des stratégies de trading individuelles, ce qui est loin d’être évident. Par exemple, étant données les grandes disparités en termes d’ horizons de trading, de motivations pour trader et en termes de stratégies employées, les chercheurs sont souvent forcés de choisir des règles ad-hoc arbitraires comme évaluer la performance d’un trade sur un horizon fixé par le chercheur (jour, semaine, mois). Ces choix peuvent potentiellement masquer de nombreuses informations
Afin de tenter de surmonter ces difficultés, je tire profit de la structure en panel de mon jeu de données en adaptant une méthodologie décrite initialement parSchlarbaum, Lewellen, and Lease[1978]. La méthode, simple et puissante, repose sur l’identification des aller-retours effectivement implémentés et exécutés par les investisseurs. C’est une approche “hard-data” qui ne fait que très peu d’hypothèses: les données parlent pour les individus.
Résultats
Les individus peuvent-ils générer des profits en utilisant des stratégies apporteuses de liquidités? Je classe les investisseurs dans mon échantillon selon les ratios de Sharpe de leurs stratégies de trading et je trouve que seuls les investisseurs classés dans les trois déciles supérieurs en termes de performance sont en mesure d’obtenir des rendements positifs anormaux -déduction faite
des frais- en fournissant de la liquidités au marché. Un fait intéressant ressort de l’étude: ces top-traders actifs semblent être beaucoup plus contrariants que les autres groupes de traders actifs. Ce comportement suggère que ces retails se comportent bien comme des teneurs de marché en achetant des actions quand il y a une pression à la vente et en vendant quand il y a une pression à l’achat.
Ces résultats confirment certaines études précédentes, comme celle deGrinblatt, Keloharju, and Linnainmaa[2011]qui documente que les individus ayant un QI élevé en Finlande sont plus contrariants que les investisseurs ayant un QI faible, sans toutefois pouvoir trancher (faute de pouvoir utiliser les côuts de transactions), s’il s’agit d’un comportement rationnel ou pas. Ils affirment qu’ en vendant des actions près des maxima mensuels et en achetant près des minima mensuels, les investisseurs au QI élevé dans leur échantillon suivent probablement une stratégie de trading rationnelle apporteuse de liquidités.
Afin de dissocier la chance des compétences réelles de trading, je teste ensuite si les perfor-mances individuelles sont persistantes. J’obtiens un niveau significatif de persistance au cours du temps, en ligne avec les résultats présentés dans d’autres études récentes. Il semble donc
probable que certains investisseurs dans mon échantillon ont des compétences des trading authentiques.
Ensuite, j’étudie si certaines frictions particulières des marchés financiers permettent à ces top traders de générer des profits après coûts de transaction. En effet, il peut sembler surprenant qu’un sous-ensemble d’investisseurs individuels, aussi doués soient-ils, est en mesure de saisir des opportunités d’arbitrage avant d’autres arbitrageurs plus sophistiqués, tels que les fonds spéculatifs ou des investisseurs institutionnels. Une possibilité est que les investisseurs les plus performants dans mon sample fournissent de la liquidité lorsque les arbitragistes institutionnels sont plus contraints et donc pas en mesure d’exploiter les opportunités d’arbitrage disponibles.
Je fournis dans mon deuxième chapitre des tests empiriques en faveur de cette explication liée au concept de “limites-à-l’arbitrage” (Shleifer and Vishny[1997]) de deux façons différentes. En particulier, pour chaque aller-retour dans mon échantillon je récupère le niveau de volatilité intraday des actions négociées le jour où cet aller-retour donné a été initié.
En effet, en conditionnant par la date de départ d’un aller-retour il est probable que j’identifie les moments exacts où les individus cherchent activement à exploiter une opportunité de trading. J’utilise la volatilité intraday car elle est généralement utilisée comme un indicateur du risque d’arbitrage: plus la volatilité est élevée, plus le risque d’arbitrage est fort (Pontiff[2006] et
Lam and Wei[2011]) et plus la liquidité est faible (Hameed, Kang, and Viswanathan[2010]et
Nagel[2012]).
Je montre que les retails les plus performants initient leurs aller-retours les plus rentables lorsque le risque d’arbitrage est particulièrement élevé. De façon intéressante, cette relation positive entre la volatilité intraday et la rentabilité future ne tient pas pour les retails les moins performants du sample, ce qui suggère que seuls les traders les plus doués sont en mesure d’exploiter les moments où le marché manque de liquidités.
Chapitre troisième
Motivation
Le point de départ du troisième chapitre est qu’il existe toute une littérature qui montre que le flux d’ordres agrégé des investisseurs individuels est à même de prédire les rendements futurs des actions autour des annonces de résultats (Kaniel, Liu, et al. [2012],Kelley and Tetlock [2013]).
Hélas, ces études exploitent des données de courtage qui ne permettent pas de suivre un même investisseur au fil du temps. Autrement dit, les auteurs des deux études ci-dessus ne peuvent tout simplement pas identifier les stratégies qui sont effectivement implémentées par des investisseurs individuels avant, pendant et après l’annonce.
Cependant, l’identification des stratégies de trading mises en œuvre par les individus autour de l’annonce est importante, pour au moins deux raisons.
Tout d’abord, identifier les stratégies de trading et évaluer leur performance peut combler le fossé entre les découvertes récentes deKelley and Tetlock[2013]etKaniel, Liu, et al.[2012], qui apportent une lumière positive sur les compétences de trading des individus, et la littérature précédente qui, généralement, dépeint les investisseurs particuliers comme “bruiteurs naïfs”.
En particulier, le fait que le flux d’ordres agrégé des retails a un certain pouvoir prédictif sur les futurs rendements boursiers autour des annonces de résultats n’implique pas nécessairement que certains investisseurs particuliers sont en mesure de réaliser des gains de trading autour de l’annonce (après coûts de transactions et ajustement pour le risque).
Deuxièmement, identifier les stratégies qui sont mises en œuvre autour de l’annonce peut aider à comprendre l’origine de plusieurs puzzles empiriques qui ont été décrits dans la littéra-ture. Par exemple, à la fois le “earnings announcement premium” (Frazzini and Lamont[2007]) et le “earnings announcement drift” (Taylor[2010]etKaniel, Liu, et al.[2012]) semblent être
dûs (du moins en partie) au comportement boursier des investisseurs individuels. Le problème, comme souvent, est que les données disponibles ne permettent pas aux auteurs de ces études de suivre les investisseurs individuels au cours du temps, et ainsi de confirmer que certaines stratégies implémentées par les retails peuvent effectivement exercer suffisamment de pression sur les prix pour générer les deux patterns ci-dessus.
Méthodologie
Le but de ce chapitre est donc d’identifier directement les stratégies de trading mises en œuvre par les investisseurs individuels autour des annonces de résultats, et d’évaluer leur performance en contrôlant pour les effets fixes individuels.
J’adopte dans ce chapitre une méthodologie standard “d’event study” (MacKinlay [1997],
Frank and Goyal[2007]) et pour évaluer la rentabilité des stratégies de trading exécutés par des individus, j’adopte la méthodologie décrite dansSchlarbaum, Lewellen, and Lease[1978].
Résultats
J’obtiens trois principaux résultats. Tout d’abord, je trouve que les investisseurs augmentent fortement à la fois la participation au marché et le volume des transactions avant, pendant et peu de temps après l’annonce. Ce résultat est cohérent avec les papiers deVieru et al.[2006],
Taylor[2010] etEtheber, Hennen, and Meyer[2012].
Deuxièmement, je montre que les investisseurs tentent activement d’exploiter une informa-tion privilégiée avant l’annonce en executant des round-trips à horizon très court terme autour de l’annonce. Je trouve en effet que pendant les quelques jours qui précèdent le jour de l’annonce, la durée observée (en jours) des allers-retours exécutés par des investisseurs individuels dans mon échantillon diminue fortement, ce qui suggère que les investisseurs individuels débouclent leurs positions peu de temps après l’annonce afin d’encaisser leurs gains.
Troisièmement, je montre que les allers-retours commencés un jour avant l’annonce sont plus rentables que ceux initiés en temps normal. Ce n’est pas le cas, en revanche, pour les allers-retours qui sont initiés le jour même et les jours qui suivent l’annonce. Cette différence de performance suggère que les investisseurs individuels peuvent profiter de certaines informations privées avant l’annonce officielle des résultats trimestriels, mais ils sont moins en mesure de réagir à temps et d’exploiter de l’information qui vient d’être diffusée le jour de l’annonce.
Ce comportement boursier peut, potentiellement, ralentir l’ajustement des prix boursiers aux nouvelles informations. Plus précisément, je trouve que les investisseurs sont fortement contrariants par rapport au return intraday du jour de l’annonce: ils vendent massivement quand il y a un return intraday très positif et ils achètent massivement quand il y a un return intraday très négatif le jour de l’annonce. Ce comportement peut se comprendre comme la conséquence directe d’une prise de bénéfices après l’annonce.
To See is To Know: Efficient Display of Market Data for Retail Investors
I test whether the display format of market data affects the trading performance of retail in-vestors. To do so, I exploit a large brokerage dataset covering a period during which the market information provided to the broker customers changed in format, but not in content. I find that a more efficient information display allows investors to increase returns on their limit orders, because it becomes easier for them to mitigate the risk of adverse selection when trading with those orders. Hence, the display format of market data matters for the individual investor.
1.1 Introduction
Regulators are increasingly concerned with not only how much financial information is pro-vided to investors, but also how it is displayed to them, because the form of presentation can have first-order effects on individuals’ investment choices.1For instance, in 2009, the Securities and Exchange Commission adopted a disclosure framework for mutual funds investment oppor-tunities “that is easier to use and more readily accessible”. Similarly, the European Commission’s PRIPS (2012) proposal was designed to “improve the quality of information that is provided to
consumers when considering investments” using a format “that is short and plain-speaking, and
thus far more consumer-friendly”.2
In this paper, I test whether the display format of market data provided to retail investors af-fects their trading performance. This question is important because it is fundamental to identify the determinants of households’ financial decisions (Campbell[2006];Calvet, Campbell, and Sodini[2007]) and, in particular, the large observed heterogeneity in retail trading performance remains to be explained.3 To understand why the display format of market data might matter
for retail investors, recall that once investors have chosen a portfolio allocation, they must implement the trading strategies required to rebalance their holdings. These trading strategies involve a choice between market and limit orders.4 If investors use limit orders, then they mon-itor and revise/cancel them, after submission, to mitigate adverse selection and non-execution risks.5 That is, investors should monitor the market and their limit orders to improve their
1SeeBenartzi and Thaler[1999],Saez[2009],Looney and Hardin[2009]andKaufmann, Weber, and Haisley
[2012].
2Seewww.sec.gov/rules/final/2009/33-8998.pdfandeuropa.eu/rapid/press-release_IP-12-736_en.pdf. 3Prior studies have shown that financial literacy (Lusardi and Mitchell[2011]; Bhattacharya et al.[2012]),
financial sophistication (Calvet, Campbell, and Sodini[2007]) and financial wealth (Calvet and Sodini
[Forth-coming]) are important determinants of the financial decisions of individuals. See alsoBarber, Lee, et al.[2012]
andGrinblatt, Keloharju, and Linnainmaa[2011]for specific studies on investors’ performance heterogeneity
4Limit orders specify a number of shares and a price: the maximum price at which an investor is willing to buy
or the minimum price at which an investor is willing to sell. Limit orders accumulate in the limit order book in descending buy-price order or ascending sell-price order (price priority) and join the queue composed of other limit orders that have the same price (time priority). Market orders specify a number of shares to buy or sell, but no particular price. Market orders are automatically filled at the most attractive price posted by previous limit orders in the limit order book.
trading performance on those orders. If a display format of market data makes such market
monitoringmore efficient then, everything else being constant, it should also improve investors’ trade performance on their limit orders.
To test this hypothesis, I exploit a unique setting in which the quantity of market information provided to investors remained fixed, while the display format of that information exogenously changed at some point in time. Specifically, I use the introduction in June 2003, by a large brokerage house, of a trade order management software (hereafter, Trader+). The software displayed market data in a more efficient way because it simultaneously gathered all relevant information items (market data and investors’ orders) into a user-customized screen. The simul-taneous presentation of information items allows investors to understand how different stock prices movements are related to one another and helps investors better assimilate that informa-tion when monitoring their limit orders. For instanceHodge, Kennedy, and Maines[2004], who study a search-facilitating technology introduced by the SEC in 2003 (and adopted in 2009), argue that the “simultaneous presentation of related information directs users’ attention toward
examining relations among the information items (Russo[1977]). Simultaneous presentation also reduces the cognitive costs of integrating the information”.6 Importantly, the software left the
quantityof the data being processed unchanged. Indeed, the same information was available to the brokerage customers, in a more dispersed form, on other trading channels (such as using the brokerage website to submit an order). As the software displayed the market data more efficiently than before, I expect Trader+ users to better monitor their limit orders, which should subsequently lead to higher trading performance on those orders. To test these implications, I use a difference-in-differences identification strategy in which treated investors, who switch to the new software, are matched (with a propensity-score algorithm) to similar control investors who do not use the software.
costless since it requires some monitoring to insure that orders are not left exposed after, for example, a public information release" (Glosten[1994]).
6This is the eXtensible Business Reporting Language (XBRL) technology. In 2003 the Securities and Exchange
Commission introduced this search-facilitating technology to ease the acquisition and the processing of public companies’ financial statements by non-professional users. Seehttp://xbrl.sec.govfor technical details and
I find that the display format of market data does matter for the individual investor. As in
Grinblatt, Keloharju, and Linnainmaa [2011]andLinnainmaa [2010], for each buy and sell limit order on a given stock in my sample, I compute the signed return from the execution price to the closing price of that stock the same day. Indeed, this return has been used in the literature as a proxy for the risk of adverse selection faced by investors when trading with limit orders. It is therefore a performance measure of one order’s execution quality and should capture "the active
management of individuals".7 Intuitively, the higher the risk of adverse selection, the lower this
return. My difference-in-differences estimates show that following the introduction of Trader+, investors’ intraday returns on their limit orders jump by 10 basis points.
The economic magnitude of this result is large in light of previous studies on the trading performance of investors. For instanceGrinblatt, Keloharju, and Linnainmaa[2011]find that intraday returns of Finnish investors with high IQ (in the top 5% of the distribution) outperform those with low IQ by 11 basis points, which suggests that the display format of market data has an effect for trading performance similar to that of individual cognitive abilities. As other direct comparisons,Coval, Hirshleifer, and Shumway [2005]find a strategy based on previous successful/unsuccessful retail investors that earns a daily abnormal return of 5 basis points and, in Taiwan,Barber, Lee, et al.[2012]show that the spread in gross returns between the top and bottom performing investors is 70 bps per day.
My explanation for this increase in trade performance is that investors take advantage of the improved information display format of Trader+ to monitor their limit orders more efficiently than before, which, in turn, leads to higher returns on those orders. This increase in performance has two implications, according to market microstructure models of order choice in which investors’ trade performance is affected by the "cognitive cost" of monitoring their limit orders.8 First, treated investors should use limit orders more often than before, because the expected
7SeeGrinblatt, Keloharju, and Linnainmaa[2011]. For instance,Hollifield et al.[2006]define the risk of adverse
selection as the expected loss (or gain) due to future expected changes in stock value given execution. Accord-ingly,Liu[2009]obtain a proxy for this expectation by comparing the current price after the execution of a limit order to the price at which the order has been executed.
8This cognitive constraint is embedded in many leading market microstructure papers. See for instanceFoucault,
utility of trading with a limit order increases relative to the utility of trading with a market order. In line with this intuition, I find that following the introduction of the software the fraction of limit orders executed by treated investors increases by 8 percentage points, relative to the control group. Second, I expect treated investors to be able to spot and monitor short-term trading opportunities that were likely to be too difficult to monitor before. This change in behavior should lead to a decrease in individual trading horizon. To test this implication, I identify all the round-trips executed by investors in my sample and I proxy for trading horizon of a given investor, in a given month, by computing the average duration (in days) of his round-trips initiated that month. I find that i) the average short-term trading horizon decreases by almost 4 days (approximately a 10% decrease relative to the pre-treatment trading horizon of the treated group) and ii) the number of round-trips opened and closed within the same day increases by 2 percentage points (from a pre-treatment percentage of about 5% for the treated group). Consequently the overall trading activity of the treated group nearly doubles, compared to that of the control group, only one month after the introduction of the software. In summary, the changes in trading behavior for the treated group, after the software is introduced, are thus consistent with an explanation based on limit order monitoring costs.
I also consider, and rule out, alternative explanations for my findings based on trading speed, overconfidence and investors’ self-selection. A first possibility is that trading returns increase because the use of the software is associated with a greater trading speed that allows investors to place their orders faster than other investors. This would be the case, for instance, if investors switch to Trader+ when they increase the speed of their internet connection or if orders sent through Trader+ are routed more quickly to the market by the brokerage house. If this expla-nation is correct, performance should increase for both market and limit orders. In particular, this improvement should be stronger for market orders, because these orders benefit the most from a higher trading speed (seeGarvey and Wu[2010]). Instead, I find the opposite in my sample: returns on limit orders improve, whereas returns on market orders do not improve and the use of limit orders increases for investors who switch to Trader+. These facts suggest that
my results are not driven by a change in trading speed.
Another possibility is that the trading software may have increased investors’ overconfidence. A mechanism similar to the one inBarber and Odean[2002]would suggest that investors with past successes prior to the introduction of Trader+ are more likely to become overconfident and to adopt Trader+, because overconfidence is enhanced by the "illusion of control" enjoyed when using trading software. Therefore, investors may mistakenly believe that the software allows them to better manage their limit orders. This alternative explanation has two implications. First, one expects returns on limit orders to actually decrease for treated investors after the switch to Trader+, because the software should enhance investors’ overconfidence. I find the opposite result. Alternatively, returns should be at least lower for more overconfident traders, because more overconfidence leads to larger and more frequent behavioral mistakes. Instead, using individual performance prior to Trader+ as a proxy for investor overconfidence (as suggested inBarber and Odean [2002]), I find that investors who are more likely to be overconfident benefit the most from the software. These findings suggest that overconfidence does not explain my results.
Finally, while the software’s introduction was an event decided by the brokerage house, its adoption (or non-adoption) was left to the investor. Therefore self-selection issues may be a possible concern to establish causality.9 Difference-in-differences estimates are robust to a particular form of selection: those who switch to the treatment are allowed to be those who benefit the most from it (see Todd [2007]), as long as selection is based on time-invariant (observable or unobservable) variables. Self-selection is only a concern in the case of dynamic
selection into treatment, for which I do not find evidence in my data.10
This paper directly contributes to the few recent works that study how alternative presenta-tion formats of financial informapresenta-tion influence investors’ risk-appetite (Kaufmann, Weber, and
9This is a well known problem in the program evaluation literature. SeeHeckman et al.[1996]andHeckman et al.[1998].
10In that case the most critical difference-in-differences identifying assumption, the “parallel trend assumption”,
would not be verified. For an example, seeAshenfelter and Card[1985]. The trends in outcome between treated and control investors in my sample fully support this (untestable) assumption.
Haisley[2012]), investors’ behavioral biases (Rubaltelli et al. [2005]) and investors’ retire-ment portfolio choices (Looney and Hardin [2009] andBateman et al. [2011]). To the best of my knowledge, this is the first paper to show that the display format of market data affects the trading choices and the performance of individual investors. A direct implication of this result is that once households’ portfolio allocation choices are made, regulators can improve the portfolio-rebalancing execution strategies of retail investors by giving households access to market data that is easier to process. That is, a more efficient display format of market data can help retail investors to make better financial decisions, and thus can be seen as a practical way to improve their financial literacy (Lusardi and Mitchell[2011]).11
My results also contribute to a recent literature pioneered byLinnainmaa[2010],Barber, Lee, et al.[2012]andKelley and Tetlock[2013]that uses insight from market microstructure theory to understand investors’ decisions. This paper suggests that the display format of the data being processed by investors may explain part of the large cross-section variation in retail investors trading skills identified in the literature (Grinblatt, Keloharju, and Linnainmaa[2011]; Barber, Lee, et al.[2012]) and may be an indirect determinant of households’ financial decisions.
This article proceeds as follows. Section 1.2 discusses my testable empirical hypothesis. Section3.2presents the brokerage dataset and Section1.4motivates and discusses my iden-tification strategy. The results are given in Section1.5 and Section1.6. Before concluding, I discuss potential alternative explanations for my results in Section1.7.
11Indeed, the term financial literacy “can encompass concepts ranging from financial awareness and knowledge,
including of financial products, institutions, and concepts; financial skills, such as the ability to calculate compound interest payments; and financial capability more generally, in terms of money management and financial planning”
1.2 Testable Hypothesis
Almost all major exchanges today are limit order book markets.12In a limit order book market
there is no designated market-maker setting prices for market participants: investors can instead either provide liquidity to the market by using limit orders or consume liquidity by using market orders.
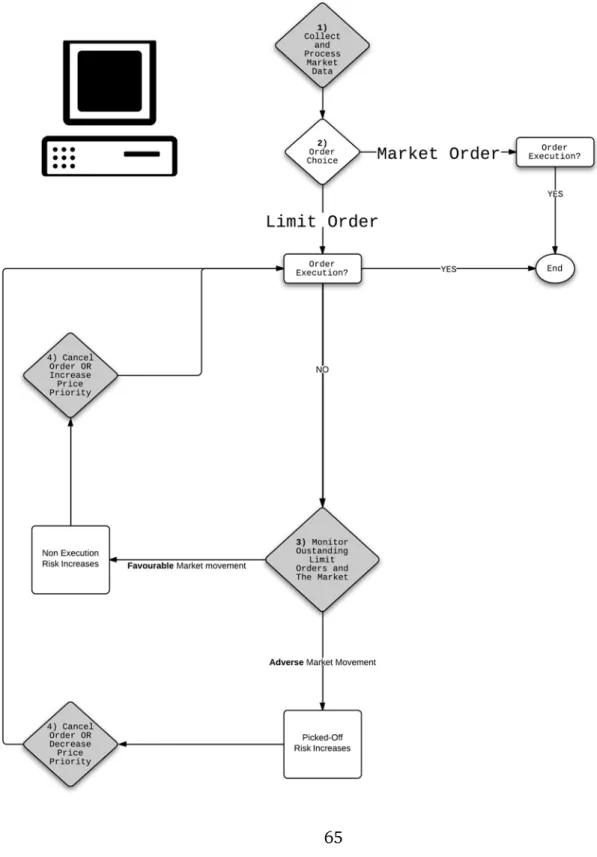
Therefore, to rebalance its portfolio holdings, an investor must implement a trading strategy that involves the choice between market and limit orders. Figure 1.1 specifies the decision tree faced by an investor willing to trade, and helps to understand how I obtain my empirical implications. This tree is a modified version of the one inFong and Liu[2010].
<InsertFigure 1.1Here>
The investor first needs to collect and process market data (step 1) and optimally decide which order type to use for his trade (step 2): market order or limit order. Limit orders specify a number of shares and the maximum price at which an investor is willing to buy or the minimum price at which he is willing to to sell. Limit orders accumulate in the limit order book in descending buy-price order or ascending sell-price order (price priority) and join the queue of other limit orders with the same price (time priority). Market orders specify a number of shares to buy or sell, but do not specify a particular price: they are immediately filled at the most attractive price posted by limit orders in the limit order book.
Hence, market orders provide immediacy and guaranteed execution at the cost of the bid-ask spread. A limit order instead offers a better execution price than a market order, but involves two different risks. First, the execution of a limit order is not guaranteed. This risk is known as
12Such as the NYSE Euronext or the NASDAQ. As of January 2012, the worldwide Electronic Order Book (EOB)
the risk of non-execution. Second, if a trader does not monitor the market, the limit order may be executed in adverse market conditions. This risk is known as the adverse selection risk.13
Both of these risks can be mitigated by active order management, which is usually called
monitoring activityin the market microstructure literature. Limit orders can indeed be cancelled and/or revised after their submission. A higher limit price priority will increase the execution probability and thus decrease the risk of non-execution. A lower limit price priority will instead decrease the likelihood of execution and thus decrease the risk of adverse selection (Fong and Liu[2010]).
Therefore, an investor must monitor the market and his limit orders to increase his trading performance on these orders. As monitoring is a costly cognitive process, investors cannot continuously monitor their limit orders. This reasoning implies that a more efficient monitoring activity should lead, everything else being equal, to a higher trading performance on limit orders. This increase in performance, in turn, should induce investors to use limit orders more often than they previously did before because it is more profitable to do so.14
Furthermore, short-term strategies in which investors trade very frequently (such as “day-trading”, where investors revert their positions at the daily level) are more difficult to monitor than long-term ones. If this is correct, a more efficient monitoring activity should allow in-vestors to spot more short-term trading opportunities than before. This effect implies that the proportion of short-term trading strategies should increase (leading to higher trading activity) when investors monitor their limit orders more efficiently.15
In summary, I have the following testable hypothesis at the investor level:
13Also known as the risk of being picked-off, or the free-option risk. SeeCopeland and Galai[1983],Foucault
[1999]orHollifield et al.[2006].
14This reasoning is illustrated in step 2 ofFigure 1.1: an investor submits a limit order if the expected utility of
using a limit order is greater than the certain utility of using a market order. The investor sends a market order otherwise.
15This mechanism is actually mentioned inBarber and Odean[2002]: “Investors may trade more when they go
online simply because of greater ease of access. For rational investors this implies that there were potentially profitable trades that the investors declined to make before going online because the expected profits did not warrant the effort of calling a broker”.
1. A more efficient monitoring activity increases the trading performance of limit orders, because investors better mitigate adverse selection risks.
2. A more efficient monitoring activity has no effect on the performance of market orders, because market orders do not need to be monitored (as their execution is immediate and certain).
3. A more efficient monitoring activity increases the probability of submitting a limit order, as limit orders become more profitable than market orders.
4. A more efficient monitoring activity increases trading volume and reduces trading horizon, because investors exploit short-term strategies that were too costly to execute and monitor before.
1.3 Data
In this section I describe the data and define the variables that I will use in order to test implications 1,2,3 and 4 described in the previous section.
1.3.1 The Brokerage Dataset
The data used in this paper comes from a leading French online broker.16 The raw dataset contains at the daily level all of the executed trades sent by each of the 145801 customers of the broker from 1999 up to 2010, which represents more than 15 million trades.
Each trade comes with the following information: the asset type (equity, bonds, etc), the trading exchange identifier (the ISIN), the trading date, the quantity, the order type (limit, market and other minor orders types), the amount traded in euro, the trading place and the trading channel used to submit the order. I match the trades in my dataset with market data
16A subsample of this database covering the period 1999-2001 has already been used, to address another research
provided by Eurofidai, the European financial data institute. Trades are matched by ISIN code, trading day and trading exchange code. Trades for which no information is available from Eurofidai are discarded from the sample.
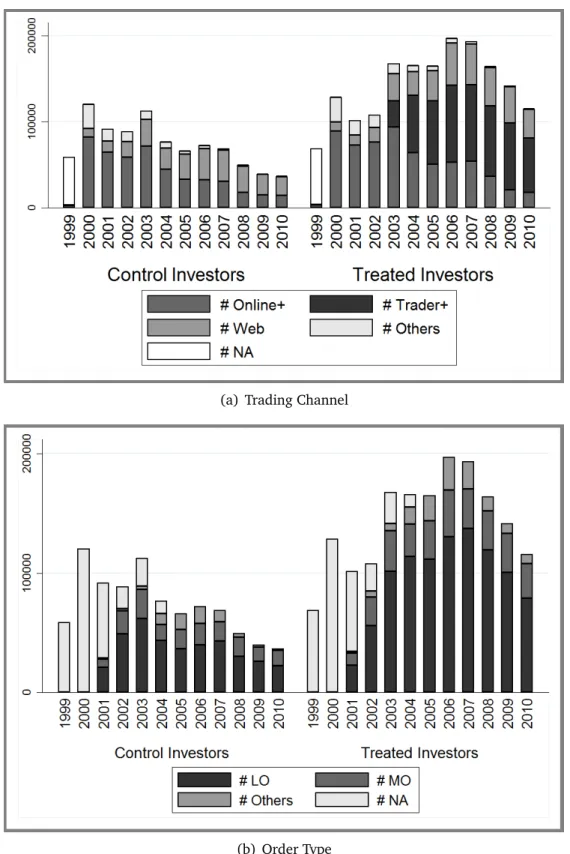
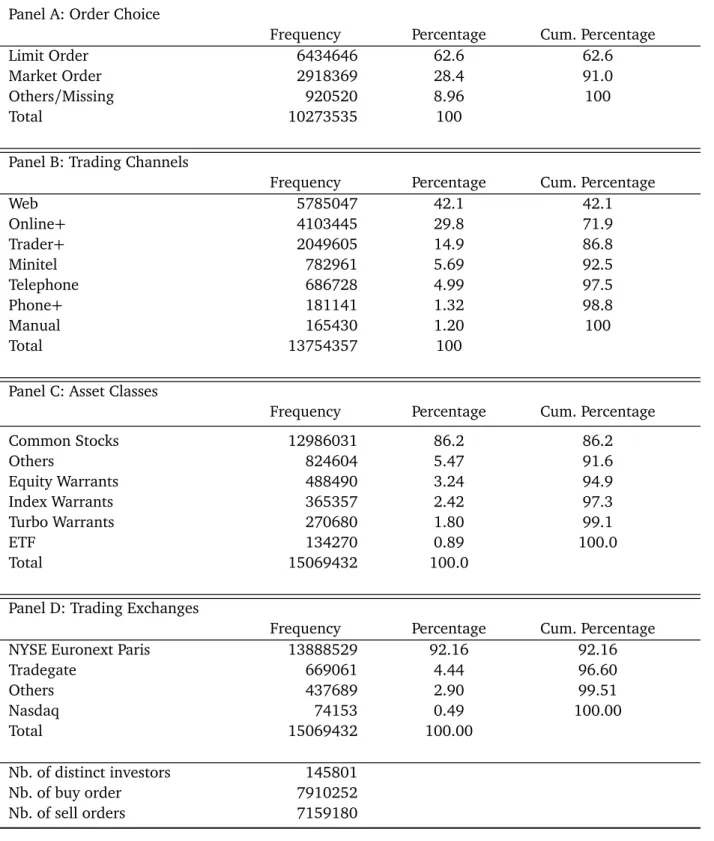
Summary statistics of the raw brokerage dataset are provided inTable 1.1. This table shows the corresponding number of trades, percentage and cumulative percentage for several cat-egorical variables that describe the nature of my data well. Panel A shows for instance that trades are in the majority of cases limit orders (62%) and market orders (28%). The other minor orders types are rarely used by investors. The information on order type is completely missing for 1999 and 2000 and may be sometimes missing up to 2004. Therefore the previous figures are computed without taking into account the number of orders with missing order type information.
Investors could submit an order by using the telephone to speak to a broker official (Tele-phone), by calling a voicemail service and typing instruction using the telephone’s keys (Phone+), by using a web navigator to connect to the broker website (Web), by using an old French Video-tex online service accessible through the telephone lines (Minitel) or by using online basic computer software (Online+). Trader+ is a trading software that was introduced in June 2003. It will be fully discussed and presented inSection 1.4. Panel B of the table highlights that a large majority of trades are submitted using the internet or trading software (Online+ and Trader+).
Panel C and Panel D of the table show that most of individual trading activity consists of buying or selling common stocks on the NYSE Euronext Paris trading exchange. This dataset, therefore, shows patterns of individual investment behavior that are similar to other recent databases used in the literature. For instance, Finnish investors inLinnainmaa[2010]also use limit orders for most of their trades on the Helsinki Stock Exchange.
1.3.2 Variable Definition
I describe in this section how I measure investors’ trading performance (Section 1.3.2) and investor trading horizon (Section 1.3.2).
Measuring trading performance
I measure trading performance as follows. For each trade in my sample, I compute the signed difference between the closing price of the stock bought (or sold) and the execution price of the order, divided by the execution price of the order:
Ri,t,k,s= signi,t,k,s∗C l oset,s− P ricei,t,k,s
P r icei,t,k,s
C l oset,s is the closing price on day t, of the traded stock s, and P r icei,t,k,sis the execution price
of order number k submitted on day t, for stock s, by individual i. Si g ni,t,k,sis a dummy variable
that equals one for a buy order and minus one for a sell order.
This ex-post performance measure is well suited for assessing the performance of a limit order, because it captures the adverse selection risk faced by investors using those orders (seeHarris and Hasbrouck[1996]). Indeed, Hollifield et al. [2006] define the risk of adverse selection as the expected loss (or gain) due to future expected changes in stock value given execution. Similarly,Liu[2009]obtain a proxy for this expectation by comparing the current price after the execution of a limit order to the price at which the order has been executed.
A similar approach is also adopted inGrinblatt, Keloharju, and Linnainmaa[2011]and Lin-nainmaa[2010].Linnainmaa[2010]computes intraday returns on investors’ orders by also comparing the execution price to the close price on the same day. He also infers from those returns that investors’ limit orders may suffer from adverse selection risks:
“Investors may have limit orders in the book around earnings announcements if they
are unaware of an earnings announcement orif the cost of monitoring a limit order exceeds the expected loss due to an earnings announcement.” (pp.1488)
InGrinblatt, Keloharju, and Linnainmaa [2011]the authors compare the performance be-tween high and low IQ investors and argue that this return is essentially a measure of one order’s execution quality and should capture “the active management of individuals”. “High IQ investors”, they say, “may be better or quicker at processing information into a useful signal, or excel at distinguishing useful information from noise”. Because the researchers are able to detect statistically significant differences between the returns of the high IQ and low IQ groups, their hypothesis cannot be rejected.
My approach follows the same reasoning. If a more efficient display of market data allows investors to monitor their limit orders more efficiently, then investors should improve upon the execution quality of their limit orders relative to investors using a less efficient data display. This improvement is captured by my intraday returns.
To test this hypothesis, I need an improvement in the display of market data for retail investors. This point will be discussed inSection 1.4.
Measuring investors’ trading horizon
To proxy for investors’ trading horizon (and test the fourth empirical prediction), I adopt a methodology first described inSchlarbaum, Lewellen, and Lease[1978]. I aggregate investor i’s single trades into round-trip trades and I use the investor i’s average round-trip duration in a given month, as a proxy for trading horizon that month.
In order to do so, I first compute the daily net quantity traded by investor i, on stock s and day t as:
Qi,t,s= Qtitibu y,t,s− Qtitsel l i,t,s,
where Qt i tibu y,t,s (resp. Qt i tsel l
i,t,s) represents the actual quantity of stock s bought (resp. sold) by
investor i on day t.
Then, I sort all the daily net quantities in my dataset by trader, stock and trading day and I keep track of the cumulative stock quantity held by a trader day after day. A round-trip starts and ends with a zero net cumulative quantity. Round-trips are thus trading positions that are fully unwound: stocks previously bought are entirely sold and stocks previously sold short are completely bought back.
The duration of a round-trip is thus the number of days between the start and the end of a round-trip. I obtain a proxy for investor i’s trading horizon, in a given month, by taking the average duration of all the investor i’s round-trips started that month.
1.4 Methodology and Identification Strategy
1.4.1 Trader+
I explain in this section why the display of market data in Trader+ should help investors more efficiently monitor their limit orders.
Monitoring activity is a costly cognitive process. Thus investors cannot achieve continuous monitoring of their limit orders. However, the idea that information technologies can help investors is pervasive in the literature. For instance,Biais, Hombert, and Weill[2013]derive equilibrium prices in a limit order book when new trading technologies such as algorithmic trading are used to alleviate the individual’s limited cognitive capacities. Also,Foucault, Roell, and Sandas[2003]makes the distinction between news monitoring, such as monitoring public announcements, and quote monitoring. Quote monitoring is limited to monitoring other dealers’ quote updates and, they argue, does not depend on the monitoring level because “in practice,
securities”. While they address other questions, the authors mention that the probability of observing quote updates depends on the fixed cost of the trading technology used.
Furthermore,Fong and Liu [2010] state that “the option to revise or cancel limit orders is
particularly important following recent advances in information technology[...] that allow traders to manage orders directly from their computers”. This point is consistent withPeng and Xiong [2006], who study the effects of limited attention on asset prices and show that “as information technology advances over time, investors’ attention constraints become less binding”.
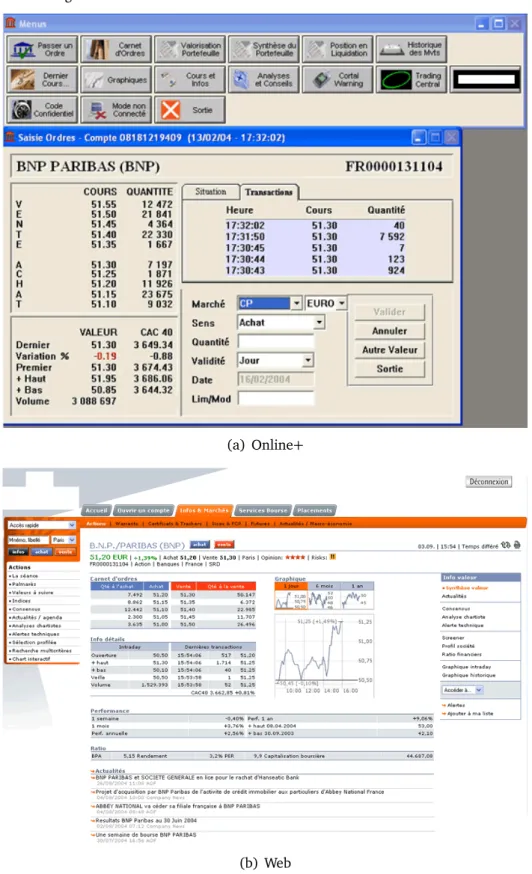
Building on these ideas, I argue that the new information display of market data, available on Trader+, allowed Trader+ users to monitor their limit orders more efficiently than before. Indeed, prior to June 2003, the broker customers submitted their orders mainly through two trading channels: using the existing trading software available (Online+) and connecting to the brokerage web interface (Web).Figure 1.2provides a screenshot of each of these trading channels, and highlights how identical information items (such as the current state of the limit order book, or the recent market movements statistics) are displayed differently on those trading channels. In both cases, one can see that the market data are dispersed through different webpages (for Web) or through different tabs (for Online+).
<InsertFigure 1.2Here>
Instead, Trader+ displayed market data much more efficiently than those trading channels because it simultaneously gathered all relevant information items into a user-customized screen. A screenshot of Trader+ is shown inFigure 1.3. As one can see, investors using Trader+ could see on their computer screen, not only the limit order book or the most recent market statistics, but also their pending orders, the stock intraday graphics and market data at the stock-level.17 The key point is that these information items were also available, in a more dispersed form, on the other trading channels. In other words, the quantity of information remains the same, while the display of that information varies when Trader+ is introduced.
17Additionally, investors can fully customize their Trader+ graphical user interface according to their needs and
<InsertFigure 1.3Here>
The simultaneous presentation of information items is the critical feature that allows investors to better understand how stock prices and market movements are related to one another, and helps investors better assimilate that information when they monitor their limit orders. I there-fore use the introduction of Trader+ as a positive shock to the investors’ limited monitoring capacities. This assertion is consistent withHodge, Kennedy, and Maines[2004], who consider a search-facilitating technology (the eXtensible Business Reporting Language (XBRL) technology) introduced by the SEC in 2003 and state that:
“A key attribute of XBRL-enhanced search engines is that they facilitate users
simultane-ously viewing similarly tagged financial information. This simultaneous presentation helps users to evaluate items in relation to each other and to integrate the related information when making decisions (Russo 1977). This feature of search-facilitating technology facilitates users integrating dispersed, but related, information in ways they may not have considered in a more traditional, non-searchable, environment”
In summary, the display of information of Trader+ should allow investors to monitor more efficiently their limit orders, which gives me the opportunity to test the empirical implications derived inSection 1.2.
1.4.2 Identification Strategy
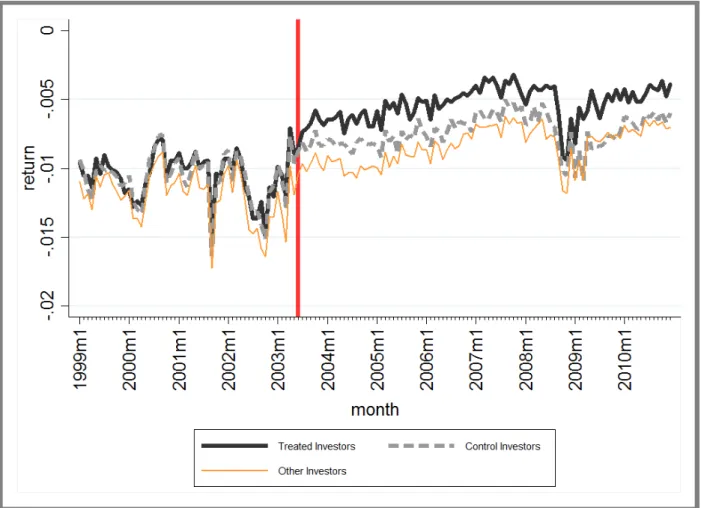
To test my empirical predictions, I use in this paper a difference-in-differences methodology (hereafter "DiD"). DiD estimates recover average treatment effects on the treated group by essentially comparing the outcomes between treated and control investors both before and after exposure to the treatment (Trader+).
The key identifying assumption in this setup (seeAngrist and Pischke[2008]orWooldridge [2010]) is that trends in outcomes for treated and control investors would have been the same