1 UMR DIAL 225
Place du Maréchal de Lattre de Tassigny 75775 • Paris Cedex 16 •Tél. (33) 01 44 05 45 42 • Fax (33) 01 44 05 45 45
• 4, rue d’Enghien • 75010 Paris • Tél. (33) 01 53 24 14 50 • Fax (33) 01 53 24 14 51 E-mail : [email protected] • Site : www.dial.ird.fr
D
OCUMENT DE
T
RAVAIL
DT/2015-07
Returns to fertilizer use: does it pay
enough? Some new evidence from
Sub-Saharan Africa
Estelle Koussoubé
Céline Nauges
2 RETURNS TO FERTILIZER USE: DOES IT PAY ENOUGH? SOME NEW EVIDENCE
FROM SUB-SAHARAN AFRICA
Estelle Koussoubé
PSL, Université Paris Dauphine, LEDa, DIAL UMR 225 IRD, UMR DIAL
Céline Nauges
University of Queensland, Australia
Document de travail UMR DIAL
Avril 2015
Abstract
This article explores the importance of fertilizer profitability in explaining the relative, apparent low use of chemical fertilizers by farmers in Burkina Faso. Using large-scale plot data, we estimate maize yield response to nitrogen to be 19 kg/ha on average and to vary with soil characteristics. Profitability, which we measure through the calculation of a marginal value cost ratio, is estimated at 1.41 on those plots which received fertilizers, with significant variations across regions. For those plots on which fertilizers were not applied, we predict that fertilizers should have been profitable in most cases under the current level of subsidized fertilizer prices. These findings suggest that the low uptake of chemical fertilizers might have been driven by factors other than profitability, including insufficient supply of subsidized fertilizers to farmers in need. Our results also call for increasing the availability of credit to farmers in order to encourage adoption of chemical fertilizers. Finally, our results also show that not taking into account the endogeneity of nitrogen use in the yield equation may produce biased estimates of the maize yield response to nitrogen.
Key words: Burkina Faso; fertilizers; maize yield; subsidization program; technology adoption.
Résumé:
Cet article explore l’importance de la rentabilité de l’utilisation des engrais chimiques comme facteur explicatif de leur relative faible adoption par les agriculteurs au Burkina Faso. En utilisant des données détaillées au niveau parcelle, nous estimons la productivité marginale des engrais à 19kg/ha en moyenne. Cette dernière varie considérablement en fonction des caractéristiques des sols. La rentabilité des engrais, mesurée par le rapport valeur-coût, est estimée à 1.41 sur les parcelles qui ont reçu des engrais et varie d’une région à l’autre. Concernant les parcelles sur lesquelles l’engrais n’est pas utilisé, nous trouvons que l’utilisation d’engrais serait profitable sur une grande majorité de ces parcelles au prix actuel subventionné de l’engrais. Ces résultats suggèrent que des facteurs autres que la rentabilité sont potentiellement responsables de la faible adoption des engrais. Ces facteurs incluent notamment les difficultés d’accès aux engrais subventionnés par les agriculteurs. Notre analyse suggère également qu’une augmentation de l’accès au crédit par les agriculteurs permettrait de favoriser l’adoption des engrais chimiques. Enfin, nos résultats montrent également la nécessité de corriger du biais d’endogénéité de l’utilisation des engrais dans l’équation des rendements de maïs.
Mots-clés : Burkina Faso ; engrais ; rendements du maïs ; subventions ; adoption de la
technologie agricole.
3
1. Introduction
The seemingly low use of modern inputs (including well-known technologies such as chemical fertilizers) by African farmers is considered to be a major impediment to food security and poverty reduction in Sub-Saharan Africa (SSA) (Morris et al., 2007). Average cereal yields and average intensity of modern inputs are stagnant in contrast to what has been observed in most developing regions (World Bank, 2007).
In response to this, in recent years several governments in SSA (with the assistance of international donors) have introduced input subsidy programs to foster the use of modern inputs and increase agricultural productivity (Druilhe and Barreiro-Hurlé, 2012; Jayne and Rashid, 2013). The discussion about these policies is still ongoing, with recent articles focusing primarily on the crowding out of the commercial fertilizer sector, diversion of inputs programs, and other factors related to the design of these programs (e.g. Pan and Christiaensen, 2012; Takeshima and Nkonya, 2014; Jayne et al., 2013).
The results from these subsidy programs are mixed and their performance is found to vary depending on the country and the characteristics of the intervention (for a comprehensive overview, see Jayne and Rashid, 2013). This calls for further rigorous ex-post analyses assessing the effectiveness of these policies. Our article contributes to this literature by studying the profitability of chemical fertilizers using large-scale plot data from Burkina Faso. As far as we know, no such estimates have been produced so far for this particular country.
The government of Burkina Faso, following the example of a number of other countries in SSA, launched a subsidy program in 2008 to encourage farmers’ uptake of chemical fertilizers and foster cereal production. The intervention was universal but targeted at specific crops (maize and
rice in particular). The program cost was estimated at 9.2 billion CFA francs1 in 2008, about 8%
of total agricultural spending (MAFAP, 2013). The subsequent decrease in the market price of fertilizers was estimated to be in the range 20-40% depending on the source (Wanzala-Mlobela et al., 2013; Siri, 2013). Although the intensity of fertilizer use has increased since the first year of the program implementation, it has remained low. In 2008, the average fertilizer use intensity (calculated as the ratio of total fertilizer use to total arable land in the country) was around 9.5 kg/ha. This level is slightly below the average level of fertilizer use for SSA (14.7 kg/ha), and well below the targeted level of 50 kg/ha that should be reached by 2015, according to the 2006
Abuja Declaration.2 Fertilizer use intensity has increased slightly since 2008, reaching an
estimated 11 kg/ha in 2012.
A number of factors explaining the low use of modern inputs by African farmers have been identified in the literature: low profitability (Duflo et al., 2008; Suri, 2011); credit and labor constraints (Croppenstedt et al., 2003; Moser and Barrett, 2006); risks (Dercon and Christiaensen, 2011; Giné and Yang, 2009); transaction and transportation costs (Zerfu and Larson, 2010; Minten et al., 2013); and limited knowledge of the technology and lack of access
1 1 USD ≈ 460 CFA francs (average exchange rate in 2008).
2 According to the World Bank, average fertilizer intensity is 146 kg/ha in South Asia and 107 kg/ha in Latin
4
to extension services (Conley and Udry, 2010; Krishnan and Patnam, 2014). In this article, we provide new evidence on the role of profitability (or lack of profitability) in explaining the low adoption of chemical fertilizers in SSA.
Using data from more than 7,800 maize plots cultivated in Burkina Faso, we estimate maize yield response to nitrogen application. Our modelling framework allows the endogeneity of nitrogen levels in the maize yield equation to be taken into account, along with data censoring issues (in our sample, fertilizer was applied to only about one-third of the plots). One of the main difficulties with ex-post analyses of technology adoption is to isolate the impact of the technology from the influence of farmer- and plot-specific characteristics on yield (Barrett et al., 2004). Our plot data are cross-sectional and refer to the year 2008 only, but about 70% of households in our sample owned more than one plot. This data specificity allows us to partially control for unobserved household characteristics by employing the method used by Mundlak (1978) and Chamberlain (1980), and to estimate a fixed-effects model on the sub-sample of households which cultivated more than one plot. The latter, which allows for household-unobserved heterogeneity to be isolated, is used as a test of robustness for the findings of our preferred model estimated on the entire set of plots. We are unable to control for plot-specific unobserved characteristics but household-unobserved heterogeneity should partially control for
differences in soil quality across farms.3 Our estimates of maize yield response and the
profitability of fertilizers are in line with estimates for other countries in SSA. We also show that not controlling for the endogeneity of fertilizer use in the yield equation leads to biased estimates of maize yield response to nitrogen, an issue which seems to have been overlooked in the literature so far.
The rest of the article is organized as follows. The next section briefly reviews the related empirical literature. Section 3 provides some background information about crop production and modern input use in Burkina Faso. Section 4 describes the data set used in this article. Section 5 presents the empirical model used to estimate the maize yield response to nitrogen application. Section 6 presents the estimation results, followed by a more detailed analysis of marginal returns and profitability of fertilizers in Section 7. Section 8 concludes.
2. Literature review
The profitability of fertilizer use depends on both the technical response to fertilizers, i.e. the units of output produced from one unit of nutrient, and the relationship between output price and fertilizer price (Yanggen et al., 1998). The literature on the profitability of fertilizer use in SSA focuses especially on maize, given the importance of this crop and the relatively high intensity of fertilizer use on maize plots in this region (Morris et al., 2007; Smale et al., 2013). Findings of the study by Yanggen et al. (1998) summarized in Morris et al. (2007) suggest that maize response rates to fertilizer use in SSA often exceed response rates observed in other developing
3 We expect the variation in soil quality across plots belonging to the same household to be lower than the variation
5
parts of the world. For instance, the study finds the median maize responses to be 14, 11 and 10 kg per kg of nitrogen in East and Southern Africa, West Africa and Latin America, respectively. However, response rates vary widely across locations and seasons. Recent estimates of maize response rates to fertilizer use in SSA summarized in Jayne and Rashid (2013) are in the range of 8 to 24 kg maize per kg of nitrogen. Variability in maize response rates reflects the different constraints and opportunities faced (even in the same village) by farmers (see Morris et al., 2007).
A common measure of fertilizer profitability is the so-called marginal value cost ratio (MVCR). The numerator of the MVCR is the revenue generated by the application of an extra kilogram of nitrogen. It is calculated as the marginal maize yield response to nitrogen multiplied by the price of maize. The denominator of the MVCR is the cost of a kilogram of nitrogen. Estimates of MVCRs for maize plots in SSA are summarized in Jayne and Rashid (2013). The estimated MVCRs are found to vary between 1 and 1.75 in two studies conducted in Kenya (Marenya and Barrett, 2009a; and Matsumoto and Yamano, 2011) and to be in the range 0.75-1.05 in Uganda (Matsumoto and Yamano, 2011). Also using data from Kenya, Sheahan et al. (2013) report an average (instead of marginal) value cost ratio varying from 1.3 to 3.7, depending on the region. In theory, an MVCR greater than 1, which indicates that nitrogen is marginally profitable, should induce farmers to use chemical fertilizers. However, it is common to consider MVCRs above 1.5 or even 2 as profitable, in order to account for unobserved transaction costs and the potential risk premium if farmers are risk averse (Jayne and Rashid, 2013; Sheahan et al., 2013).
Recent research has shed light on the importance of non-market factors in explaining the profitability of fertilizer use in SSA. Using cross-sectional survey data from Western Kenya, Marenya and Barrett (2009a, 2009b) show that soil quality (measured in terms of carbon content) conditions the marginal productivity of fertilizer (maize yield response). This result has important policy implications: since poor farmers farm less fertile soils on average, they may benefit less from interventions that aim at increasing fertilizer use. These findings are consistent with analyses from large-scale panel data from Kenya (Sheahan et al., 2013) and other East and Southern African countries (e.g. Xu et al., 2009). Sheahan et al. (2013) use panel data for the period 1997-2010 to estimate the profitability of fertilizer use on maize plots in Kenya. Their findings suggest that an increase in average fertilizer application rates will only lead to an increase in maize productivity if attention is given to the use of complementary inputs and heterogeneity in soil conditions. They also find that current fertilizer application rates are profitable for many maize growers across the country. However, estimates of the optimal levels of fertilizer use suggest that an increase in fertilizer use (to the level recommended by the government) may not be profitable for most farmers. This latter finding is supported by a study from field experiments in Kenya by Duflo et al. (2008). These authors find that the mean annualized rate of return to fertilizers is 69.5% when fertilizers are used in appropriate quantities but that other quantities of fertilizers (in particular the level recommended by the government) are not profitable for the average farmer.
6
These findings challenge the common views that explain in part the renewed emphasis on input subsidies in SSA: (i) an increase in fertilizer use will be profitable under current conditions; (ii) low fertilizer use is due mainly to poor infrastructure and market imperfections. Recent analyses of existing programs have raised concerns about the efficacy of input subsidies programs while suggesting ways of improvements (Pan and Christiaensen, 2012; Holden and Ludunka, 2014). However, the renewed emphasis on input subsidies has also called for more analyses of fertilizer profitability that take into account the heterogeneous constraints and opportunities faced by African farmers (Jayne and Rashid, 2013). While the body of literature on the costs and benefits of modern inputs use in SSA is growing rapidly, the evidence has come principally from a few countries, and even from a few regions within these countries. These findings may be less informative for other countries in SSA where farmers face different production conditions and constraints.
3. Agricultural production and modern inputs use in Burkina Faso
Burkina Faso is a West African country with a population of about 17 million. The Gross National Income was estimated at 670 USD per capita in 2013, below the SSA average (1,657
USD per capita).4 In 2009, the contribution of agriculture to the Gross Domestic Product was
estimated at 35% (MAFAP, 2013). The sector is dominated by smallholders: in 2008, 72% of the farms were smaller than five hectares (MAFAP, 2013). Agriculture is principally rain-fed and dominated by staple food crops (maize, millet, and sorghum) and cash crops (cotton and rice primarily). Cereal production represents about 77% of the total cultivated area for the period 2001-2010 (MAFAP, 2013). Cotton is the principal cash crop grown by farmers and accounts for a substantial part of the country’s exports. Maize is the third cereal crop grown in Burkina Faso, accounting for about 17% of the country’s total cereal production. Maize production has been expanding over recent years – production multiplied by a factor of 3.7 between 2000 and 2010. Maize is grown by around 80% of rural households and is primarily consumed nationally (MAFAP, 2013). Currently, average cereal yields in Burkina Faso are 1,209 kg/ha, below the
average for SSA (1,427 kg/ha).5 This may be partly explained by the relatively low use of
chemical fertilizers and improved seeds: in our data (which are representative of the whole country), only 13% of plots cultivated in 2008 received chemical fertilizers and only 5% of plots
were planted with improved seed varieties.6
Since the 2007-2008 food crisis, the government of Burkina Faso has intervened to increase fertilizer uptake and cereal yield. These interventions, targeted at specific crops instead of categories of farmers as in Malawi and Kenya for instance, consist primarily of the distribution of improved seeds and chemical fertilizer subsidies. Rice and maize are the main cereal crops
4 Source: World Development Indicators (World Bank), available at
http://databank.worldbank.org/data/home.aspx; accessed 4 March 2015.
5 For comparison, the average cereal yield is 2,835 kg/ha in Latin America and the Caribbean and 2,376 kg/ha in
South Asia. Source: World Development Indicators (World Bank), available at
http://databank.worldbank.org/data/home.aspx; accessed 4 March 2015.
6 The main types of chemical fertilizers used by farmers are NPK (Nitrogen, Phosphorus and Potassium fertilizer)
7
targeted under Burkina Faso’s inputs subsidy programs (see Druilhe and Barreiro-Hurlé, 2012; Siri, 2013). Fertilizer subsidies accounted for about 60% of the total value of input subsidies for cereal crops. NPK and urea are the two types of fertilizers targeted by the program. Over the period 2008-2011, subsidized fertilizers distributed by the government for cereal crop production amounted to 52,460 metric tons (an average of 11% of fertilizer imports), and induced a decrease in the average market price of fertilizer by 20 to 40% in 2008 (Wanzala-Mlobela et al., 2013; Siri, 2013).
Under Burkina Faso’s fertilizer subsidy program, fertilizer needs for farmers growing maize and rice are estimated by each Provincial Directorate of Agriculture (DPA) based on the area expected to be planted and recommended fertilizer application rates. Province-level fertilizer needs are then aggregated at the regional level by the Regional Directorate of Agriculture (DRA) before being transmitted to the Ministry of Agriculture. The Ministry of Agriculture imports the fertilizers and distributes them to each region according to the regional expressed needs. Provincial offices are then responsible for the transport of the amount of fertilizers they require from the DRA warehouses to DPA warehouses. Farmers (or farmers’ organizations) acquire the subsidized fertilizers from the DPA and are responsible for the transport of the fertilizers to their farms. However, as noted by Wanzala-Mlobela et al. (2013) and Siri (2013), the program encounters important issues related to fertilizer distribution. In addition to delays in delivery and discrepancies between the expressed needs and the amounts of fertilizer distributed in the regions or provinces, farmers have to bear the transportation costs from the DRA warehouses to DPA warehouses (see Wanzala-Mlobela et al., 2013, for further details on Burkina Faso’s input subsidies program).
4. Data and descriptive statistics
The data used in this article come from Phase II of Burkina Faso’s Agricultural Census (RGA 2008-2009). The RGA was a large scale, nationally representative survey conducted by the Ministry of Agriculture of Burkina Faso (Directorate of Agricultural Statistics – DPSA) between 2006 and 2010. The primary objective of the RGA was to provide statistics on the agricultural sector (crop production, livestock development, arboriculture, and fishery). Data collected during Phase II include detailed household and plot level data on agricultural inputs and outputs, livestock, agricultural equipment, income, access to credit, etc.
The sample selection for Phase II was made using a two-stage stratified sampling method. Villages were selected in the first stage with probabilities proportional to size. Agricultural households were then randomly selected in the second stage. Additional stratification in each
stage was introduced in the sampling design using the data collected in Phase I (2006).7 For
instance, in each province, agricultural households were split between two strata: “small-holder farmers” and “large-scale farmers” (for more details on the sampling design, see DPSA, 2007).
7 Phase I of the RGA consisted of the listing of all agricultural households in the country, and data collection on
8
In total, 7,500 households were selected in 1,311 villages. Household characteristics and plot level crop production information were collected between June and December 2008 for a subset of 6,795 households in 1,283 villages. We have detailed information on the 63,407 plots cultivated by these households. The sample covers the 13 administrative regions and 45 provinces of the country.
For the purposes of this study, the analytical sample consists of 7,845 maize plots belonging to
4,481 households.8 Around 70% of the surveyed households grew maize on more than one plot.
The average maize yield in our sample was 1,300 kg/ha, varying from a low of 112 to a high of 3,960 kg/ha (median 1,200 kg/ha). Chemical fertilizers were applied on 35% of the plots and the average application rate was 32 kg of nitrogen (N) per hectare (the median is 26 kg of N),
varying from almost 0 to 198 kg/ha.9 The latter is in the range of application rates recorded for
maize plots in Kenya (Sheahan et al., 2013) and Zambia (Burke, 2012); for other estimates on SSA, see Jayne and Rashid (2013, Table 3).
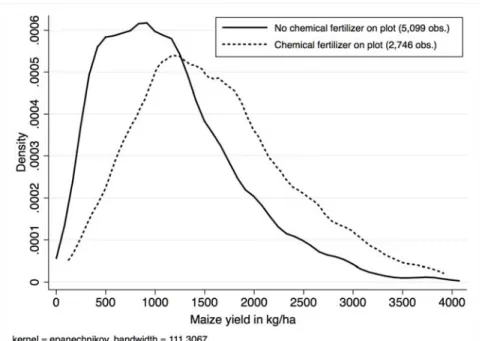
The average maize yield on plots receiving chemical fertilizers was 1,590 kg/ha while the average yield was 1,145 kg/ha when no chemical fertilizers are applied (the difference is statistically significant at the 1% level). The difference in yields between plots with and without chemical fertilizers is further illustrated in Figure 1, which features non-parametric (kernel) estimates of the density of yields for the two types of plots.
Figure 1: Non-parametric (kernel) estimation of the density of maize yields (7,845 plots)
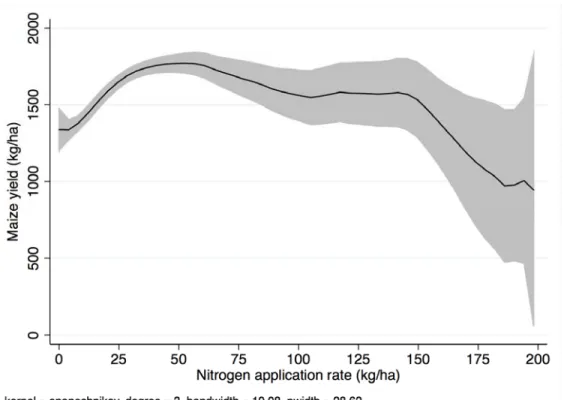
Using local polynomial regression on plots which received chemical fertilizers, we find a non-linear and concave relationship between nitrogen application rate and maize yield (Figure 2). The
8 Plots for which yield (measured in kg/ha) was declared to be 0 were removed from the database and yield values
below the first percentile and above the 99th percentile were eliminated. Extremely low values are likely to reflect
neglected or abandoned plots while extremely high values are likely to be due to measurement error. We also deleted observations for which nitrogen application (in kg/ha) was above the 99th percentile.
9
graph suggests a positive effect of nitrogen on yield up to a threshold (around 60 kg/ha) but detrimental effects on yield with application rates above this threshold and large negative effects when more than 150 kg of N per ha were applied on the plot.
Figure 2: Local polynomial regression (with 95% confidence interval) of maize yield on nitrogen application rates (2,746 plots)
We next compare average plot and household characteristics for plots with and without chemical fertilizers (Table 1). Plots on which chemical fertilizers were applied were larger in size (0.91 ha versus 0.26 ha for those plots which did not receive any fertilizers) and more often pure maize plots (88% versus 76%). Only 52% of the plots which received fertilizers were planted with maize the year before while this proportion is 81% for plots which did not receive any fertilizers. Plots on which fertilizers were applied were more often borrowed or rented than the other plots (50% versus 37%), and external paid labor was more likely to be used on plots which received fertilizers.
The adoption of chemical fertilizers was more likely for household heads who were literate, had better access to credit, and owned more livestock units, as well as a plough and some small agricultural equipment. Households who applied fertilizers on their plot benefited from lower fertilizer prices on average (the price shown in the table is the average of the median price of fertilizers in the district). Interestingly, the proportion of household heads who perceived the quality of their soil to be poor was higher for plots that did not receive any fertilizers. This may reflect the fact that poor households which were often more likely to work on lower quality plots faced more constraints regarding access to fertilizers, either through difficult access to credit or difficult access (in terms of time, distance, and availability of products) to input markets. It may also be an indication that fertilizers are less profitable on lower quality soils (Marenya and
10
Barrett, 2009a). Finally, those plots on which fertilizers were not applied were more affected by catastrophic climatic events such as droughts and floods.
Table 1. Comparison of mean characteristics of plots with and without fertilizers No fertilizer used on plots Fertilizers used on plots Test of mean equalitya Plot-level characteristics
Maize yield (kg/ha) 1,145 1,590 ***
Plot size (ha) 0.26 0.91 ***
Plot is located in the plains (0/1) 0.90 0.90 n.s.
Pure maize on plot (no intercrop) (0/1) 0.76 0.88 ***
Maize grown on plot year before (0/1) 0.81 0.52 ***
Plot is borrowed or rented (0/1) 0.37 0.50 ***
Use of external paid labor (0/1) 0.17 0.32 ***
Household-level characteristics
Head of household is male (0/1) 0.95 0.98 ***
Age of household head (0/1) 50.1 47.4 ***
Household head is illiterate (0/1) 0.77 0.64 ***
Price of fertilizer (CFA franc/kg)b 333 301 ***
Access to credit over last 3 years (0/1) 0.09 0.34 ***
Less than one hour to market (0/1) 0.81 0.84 **
Total livestock units 6.46 8.63 ***
Household owns a plough (0/1) 0.45 0.73 ***
Household owns small material (0/1)c 0.36 0.66 ***
Poor soil quality (0/1)d 0.30 0.23 ***
Drought or flooding event (0/1) 0.12 0.06 ***
Number of observations 5,099 2,746
Notes: a *, **, *** indicate that the means of the two groups are statistically different at the 10, 5, and 1% level,
respectively; n.s. is not significant. b Median price in the district. c Takes the value 1 if the household owns a hopper,
a seeder, a harrow, or a hoe, and 0 otherwise. d Takes the value 1 if the household head believes that the soil of
his/her parcel is of low quality, and 0 otherwise.
Maize yields and the use of fertilizers vary significantly across the 13 regions (Table 2). Average yield varies by a factor of three: from a low of 655 kg/ha in Sahel to a high of 1,877 kg/ha in Hauts Bassins. The proportion of plots on which fertilizers were applied also varies significantly.
In Sahel, where agriculture is less developed,10 fertilizers were very rarely used (1% of the plots)
while they were applied on 75% of the plots in Hauts Bassins. Average nitrogen application was in the range 15-40 kg/ha for most regions. Regional differences may be explained by differences in environmental conditions (weather, altitude, type of soil etc.) as well as by differences in terms of infrastructure, distance to markets and input suppliers, access to extension services and other information sources. For instance, both maize yields and fertilizer use were particularly
10 The Sahel region, which is situated in the extreme north of Burkina Faso, is relatively less suited to agricultural
production. Nonetheless, livestock raising and agriculture remain the principal activities of the households who live in this part of the country.
11
high in cotton producing regions such as Hauts Bassins, Cascades and Boucle du Mouhoun
where access to fertilizer and extension services is easier.11
Table 2. Average maize yield and fertilizer use by region
Region Obs. Maize yield Fertilizers
used on plots Nitrogen use
a (kg/ha) (kg/ha) Boucle du Mouhoun 932 1,338 58% 37.1 Cascades 441 1,704 68% 26.6 Centre 174 1,030 21% 21.7 Centre Est 821 1,398 27% 33.1 Centre Nord 460 1,072 11% 14.5 Centre Ouest 593 1,396 47% 41.0 Centre Sud 640 1,222 29% 29.7 Est 906 1,425 17% 24.9 Hauts Bassins 851 1,877 75% 36.8 Nord 268 1,022 30% 17.2 Plateau Central 600 1,087 11% 23.0 Sahel 77 655 1% 9.4 Sud Ouest 1,082 842 18% 25.0
Note: a Average calculated over the plots which received some fertilizer.
5. Estimation methodology
Our purpose is to estimate a maize yield function and the yield response to nitrogen application. The local polynomial regression discussed above suggests a non-linear relationship between nitrogen application and maize yield, which calls for the use of a quadratic functional form (i.e., with the square of nitrogen application as one of the right-hand-side variables). There is also evidence in the literature that the marginal productivity of nitrogen may vary depending on plot characteristics such as soil quality (Marenya and Barrett, 2009a), so our yield function also includes interactions between nitrogen application and plot characteristics.
Yield also depends directly on plot and household characteristics. Regarding a plot, we have information on its size, whether it was a pure maize plot or not, whether maize was grown on the plot the year before, whether the parcel was borrowed or rented, whether some external laborers were hired to work on the plot, and whether the plot had been affected by some catastrophic climatic events over which the farmer had no control (flood or drought). To control for households’ heterogeneity, we use the number of livestock units (as a proxy for the use of inorganic fertilizers such as manure), the household’s equipment (plough, small machinery), gender, age, and literacy of the household head, plus his/her perception of the soil quality. Finally we include regional dummies to control for varying climatic conditions and soil quality across the country. Regional dummies might also capture differences in access to information and extension services across regions.
11 The diversion of cotton fertilizer to maize fields is a well-known phenomenon in Burkina cotton producing areas
12
The general form of the yield function is the following:
, ,, ,, ; , ,
p i p i p i i p i i p i
y f N x w β
, (1)where yp i, represents maize yield (in kg/ha) on plot p belonging to household i; Np i, is nitrogen
application rate (kg/ha); x and p i, wi are vectors of observable covariates at the plot (p) and
household (i) level respectively; β is the vector of unknown parameters; p i, and
i representplot- and household-specific unobservables; and p i, is an idiosyncractic error term with
assumed mean zero.
Since our data are in a cross-sectional form, panel data techniques are not available to control for
unobserved plot-specific effects p i, (i.e., there is no way to separate p i, from p i, ) and
endogeneity bias might arise if some observable variables were correlated with the unobserved plot-specific effects. Unobservable plot characteristics, such as soil quality, plot exposure or slope, are unobserved by the econometrician but known to the farmer. So we might expect these characteristics to have a direct influence on yield but also to influence the farmer’s use of nitrogen. To control for the possible endogeneity of nitrogen application in the yield equation,
we estimate an equation featuring nitrogen use (Np i, ) as the dependent variable simultaneously
with the yield function:
, , , , , , , , , ; . , ; y y y y p i p i p i i p i N N N N p y i N i i p i i p i y f N N g x w β x w β (2)We add superscripts y and N to differentiate the vectors of observable characteristics, unknown parameters, and error terms between the two equations. We have removed the unobservable plot
characteristics p i, from the equations in the system since they are not separable from the
idiosyncratic error term.
The vector of exogenous variables in the nitrogen equation includes: plot size; plot location (whether in the plains or not); cultivation practices on the plot (whether this is a pure maize plot, and whether maize was grown the year before); plot status (borrowed or rented parcel); adverse climatic events (drought or flood) that affected the plot; the median price of fertilizers in the
district;12 total livestock units; the household’s distance to market; gender, age, and literacy of
household’s head and his/her perception of soil quality; and regional dummies. Regional dummies in this model are used to control for possible infrastructure and input supply constraints since we do not have any precise information on the distance between the farm and the fertilizer suppliers. The price of fertilizers and the distance to market (a dummy variable taking the value 1 if the market is less than one hour away, and zero if not) play the role of identifying instruments in the nitrogen equation.
13
It might also be the case that some unobservable household characteristics,
i are correlated withboth the dependent variables and observable plot characteristics. In the yield equation for example, an experienced and well-informed plot manager might have developed cultivation practices (intercropping, crop rotation) that have a direct influence on yields but also on his/her choice of nitrogen application. To control for possible correlations between unobservable
household characteristics
i and some of the plot-specific observables x , we follow the p i,approach of Mundlak (1978) and Chamberlain (1980). We specify a linear relationship for the dependence between the unobserved household specific effects and the exogenous covariates as follows:
i i ai
x (3)
where x is the vector of household-specific mean plot characteristics (calculated over the plots i
owned by each household). We assume that x allows us to control for the correlation between i
household unobserved specific effects and plot observable characteristics and that, conditional on
i
x , the remaining error ai can be assumed to be independent of x . Mean plot characteristics p i,
will be informative only for households which own more than one plot (about 70% of the
surveyed households). The same approach can be applied to both equations in the system.13
Omitting the constant which is embedded with the constant of the original models, the system
is written as follows:
, , , , , , , , , ; . , ; y y y y p i p i p i i p i N N N N p i p y y Y i i i N N N i i i i p i g N y a N a f N x x w β x w β x (4)Finally, to account for the fact that a large number of plots did not receive any chemical fertilizers, we follow Shonkwiler and Yen (1999). This implies estimating an augmented version of system (4):
, , , , , , , , , ; , , ; y y y y y y p i p i p i i p i N N Y i i i N N N i i N N p i p i i p i y f N N N a a g
p,i p,i x w β z α x w α x β x z (5)where
. and
. are the probability density function and cumulative distribution functionof a univariate standard normal, respectively; z represents the vector of exogenous variables in p,i
a probit model describing the decision whether or not to use chemical fertilizers on plot p; and α
is the corresponding vector of unknown parameters (for more details on the procedure, see
Shonkwiler and Yen, 1999).14 We include in z observable characteristics of the plot (size,
whether or not this is a pure maize plot, whether the parcel has been borrowed or rented), household characteristics (gender, age, and literacy of the household’s head, soil quality
13 We also include the household-specific mean nitrogen application (
i
N ) in the yield equation.
14 The term
,, ; N N N N i p i i g zp,iα x w β x z αp,i corresponds to the unconditional mean of nitrogen use
14
perception, number of livestock units, distance to market, and fertilizer price), and regional dummies. We use as the excluded instrument the household’s access to credit (which is measured by a dummy variable taking the value 1 if the household had access to credit over the previous three years, and zero if not) since this has been identified as one of the important factors explaining the low uptake of modern input use in SSA.
The estimation of system (5) involves two steps. First, we estimate the probability that some
chemical fertilizer is applied on each plot (a binary indicator) using maximum likelihood.15 Then
we use the estimated parameters to compute
z αp,iˆ and
z αp,iˆ . In the second stage, the system in which
z αp,iˆ and
z αp,iˆ are used in place of
z αp,i and
z αp,i is estimated using three-stage least squares (3SLS). Because of the two-stage estimation, we bootstrap standard errors in the second stage.For comparison purposes, we estimate the system of equations described in (5) controlling for farmer fixed effects. This implies losing around one-third of the original observations since only households who grew maize on multiple plots can be considered. The fixed-effect approach allows us to account for household-unobserved specific factors such as personal skills and knowledge, history of fertilizer use that may impact nitrogen use as well as maize yield. This system is run as a test of robustness for the 3SLS estimates obtained using the full sample of plots (see Marenya and Barrett, 2009a, for use of a similar approach). Finally, we estimate the yield function (first equation in system (5)) using Ordinary Least Squares (OLS). If the OLS estimates differ significantly from the 3SLS estimates, then this will be evidence of endogeneity of the quantity of nitrogen used.
6. Estimation results
Maximum-likelihood estimation results of the first-stage probit model show that access to credit, market conditions (the price of fertilizers) and distance to market are important drivers of the
decision to use fertilizers on a plot.16 Fertilizers were also more likely to be used on larger plots
and on pure maize plots. Households’ characteristics do matter in the adoption of chemical fertilizers: we find that young and literate male farmers were more likely to apply nitrogen on their maize plots. Finally, regional dummies are significant, which may reflect differences in the availability of subsidized fertilizers across regions.
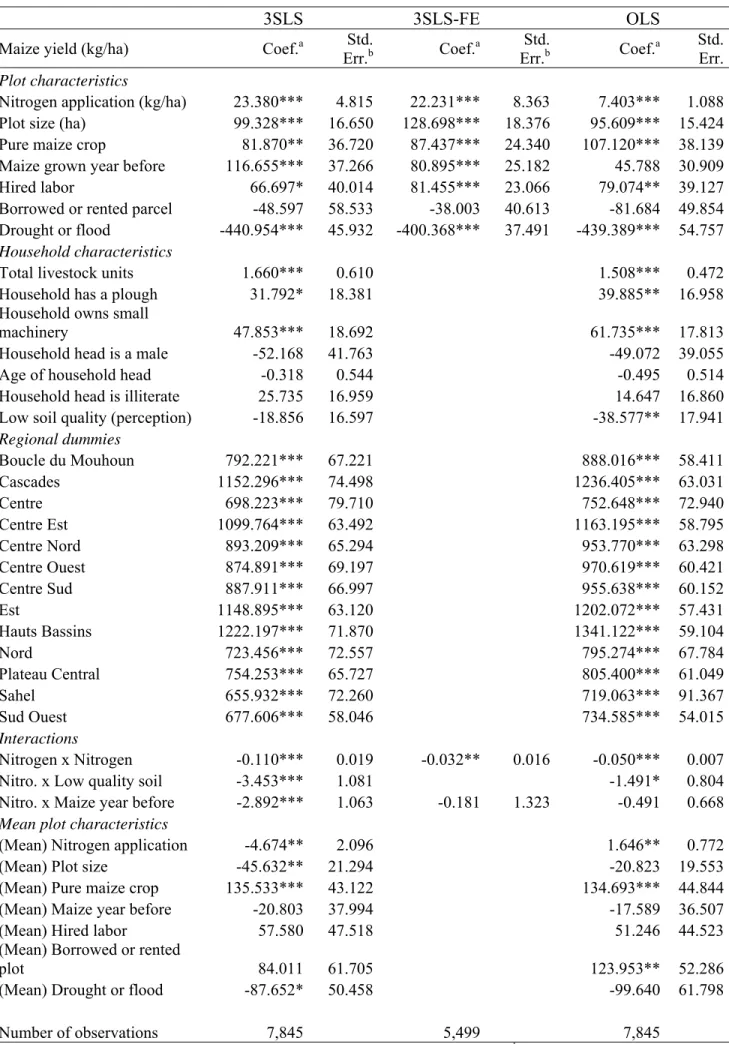
Estimation results for the maize yield equation are shown in Table 3. We report estimates obtained using 3SLS on the full sample of plots (7,845 observations), 3SLS with farmer fixed effects (3SLS-FE) on a sub-sample of plots (5,499 observations), and OLS (7,845 observations). We first comment on our preferred model, which is the system of equations estimated on the full sample using 3SLS.
15 More precisely we estimate a random-effects probit model and include household-specific mean plot
characteristics to control for unobserved household specific effects.
15
Our findings confirm that yield is a non-linear (concave) function of nitrogen application and that the marginal productivity of nitrogen is lower on plots of lower quality (as measured by farmer’s perception) as well as on plots which were planted with maize the year before. We discuss the maize response rate to nitrogen application in greater detail in the next section.
Cultivation practices have a direct impact on yield: in our sample, growing pure maize plots and growing maize on a plot which was planted with maize the year before are found to increase yield on average by 82 kg/ha and 117 kg/ha, respectively. As expected, catastrophic climatic events such as floods and droughts have a significant impact on yield, leading to an average loss of about 441 kg/ha.
The total number of livestock units has a positive effect on yield, which may reflect the household’s use of manure as a substitute or complement to chemical fertilizers. Yield is also significantly higher on plots belonging to households equipped with a plough and small agricultural equipment; the marginal effects are in the range 30-50 kg/ha.
The household’s socio-demographics (gender, age, literacy level) are not found to be significant in this model. The variable measuring the household head’s perception of land quality has the expected negative sign but is not significant, which may reflect an imperfect assessment of soil quality by the survey respondents. Finally, regional dummies reflect differences in yields across regions, with the highest average yields recorded in Hauts Bassins and Cascades, and the lowest yield recorded in Sahel.
The estimated coefficient of the main variable of interest, nitrogen per hectare, is significantly higher when endogeneity of nitrogen use is taken into account. In the two models featuring a system of equations (3SLS and 3SLS-FE), the estimated (direct) effect of nitrogen on maize yield is estimated at around 22-23 kg/ha, while the estimated effect is 7 kg/ha when the maize yield equation is estimated by OLS. This is an indication that nitrogen use may be endogenous in the yield equation and that not controlling for its endogeneity may lead to biased estimates of the maize yield response to nitrogen. Even if the 3SLS and 3SLS-FE estimates are not directly comparable because they were obtained using different samples, they are found to be statistically equal in most cases, which increases the confidence in our preferred model (3SLS). Estimates of maize yield responses obtained using the three models are discussed in the next section.
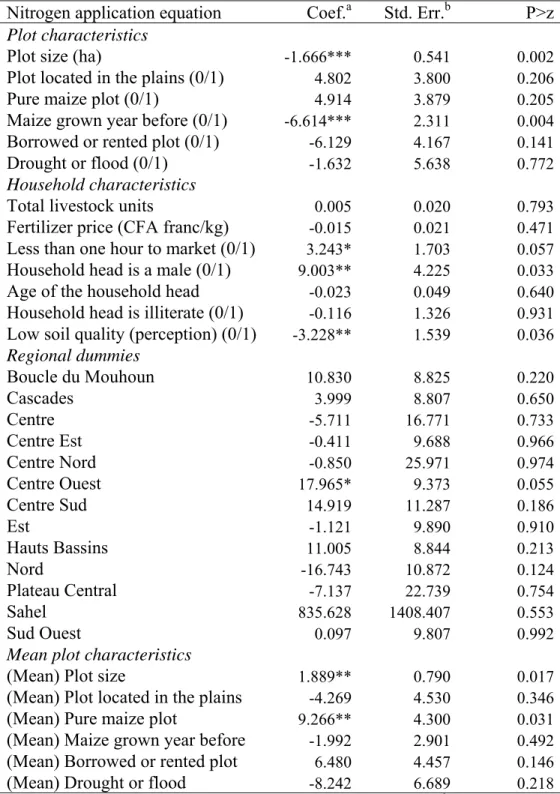
Estimation results for the second equation of the system (featuring per hectare nitrogen use as the dependent variable) are shown in the Appendix (Table A1). We only report the 3SLS estimates obtained on the full sample of plots since the 3SLS-FE estimates are not statistically different for most variables. The quantity of nitrogen applied on a plot is found to be lower on larger plots and on plots that were planted with maize the year before. Plots that belonged to households which perceived their land as low quality received less nitrogen on average. This may be explained by the cost of nitrogen outweighing the expected benefit from nitrogen application. As discussed above, the marginal productivity of nitrogen is significantly lower on low quality soils and using nitrogen on these soils may simply not be profitable (see Marenya and Barrett, 2009a, for related
16
discussions on data from Kenya). Male farmers were also found to apply more nitrogen than female farmers.
Table 3. Maize yield equation (3SLS, 3SLS-FE, and OLS estimates)
3SLS 3SLS-FE OLS
Maize yield (kg/ha) Coef.a Std.
Err.b Coef.a Std. Err.b Coef.a Std. Err. Plot characteristics
Nitrogen application (kg/ha) 23.380*** 4.815 22.231*** 8.363 7.403*** 1.088 Plot size (ha) 99.328*** 16.650 128.698*** 18.376 95.609*** 15.424 Pure maize crop 81.870** 36.720 87.437*** 24.340 107.120*** 38.139 Maize grown year before 116.655*** 37.266 80.895*** 25.182 45.788 30.909
Hired labor 66.697* 40.014 81.455*** 23.066 79.074** 39.127
Borrowed or rented parcel -48.597 58.533 -38.003 40.613 -81.684 49.854 Drought or flood -440.954*** 45.932 -400.368*** 37.491 -439.389*** 54.757
Household characteristics
Total livestock units 1.660*** 0.610 1.508*** 0.472
Household has a plough 31.792* 18.381 39.885** 16.958
Household owns small
machinery 47.853*** 18.692 61.735*** 17.813
Household head is a male -52.168 41.763 -49.072 39.055
Age of household head -0.318 0.544 -0.495 0.514
Household head is illiterate 25.735 16.959 14.647 16.860
Low soil quality (perception) -18.856 16.597 -38.577** 17.941
Regional dummies Boucle du Mouhoun 792.221*** 67.221 888.016*** 58.411 Cascades 1152.296*** 74.498 1236.405*** 63.031 Centre 698.223*** 79.710 752.648*** 72.940 Centre Est 1099.764*** 63.492 1163.195*** 58.795 Centre Nord 893.209*** 65.294 953.770*** 63.298 Centre Ouest 874.891*** 69.197 970.619*** 60.421 Centre Sud 887.911*** 66.997 955.638*** 60.152 Est 1148.895*** 63.120 1202.072*** 57.431 Hauts Bassins 1222.197*** 71.870 1341.122*** 59.104 Nord 723.456*** 72.557 795.274*** 67.784 Plateau Central 754.253*** 65.727 805.400*** 61.049 Sahel 655.932*** 72.260 719.063*** 91.367 Sud Ouest 677.606*** 58.046 734.585*** 54.015 Interactions Nitrogen x Nitrogen -0.110*** 0.019 -0.032** 0.016 -0.050*** 0.007
Nitro. x Low quality soil -3.453*** 1.081 -1.491* 0.804
Nitro. x Maize year before -2.892*** 1.063 -0.181 1.323 -0.491 0.668
Mean plot characteristics
(Mean) Nitrogen application -4.674** 2.096 1.646** 0.772
(Mean) Plot size -45.632** 21.294 -20.823 19.553
(Mean) Pure maize crop 135.533*** 43.122 134.693*** 44.844
(Mean) Maize year before -20.803 37.994 -17.589 36.507
(Mean) Hired labor 57.580 47.518 51.246 44.523
(Mean) Borrowed or rented
plot 84.011 61.705 123.953** 52.286
(Mean) Drought or flood -87.652* 50.458 -99.640 61.798
Number of observations 7,845 5,499 7,845
Note: a *, **, *** indicates significance at the 10, 5, and 1% levels, respectively. b Bootstrapped standard errors
17
The yield equation includes a dummy variable describing whether some external laborers had been hired to work on the plot. Because this is a choice variable for the farmer (and hence could be endogenous), we re-estimated the system of equations after excluding the variable measuring hired labor. The results remain almost unchanged and the estimated coefficient for nitrogen application rate in the yield equation is 24.4 (significant at the 1% level), similar to the coefficient reported in Table 3 (23.4). Finally, about 8% of the plots were planted with improved maize seeds. This variable was not used since it was not found significant in any of the models. As a robustness check, we re-estimated the system of equations on the sub-sample of plots that were not planted with improved seeds (7,206 observations). Results are similar to those shown in Table 3 (the coefficient of the nitrogen application rate is estimated at 21.0).
7. Marginal return and the profitability of fertilizers
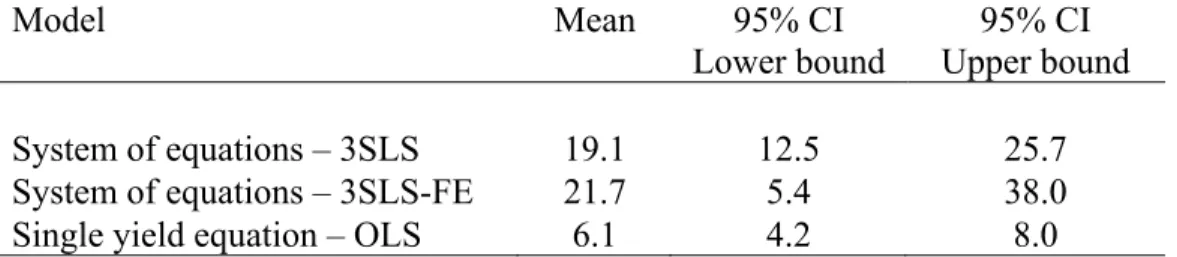
Table 4 shows the maize yield response to nitrogen application calculated from the estimated coefficients of the three models (3SLS, 3SLS-FE, and OLS) at the mean of the sample, along with 95% confidence intervals (calculated using the bootstrapped standard errors in the case of the 3SLS and 3SLS-FE models).
Table 4. Estimated maize yield response (kg/ha) at the sample mean
Model Mean 95% CI
Lower bound
95% CI Upper bound
System of equations – 3SLS 19.1 12.5 25.7
System of equations – 3SLS-FE 21.7 5.4 38.0
Single yield equation – OLS 6.1 4.2 8.0
The maize yield response is estimated at 19.1 kg/ha in our preferred model (3SLS), varying between 13 and 26 kg/ha with a 95% level of confidence. This is in the range of previous estimates reported in the literature for other countries in SSA (Jayne and Rashid, 2013). The estimated yield response obtained using the OLS model is significantly biased downwards due to the lack of control for endogeneity of nitrogen use. The maize yield response calculated from the 3SLS-FE model is 22 kg/ha, closer to the 3SLS estimate, but less precise due to the lower number of observations.
The impact of soil conditions on (marginal) maize yield response to nitrogen application is illustrated in Table 5. Using the 3SLS estimates, we derive the quantity of nitrogen that maximizes maize yield for different soil conditions, in particular soil quality and the type of crop grown the year before. Maize yield response is calculated based on the average use of nitrogen under different soil conditions. The quantity of nitrogen that maximizes maize yield is estimated at 77 kg/ha and the maize yield response at 14.3 kg/ha when the soil is of low quality and maize was grown on the plot the year before. With a high quality soil and when the plot was not planted
18
with maize the previous year, the nitrogen application that maximizes maize yield is estimated at 106 kg/ha and maize yield response is 19.6 kg/ha.
Table 5. Nitrogen application that maximizes maize yield under different soil conditions (95% confidence interval is shown in brackets)
Low quality soil Maize grown year before Optimal N application (kg/ha) Maize yield response (kg/ha) yes yes 77 [65;89] 14.3 [7.8;20.8] yes no 91 [75;106] 16.3 [8.8;23.8] no yes 93 [84;102] 16.9 [9.9;23.9] no no 106 [93;119] 19.6 [11.4;27.7]
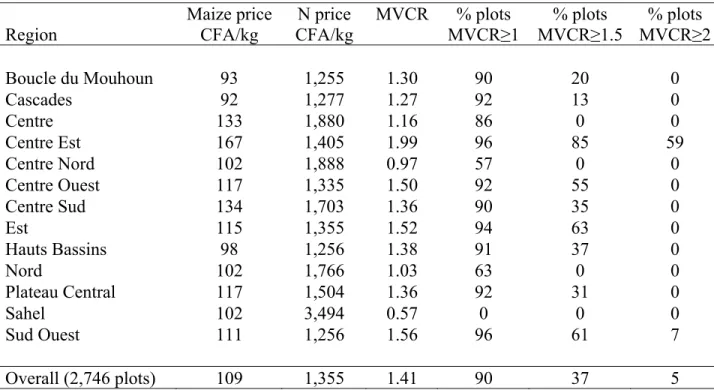
We next assess the profitability of fertilizer use on the plots that received nitrogen (2,746 observations), by comparing the expected increase in revenue induced by the use of an extra kilogram of nitrogen with its cost (Table 6). In order to lower the risk of measurement error and possible endogeneity of household-specific prices, we use median prices in each of the 13
regions, for both maize and nitrogen. Nitrogen prices17 were derived from the reported quantity
and value of fertilizer purchased by farmers. As sources of fertilizer include public sources, non-governmental organizations and farmers’ organizations, these reported fertilizer prices may not fully reflect the market price of fertilizer. The average price of nitrogen was 1,355 CFA franc/kg (approximately 3 USD/kg) in our sample, with variations across regions (from 1,255 CFA franc/kg in Boucle du Mouhoun to 1,888 CFA franc/kg in Centre Nord and 3,494 CFA franc/kg in Sahel). These values seem realistic in comparison to prices reported in a recent World Bank report (Siri, 2013): without any subsidies, the price of nitrogen in Burkina Faso was estimated at 1,961 CFA franc/kg while the subsidized price was estimated at 1,156 CFA franc/kg. Except for the case of Sahel, the regional median prices observed on our sample are all within this range. The average selling price of maize, as reported by the farmers, was 109 CFA franc/kg (approximately 235 USD per ton), varying from 92 CFA franc/kg in the Cascades region to 134 CFA franc/kg in Centre Sud. While slightly lower, these prices are in line with the producer prices in the main markets reported by the National Office for Food Security Stock for the 2008/2009 production season (see Pale, 2010). Differences in prices between regions reflect in part the differences in maize production areas with the main maize growing regions having relatively lower maize selling prices. Moreover, trade between surplus areas and neighboring deficit areas may also explain these price differences.
17 The price of 1 kg of nitrogen in urea is the price per tonne of urea divided by 460 as urea contains 46% nitrogen.
The price of 1 kg of nitrogen in NPK is the price per tonne of NPK divided by 140 as the NPK fertilizers used in the study area contain 14% nitrogen.
19
Using the estimated marginal yield response, we calculate the marginal value cost ratio (MVCR) of applying nitrogen for each plot which received some fertilizers. In our sample, the average MVCR is 1.41 with significant variation across regions: it varies from 0.57 in Sahel to 1.99 in Centre Est. Fertilizers are found to be profitable on 90% of the plots if a threshold of 1 is used (which is in line with the behavior observed on our data since those plots actually received fertilizers). But a threshold of 1 does not take account of any transaction costs (including
transportation costs) and any risk premium if farmers are risk averse.18 If we instead consider a
threshold of 1.5 and 2 as is common in the literature (Jayne and Rashid, 2013; Sheahan et al., 2013), then fertilizers are found to be profitable on 37% and on 5% of the plots, respectively. Hence, if our model provides an adequate representation of farmers’ behavior, then our results would suggest that the threshold for those plots which received fertilizers was probably close to 1 (which may correspond to farmers who have low transactions costs and/or low risk aversion).
Table 6. Price of maize, nitrogen, and MVCR, by region
Region Maize price CFA/kg N price CFA/kg MVCR % plots MVCR≥1 % plots MVCR≥1.5 % plots MVCR≥2 Boucle du Mouhoun 93 1,255 1.30 90 20 0 Cascades 92 1,277 1.27 92 13 0 Centre 133 1,880 1.16 86 0 0 Centre Est 167 1,405 1.99 96 85 59 Centre Nord 102 1,888 0.97 57 0 0 Centre Ouest 117 1,335 1.50 92 55 0 Centre Sud 134 1,703 1.36 90 35 0 Est 115 1,355 1.52 94 63 0 Hauts Bassins 98 1,256 1.38 91 37 0 Nord 102 1,766 1.03 63 0 0 Plateau Central 117 1,504 1.36 92 31 0 Sahel 102 3,494 0.57 0 0 0 Sud Ouest 111 1,256 1.56 96 61 7 Overall (2,746 plots) 109 1,355 1.41 90 37 5
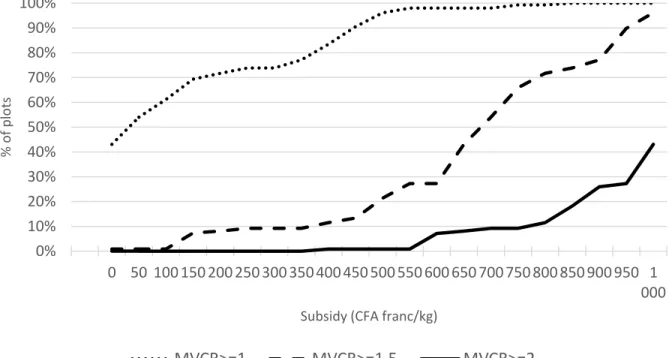
We now turn our attention to the plots on which fertilizers were not applied (5,099 observations). For each of these plots, we calculate a hypothetical MVCR under the assumption that the plot received a quantity of nitrogen which was equal to the average nitrogen application in the region. We assume that maize could be sold at the median regional price. For the price of nitrogen, we consider a range of prices varying from 2,000 CFA franc/kg (which corresponds roughly to the national unsubsidized price) to 1,000 CFA franc/kg (roughly the national subsidized price) and calculate, for each of these prices, the percentage of plots for which the MVCR is greater than 1, 1.5, and 2. Our findings are shown in Figure 3. The horizontal axis is the level of the subsidy that varies from 0 CFA franc/kg (unsubsidized price) to 1,000 CFA franc/kg. The vertical axis measures the percentage of plots on which fertilizers are found to be profitable depending on the
18 Wanzala-Mlobela et al. (2013) estimate that most farmers have to travel at least 30 km to buy fertilizers, which
would translate into an extra 50 CFA franc per kg of nitrogen. This estimate is, of course, very rough since the distance to fertilizer suppliers may vary significantly across regions.
20
chosen threshold. Without subsidization and with a threshold set at 1, fertilizers are found to be profitable on 43% of the plots. With a subsidy set at 1,000 CFA franc/kg, then fertilizers are profitable on all plots. If a threshold of 1.5 is considered instead, then a subsidy of 700 CFA franc/kg is necessary for fertilizers to be profitable on 50% of the plots but fertilizers would become profitable on all plots with a subsidy set at 1,000 CFA franc/kg. Finally, with a threshold set at 2, 43% of the plots would be profitable if the subsidy were set at 1,000 CFA franc/kg.
Figure 3. Percentage of plots for which MVCR is equal to or greater than 1, 1.5 and 2, as a function of the level of the subsidy (CFA franc/kg); reference (unsubsidized) price of N is 2,000 CFA franc/kg
We thus find that fertilizers should have been profitable for a number of plots which did not receive any fertilizers, under the current level of prices, even when the MVCR threshold is set at 1.5. This suggests that profitability (or lack of profitability) was not the main reason for farmers’ low adoption of chemical fertilizers. There is anecdotal evidence that some farmers were willing to use fertilizers but faced difficulties in accessing subsidized inputs (Wanzala-Mlobela et al., 2013): first, the demand from farmers was estimated at the district level and these estimates may be arbitrary and far from farmers’ actual needs; second, the allocation of subsidized fertilizers across provinces might have been influenced by political and budgetary considerations; third, the amount of fertilizers allocated to each farmer might have differed from their actual demand if they were unable to present proof of their needs (based on evidence of crops planted and cultivated areas). 0% 10% 20% 30% 40% 50% 60% 70% 80% 90% 100% 0 50 100 150 200 250 300 350 400 450 500 550 600 650 700 750 800 850 900 950 1 000 % of plots Subsidy (CFA franc/kg) MVCR>=1 MVCR>=1.5 MVCR>=2
21
8. Conclusion
In this article, we estimate the profitability of fertilizers for maize farmers in Burkina Faso, where a fertilizer subsidy program was launched in 2008 to foster fertilizer use and cereal production. Using data from 7,845 plots, we estimate the maize yield response to be around 19 kg/ha, in the range of previous estimates reported in the literature for other countries in SSA (Jayne and Rashid, 2013). Yield response to nitrogen is found to depend on soil characteristics, confirming earlier results by Marenya and Barrett (2009a) for Kenya. In particular, the maize yield response is found to be lower on lower quality soils and when maize was grown on the plot the year before. The average MVCR is estimated at 1.41 for the plots which received some fertilizers and the MVCR is found to be greater than 1 for 90% of these plots. There is, however, significant variation across regions, with MVCR varying from 0.57 in Sahel to 1.99 in Centre Est. This is mainly explained by regional differences in maize and fertilizer prices, with some anecdotal evidence that differences in fertilizer prices were driven partly by unequal opportunities for farmers to access subsidized fertilizers.
Calculations made on plots which did not receive any fertilizers show that fertilizers should have been profitable on a number of plots at the current (2008) level of maize and fertilizer prices, even if an MVCR threshold greater than 1 is considered. This suggests that lack of, or low, profitability might not have been the main factor driving low uptake of fertilizers among maize growers in Burkina Faso. Access to credit was found to be among the most important factors explaining the adoption of chemical fertilizers, which confirms earlier findings that increasing the availability of credit is a prerequisite for increasing adoption of fertilizers among farmers in SSA (e.g., Croppenstedt et al., 2003; Moser and Barrett, 2006). An inadequate supply of subsidized fertilizers was also reported and it appears essential for the government of Burkina Faso to put in place measures that guarantee farmers’ actual needs for fertilizers are fulfilled. Policies that encourage adoption of soil conservation practices may also be beneficial and indirectly increase the uptake of fertilizers, since profitability is higher on soils of better quality. The data used for this study were cross-sectional, which makes it more difficult to control for plot- and household-specific unobserved characteristics. However, our estimates were found to be robust when compared to estimates obtained using a fixed-effects model. Our results also show that not taking into account the endogeneity of nitrogen use in the yield equation may produce biased estimates of the maize yield response to nitrogen. One caveat of our model is that it disregards uncertainty and assumes farmers’ preferences are risk-neutral. Allowing for non-neutral risk preferences and being able to quantify the risk premium induced by the adoption of chemical fertilizers would bring additional insights into this subject. We hope to undertake research on these aspects in the near future.
22 References
Barrett, C. B., Moser, C. M., McHugh, O. V., & Barison, J. (2004). Better Technology, Better Plots, or Better Farmers? Identifying Changes in Productivity and Risk among Malagasy Rice Farmers, American Journal of Agricultural Economics 86(4): 869-888.
Burke, W. (2012). Determinants of Maize Yield Response to Fertilizer Application in Zambia: Implications for Strategies to Promote Smallholder Productivity. Ph.D. Thesis, Michigan State University, East Lansing, MI.
Chamberlain, G. (1980). Analysis of Covariance with Qualitative Data, Review of Economic
Studies 47: 225–238.
Conley, T. G. & Udry, C. R. (2010). Learning about a New Technology: Pineapple in Ghana,
American Economic Review 100(1): 35–69.
Croppenstedt, A., Demeke, M. & Meschi, M. M. (2003). Technology Adoption in the Presence of Constraints: the Case of Fertilizer Demand in Ethiopia, Review of Development Economics
7(1): 58–70.
Dercon, S. & Christiaensen, L. (2011). Consumption Risk, Technology Adoption and Poverty Traps: Evidence from Ethiopia, Journal of Development Economics 96(2): 159–173.
DPSA (2007). Méthodologie du Recensement Général de l’Agriculture, Technical report, Direction de la Prospective et des Statistiques Agricoles (DPSA).
Druilhe, Z. & Barreiro-Hurlé, J. (2012). Fertilizer Subsidies in Sub-Saharan Africa, Technical
report, ESA Working Paper.
Duflo, E., Kremer, M. & Robinson, J. (2008). How High Are Rates of Return to Fertilizer? Evidence from Field Experiments in Kenya, American Economic Review 98(2): 482–88.
Giné, X. & Yang, D. (2009). Insurance, Credit, and Technology Adoption: Field Experimental Evidence from Malawi, Journal of Development Economics 89(1): 1–11.
Holden, S. T. & Ludunka, R. W. (2014). Input Subsidies, Cash Constraints, and Timing of Input Supply, American Journal of Agricultural Economics 96(1): 290–307.
Jayne, T., Mather, D., Mason, N. & Ricker-Gilbert, J. (2013). How Do Fertilizer Subsidy Programs Affect Total Fertilizer Use in Sub-Saharan Africa? Crowding out, Diversion, and Benefit/Cost Assessments, Agricultural Economics 44(6): 687–703.
Jayne, T. & Rashid, S. (2013). Input Subsidy Programs in Sub-Saharan Africa: A Synthesis of Recent Evidence, Agricultural Economics 44(6): 547–562.
Krishnan, P. & Patnam, M. (2014). Neighbors and Extension Agents in Ethiopia: Who Matters More for Technology Adoption? American Journal of Agricultural Economics 96(1): 308–327.
23
MAFAP (2013). Review of food and agricultural policies in Burkina Faso, Mafap country report
series, FAO, Rome.
Marenya, P. P. & Barrett, C. B. (2009a). State-conditional Fertilizer Yield Response on Western Kenyan Farms, American Journal of Agricultural Economics 91(4): 991–1006.
Marenya, P. P. & Barrett, C. B. (2009b). Soil Quality and Fertilizer Use Rates among Smallholder Farmers in Western Kenya, Agricultural Economics 40(5): 561–572.
Matsumoto, T., & Yamano, T. (2011). Optimal Fertilizer Use on Maize Production in East Africa. In T. Yamano, K. Otsuka, F. Place (Eds.). Emerging Development of Agriculture in East Africa: Markets, Soil, and Innovations. Springer, The Netherlands.
Minten, B., Koru, B. & Stifel, D. (2013). The Last Mile(s) in Modern Input Distribution: Pricing, Profitability, and Adoption, Agricultural Economics 44(6): 629–646.
Morris, M., Kelly, V. A., Kopicki, R. J. & Byerlee, D. (2007). Fertilizer Use in African Agriculture: Lessons Learned and Good Practice Guidelines, Technical report, World Bank. Moser, C. M., & Barrett, C. B. (2006). The Complex Dynamics of Smallholder Technology Adoption: The Case of SRI in Madagascar, Agricultural Economics 35(3): 373-388.
Mundlak, Y. (1978). On the Pooling of Time Series and Cross Section Data, Econometrica
46(1): 69–85.
Pale, E. (2010). Transmission des fluctuations et prix de parité à l’importation du riz et maïs au Burkina Faso, Technical report, Système d’Information sur les Marchés du Burkina (SIM-Burkina). In French.
Pan, L. & Christiaensen, L. (2012). Who is Vouching for the Input Voucher? Decentralized Targeting and Elite Capture in Tanzania, World Development 40(8): 1619–1633.
Schwartz, A. (2008). L’évolution de l’agriculture en zone cotonnière dans l’Ouest du Burkina Faso, in J.-C. Deveze (ed.), Défis agricoles africains, Karthala - AFD.
Sheahan, M., Black, R. & Jayne, T. (2013). Are Kenyan Farmers Under-utilizing Fertilizer? Implications for Input Intensification Strategies and Research, Food Policy 41(0): 39 – 52. Shonkwiler, J. & Yen, S. T. (1999). Two-Step Estimation of a Censored System of Equations,
American Journal of Agricultural Economics 81(4): 972–982.
Siri, A. (2013). Revue diagnostique des dépenses publiques de base dans le secteur agricole (2004-2012) du Burkina Faso: Les dépenses d’intrants, Technical report, Banque mondiale. In French.
Smale, M., Byerlee, D. & Jayne, T. (2013). Maize Revolutions in Sub-Saharan Africa, in K. Otsuka & D. F. Larson (eds), An African Green Revolution, Springer Netherlands, pp. 165– 195.
24
Suri, T. (2011). Selection and Comparative Advantage in Technology Adoption, Econometrica
79(1): 159-209.
Takeshima, H. & Nkonya, E. (2014). Government Fertilizer Subsidy and Commercial Sector Fertilizer Demand: Evidence from the Federal Market Stabilization Program (FMSP) in Nigeria,
Food Policy 47(0): 1 – 12.
Wanzala-Mlobela, M., Fuentes, P. P. & Mkumbwa, S. (2013). NEPAD Agency Policy Study: Practices and Policy Options for the Improved Design and Implementation of Fertilizer Subsidy Programs in Sub-Saharan Africa, Technical report, NEPAD.
World Bank (2007). World Development Report 2008: Agriculture for Development, World Development Report, The World Bank, Washington, D.C.
Xu, Z., Guan, Z., Jayne, T. & Black, R. (2009). Factors Influencing the Profitability of Fertilizer Use on Maize in Zambia, Agricultural Economics 40(4): 437–446.
Yanggen, D., Kelly, V. A., Reardon, T. & Naseem, A. (1998). Incentives for Fertilizer Use in Sub-Saharan Africa: A Review of Empirical Evidence on Fertilizer Response and Profitability,
Food Security International Development Working Papers 54677, Michigan State University,
Department of Agricultural, Food, and Resource Economics.
Zerfu, D. & Larson, D. F. (2010). Incomplete markets and fertilizer use: evidence from Ethiopia,
25 Appendix
Table A1. Nitrogen application equation – 3SLS estimation results (7,845 plots)
Nitrogen application equation Coef.a Std. Err.b P>z
Plot characteristics
Plot size (ha) -1.666*** 0.541 0.002
Plot located in the plains (0/1) 4.802 3.800 0.206
Pure maize plot (0/1) 4.914 3.879 0.205
Maize grown year before (0/1) -6.614*** 2.311 0.004
Borrowed or rented plot (0/1) -6.129 4.167 0.141
Drought or flood (0/1) -1.632 5.638 0.772
Household characteristics
Total livestock units 0.005 0.020 0.793
Fertilizer price (CFA franc/kg) -0.015 0.021 0.471
Less than one hour to market (0/1) 3.243* 1.703 0.057
Household head is a male (0/1) 9.003** 4.225 0.033
Age of the household head -0.023 0.049 0.640
Household head is illiterate (0/1) -0.116 1.326 0.931
Low soil quality (perception) (0/1) -3.228** 1.539 0.036
Regional dummies Boucle du Mouhoun 10.830 8.825 0.220 Cascades 3.999 8.807 0.650 Centre -5.711 16.771 0.733 Centre Est -0.411 9.688 0.966 Centre Nord -0.850 25.971 0.974 Centre Ouest 17.965* 9.373 0.055 Centre Sud 14.919 11.287 0.186 Est -1.121 9.890 0.910 Hauts Bassins 11.005 8.844 0.213 Nord -16.743 10.872 0.124 Plateau Central -7.137 22.739 0.754 Sahel 835.628 1408.407 0.553 Sud Ouest 0.097 9.807 0.992
Mean plot characteristics
(Mean) Plot size 1.889** 0.790 0.017
(Mean) Plot located in the plains -4.269 4.530 0.346
(Mean) Pure maize plot 9.266** 4.300 0.031
(Mean) Maize grown year before -1.992 2.901 0.492
(Mean) Borrowed or rented plot 6.480 4.457 0.146
(Mean) Drought or flood -8.242 6.689 0.218
Note: a *, **, *** indicates significance at the 10, 5, and 1% level, respectively. b Bootstrapped standard errors