are hOusehOLD BusINesses
cONsTraINeD IN TheIr access
TO creDIT?
camille saint-macary
yoann Lamballe
This chapter proposes an overview of the credit market that serves the formal and informal HBs in Vietnam. Credit access is indeed an important aspect of informal bu-sinesses, as it enables intertemporal decisions, such as investment as well as income and consumption smoothing, and it offers HBs a means to bear shocks. In a fluctuating economic and institutional context, where insurance mechanisms are often inexistent or incomplete, accessing credit may thus be an important determinant of economic performance. However, due to their small size, their lack of collateral or their informal character, many HBs are likely to remain excluded from the main credit channels pro-vided by commercial banks, and they are forced to rely on expensive informal credit suppliers, on their business partners or on their friends and relatives to access liquidity. Different types of lenders coexist in Vietnam’s credit market: formal credit institutions that are regulated by the state such as banks, microfinance institutions (MFI), mass organisations and informal credit institutions that are unlicensed (e.g. friends and family, customers and suppliers, usurers and other types of lenders). As other studies on Vietnam have suggested, these suppliers are quite dynamic and offer a plurality of products (differing in average value lent, the collateral requirements, the interest rate and the duration of the loan) that the person applying for credit can access depending on his or her characteristics and needs. The significant presence of informal credit as a source of funding shows that formal lenders cannot adequately meet the demand of every HB.
On the demand side, different profiles of HBs are present on the market and they differ in their needs and access, and some appear to be more constrained than others. Using the rich information on the topic contained in the 2014/15 HB&IS survey, this chapter characterizes the credit market by examining both the supply and the demand,
07
| The household Businesses and the Informal sector in vietnam | chapter 07
188
and by analysing the extent and determinants of credit constraints. This chapter esti-mates that larger household businesses whose owners have greater human and social capital tend be less credit constrained. The rationing of credit by formal institutions, due mostly to their inefficiency, does not adequately meet the credit demand, leaving some HBs rejected or self-rejected from the credit market. Those HBs cannot provide enough guaranties for commercial banks, are not targeted by MFIs and do not have the required social capital to overcome asymmetry of information when applying for informal loans. This chapter is organised as follows: After presenting and describing the main lenders and the characteristics of the loans they offer in section 1, we examine the demand for credit among HBs. In the last part of this chapter we analyse the extent and deter-minants of credit rationing among HBs.
1.
CHaRaCTERISINg THE CREDIT SUpply TO HBS IN VIETNam
The World Bank’s Doing Business report of 2016 surprisingly ranks Vietnam 28th in terms of ease of getting credit, which is above countries such as Indonesia, China, Thailand and the Philippines.1 This high ranking is mainly due to the efforts that authorities have made to improve the credit information system. Multiple reforms took place between 2011 and 2016 to improve the legal framework in order to faci-litate access to credit and improve its allocation. These measures consisted in giving borrowers the right to examine their own credit report and data (2011) and in creating a new credit bureau2 in order to expand the borrowers’ coverage and improve the credit information system (2014-2016).
1.1. a variety of actors
Following former studies on Vietnam’s credit market (Barslund and Tarp, 2007), we distinguish two broad segments: a formal segment and an informal one. The formal segment of credit supply is composed of officially licensed institutions such as com-mercial banks, but also state-owned microfinance institutions that are closely related to mass organisations. The Vietnamese microfinance system is uncharacteristic of
1. The database is composed of private limited liability companies which have their headquarters and only a base of operations in the largest city, up to 50 employees and are 100 per cent domestically owned.
2. An information collection agency that aims to report the ability of individuals and firms to repay debt. Their sources predominantly come from financial institutions.
countries with a strong presence of those types of institutions, as most of it is control-led by the state: Since 2007, more than 50 per cent of the formal credit delivered to the economy has come from state-owned commercial banks (ADB, 2014). Microfinance institutions and mass organisations are merged into the same category for the analysis as they regroup the types of lenders whose purpose is mainly development oriented. The two main microfinance institutions in Vietnam are the Vietnamese Bank for Social Policies (VBSP) and the Vietnam Bank for Agriculture and Rural Development (VBARD), and are both state-owned institutions. At the end of 2013, 82 per cent of the microfi-nance clients and outstanding microloans belonged to one of them (ADB, 2015). The VBSP, whose role is to offer microloans at low interest rates to a targeted population composed mainly of poor households, outsources its lending activities to locally-based mass organisations in order to sustain low operating costs. The VBARD is a profit- oriented bank whose role is to support rural development by providing loans to agricultural and non-agricultural enterprises. Its interest rates are higher than the VBSP’s, and there is little competition between the two institutions. Though they are structu-rally different and do not target the same population, their main goal is to provide rural areas with affordable credit to help them increase productivity and production. In addition, 50 major semiformal MFIs are also present in Vietnam’s microfinance sector, and they are mostly related to mass organisations and are funded by local govern-ments and by domestic and international private donors.
On the other hand, a multitude of informal lenders who are not officially registered also supply loans. Those lenders are divided in the literature into two broad categories: non-profit and profit-oriented. We include in the first category loans from relatives and friends who offer those loans at a low or no interest rate. In the second category we include subcategories of loans from customers or suppliers of HBs, loans from usurers and money lenders, and a subcategory grouping of loans from other sources. We believe that these products are sufficiently distinct to be considered separately. Formal and informal institutions that lend money differ in their capacity to overcome information asymmetry. While banks and other formal lenders often require mortgage collateral, informal lenders mainly rely on trust if the owner is part of their social network and/or they lend money at high interest rates.
Data shows that both types of lenders are very active in the credit market that serves HBs, with formal lenders covering a larger share of the market. Formal institutions re-present about 62 per cent of the total amount of credit supplied to HBs, and informal institutions 38 per cent (see Figure 7.1).
| The household Businesses and the Informal sector in vietnam | chapter 07
190
The co-existence of formal and informal lenders in the same territory is common in developing countries, and this is notably the case in Vietnam (Barslund and Tarp, 2007; Saint-Macary, 2015). This may not be entirely explained by the segmentation of the credit demand, i.e. the existence of a constrained segment that can only access credit through informal lenders and of an unconstrained segment that borrows from banks. As explained by Kochar (1997), Chaudhuri (2001) and Boucher and Guirkinger (2007), the formal and informal credit supplies may well complement each other, offering different types of loans that respond to different preferences and needs.
0 % 10 % 20 % 30 % 40 % 50 % 60 % 70 % 100 % 80 % 90 % Usurer
Customer & supplier Other informal loans
Banks Microfinance & Mass org. Friends & family
Total Informal / Rural Formal / Rural Informal / Urban Formal / Urban
Source: 2014/15 HB&IS survey, VASS-CAF & IRD-DIAL; authors’ calculations
fIGure 7.1.
markeT shares of dIfferenT lender TYpes In The hB credIT markeT BY reGIsTraTIon sTaTus and GeoGraphIc area of The hBs
Throughout the country, commercial banks are the primary suppliers of credit to HBs: They represent 53 per cent of the total amount granted to HBs since 2011. Microfinance institutions and mass organisations share a smaller part of the formal credit market that serves HBs, a share which is nevertheless significant at the natio-nal level at 9 per cent of the total loan supply. At the nationatio-nal level, informal lenders comprise a smaller share than formal lenders: 38 per cent. Friends and relatives are the primary credit supplier in this segment of lenders, and they comprise 79 per cent of the informal credit supply. Usurers are the second largest group of informal lenders, and other types of informal lenders comprise marginal shares of the credit supply offered to HBs.
Figure 7.1 further decomposes the market share held by the different lenders by different types of HBs. This decomposition shows striking differences between rural and urban HBs and between formal and informal HBs. Commercial banks represent 78 per cent of the entire amount of credit granted to urban formal HBs since 2011. In comparison, these institutions provide only 32 per cent of the amount lent to their informal counterparts. Furthermore, they account for relatively greater shares of the credit supply to both informal and formal HBs in rural areas, 42 per cent and 44 per cent respectively. The informal segment of lenders is more important for formal rural HBs and for informal urban HBs, where it represents around 50 per cent of the amount lent. The greater reliance of rural entrepreneurs on informal credit may be explained both by a supply and a demand effect. Apart from the VBARD and microfinance institutions, which are well developed in rural areas, the formal credit supply is usually less avai-lable in rural areas as the main commercial banks concentrate their activities in urban centres. It is indeed more costly to lend in rural areas, where cash flows fluctuate more strongly and transactions costs are higher. A second explanation is that the commercial credit supply is also less adaptable in terms of the duration of loans or the required collateral, and some rural entrepreneurs may prefer instead to turn to informal lenders, in particular to their friends and relatives, who are deemed more flexible and whose supply may fit better their needs and preferences.3
3. Boucher and Guirkinger (2007) and Guirkinger (2008) in Peru show that in spite of a formal credit supply that is advantageous and flexible, many households prefer to borrow from the informal sector, where they borrow at higher rates because of high risk aversion. Indeed, the perceived risk of losing their main and often only asset (i.e. their land) pushes farmers to rely on more expensive credit sources.
| The household Businesses and the Informal sector in vietnam | chapter 07
192
In addition to rural/urban differences, distinct lending patterns can be observed between informal and formal HBs in both rural and urban areas. First, microfinance and mass organisations represent 14 to 17 per cent of the informal HB market share and 4 to 6 per cent of the formal HB market share. Second, informal HBs borrow money from usu-rers more often than formal HBs do, 8 to 15 per cent and about 1 percent respectively. This indicates that the microfinance sector targets entrepreneurs who face difficulties borrowing from commercial banks, but that this supply remains insufficient to cover the entire demand, forcing some informal HBs to continue to rely on expensive loans.
1.2. lending conditions in the formal and informal sectors
One hypothesis explaining the coexistence of formal and informal lenders is that due to specific institutional constraints of the lenders in solving information asymmetries and related problems, the products offered by different lenders have different cha-racteristics and thus respond to different needs. Table 7.1 presents some descriptive statistics on the characteristics of the loans granted by different types of lenders and it shows large differences. For informal lenders, we further distinguish between small and large loans and set the threshold at 5 million VND in order to make informal loans comparable with those of the formal lending sector.
On average, commercial banks grant loans that are 6.6 times larger than the average loan offered by a microfinance institution and 4.7 times higher than the large loans of-fered by friends and family. However, the amounts of the loans are extremely dispersed, with a standard deviation of 140 million VND. The maturity of the loans is rather low, with half of the loans lent for a one-year period or less. Although these loans would be well suited for enabling long-term investment with regards to their amount, their short duration may explain why the level of investment of HBs is so weak (see Chapter 6). Other formal lenders (in the second column) are development oriented and offer less risky loans, of lower amounts, at lower interest rates and for longer maturity periods. Heterogeneity in this category is also high as different institutions are considered here: The VBSP has low interest rates thanks to a high level of subsidies; other institutions that offer slightly higher interest rates, such as VBARD, have different social objectives; and semi-formal MFIs that are not funded by the government but instead by international donors such as the CEP (Capital Aid for Employment of the Poor, which is linked to the Labour Confederation of HCMC) are based on models with higher returns on loans and self-sustainability. However, those institutions can compensate the HBs’ lack of collateral with the backing of local mass organisations or though group lending, both of which can serve as a guarantee of creditworthiness and reduce information asymmetries.
Informal lenders offer a greater number of loans than formal lenders, and this cre-dit has more heterogeneous characteristics. Such loans are, as expected, of lower amounts and of shorter duration than formal loans. This is due to lenders having less access to large capital flows and insurance mechanisms. Informal lenders compensate for the lack of insurance by applying high interest rates or by relying on social ties to select borrowers, monitor them and enforce repayment. This explains the differences we observe between lenders that are friends, relatives, customers or suppliers of the borrowers on one side and usurers on the other. Those in the first group can make use of social ties or commercial contracts held with the borrower to enforce the loan contract, while moneylenders and others cannot and therefore lend at higher interest rates. Thanks to this, friends and relatives (the informal lenders who most frequently lend money to HBs) are able to offer larger loans at low or no interest rates and for longer periods than other informal lenders. Loans from customers and suppliers are less frequent, but they are much cheaper than loans offered by usurers.
A relatively large number of loans, including loans greater than 5 million VND, are bor-rowed from usurers at extremely high interest rates. Most of these loans are borbor-rowed over very short periods – half of them have to be paid back within 4 months –, which explains the 3-digit annual interest rates.
Thus, as with other studies on Vietnam’s credit sector, the findings show that the credit supply sector that serves HBs is lively and diverse, thanks to the presence of different actors offering differentiated products.4 Nevertheless, the scarcity of long-term loans must be stressed.
However, although the credit supply is active, we need to relate it to the HBs’ demand for credit and explore to what extent it meets the needs of HBs. As shown in Figure 7.1, different types of HBs tend to rely on different lenders. We have seen that this may be the result of both supply and demand features. In particular, we have noted the importance of informal credit (from friends, relatives, customers, suppliers or money-lenders) as a source of funding for rural HBs as well as informal urban HBs. This tends to show that the formal supply does not entirely meet the demand of those HBs that find more suitable loans in the informal sector.
4. It should also be noted that the methodology used to collect the data in this survey allows the recording of a high number of loans, thanks to the inclusion of small loans from different types of lenders. The data is not directly comparable to the data from previous surveys on household businesses, such as the 2007 HB&IS in Hanoi and HCMC, and it is not possible to reach a conclusion regarding the evolution of this sector since 2007.
| The household Businesses and the Informal sector in vietnam | chapter 07 194 TaBle 7.1.
General loan characTerIsTIcs BY lender and loan sIze
commer- microfinance friends customers usurers other cial banks & mass org. & family & suppliers informal loans
<5m 5m+ <5m 5m+ <5m 5m+ <5m 5m+ # of loans 414 493 2814 769 282 49 438 159 366 62
Amount * (M VND) Mean 96.7 14.6 1.0 20.4 1.2 8.9 1.5 13.7 0.4 17.6 Median 50.0 10.0 0.2 5.0 1.0 5.0 1.0 7.0 0.2 5.0 SD 140.2 16.0 1.4 51.9 0.9 16.7 1.2 17.2 0.6 19.1 Annualised interest rate (%) ** Mean 14.2 10.9 0.6 4.4 0.0 11.7 279.3 106.0 12.0 9.1
Median 12.0 9.0 0.0 0.0 0.0 0.0 168.0 30.0 0.0 2.0 SD 14.2 6.9 5.1 9.6 0.0 18.4 338.8 205.4 60.3 14.3 Duration (months) Mean 19.0 26.4 1.2 10.3 1.2 7.0 1.8 7.9 1.2 12.3 Median 12.0 24.0 0.2 5.0 0.2 8.0 1.0 4.0 1.0 12.0 SD 14.8 18.2 2.4 21.2 2.9 4.9 2.0 11.9 1.5 9.7 *The questions about loans for amounts between 200,000 and 5 million VND
covered the six months preceding the survey, and the questions about loans for amounts less than 200,000 VND covered the two months preceding the survey. In this table, their frequency has been weighted (multiplied by 6 or 18) in order to match loans of over 5 million VND during the past 3 years.
** The annualised interest rates are calculated using the simple interest rate method, which is common in Vietnam. The annualised interest rate is calculated on the principal (the amount borrowed or the amount still owed on a loan) only by adapting the interest rate for the entire duration of the loan to the time unit of one year.
2.
HBS’ DEmaND fOR CREDIT
Measuring the demand for credit is not as straightforward as it seems. Potential borrowers frequently censor themselves and do not demand credit out of fear of re-jection. If no precautions are taken when collecting data, those who ask for credit may be confounded with those who do not ask for credit because they do not need it. It also happens that lenders agree to lend only a portion of the requested amount, and the amount borrowed therefore does not reflect the demand. As a result, only looking at the amounts borrowed is likely to lead to an underestimation of the credit demand. The definition of the demand for credit we use in this part of the chapter encompasses the demand expressed and satisfied, the demand expressed and not fully or not at all satisfied, and the demand that is not expressed. For demand that is not expressed, we distinguish among the non-borrowers those who declared that they have no need for credit from those who did not ask for a loan out of fear of rejection.
2.1. hBs’ demand for credit and their application for credit from formal and informal institutions
The data shows that between 2011 and 2015, 39 per cent of all HBs had a demand for credit, and that 28 per cent made at least one application for a formal or an informal loan of an amount greater than 5 million VND. Figure 7.2 shows the demand and per-centage of HBs that applied for credit from formal and informal lenders by different types of HBs and other characteristics.
The demand for credit among urban informal HBs is significantly lower than among other types of HBs (33 per cent of the urban informal HBs versus 41 to 42 per cent of the other types of HBs). This could be explained by the fact that in urban areas many informal businesses do not require significant investment (e.g. street food businesses and motorbike taxis). This may also be due to the fact that informal entrepreneurs in urban areas have less access to a limited credit supply.
Elsewhere, formal and informal businesses have about the same level of demand, yet they do not apply for loans from the same lenders. Formal rural and urban HBs tend to apply more often than informal rural HBs for loans from formal lenders. Nevertheless, all of these HBs frequently apply for loans from informal lenders: Between 11 and 13 per cent of the informal urban and rural HBs applied for such loans, and 23 per cent
| The household Businesses and the Informal sector in vietnam | chapter 07
196
of the formal rural HBs did so as well. The number of formal rural HBs that apply for informal loans is even more significant than the number of those that apply for formal loans. One must consider, however, that the informal lending sector comprises a he-terogeneity of actors and borrowing conditions. As seen in section 1, loans obtained from friends and relatives have distinctive characteristics from the ones obtained from other informal moneylenders in that they are borrowed at a low or no interest rate over longer periods. We already discussed this strong reliance on informal lenders in rural areas when we examined the origin of HB debt in section 1.1 and showed that a large portion of the informal loans obtained by formal entrepreneurs were from friends and relatives and that a larger share of informal entrepreneurs borrowed from moneylenders and other expensive sources.
The fact that formal rural HBs – which are supposedly less constrained in accessing formal credit – strongly rely on informal lenders tends to show that this sectoral choice is not constrained. These observations thus tend to show that, in rural areas at least, one decisive condition explaining sectoral choice in borrowing is whether an en-trepreneur has access to a social network from whom he or she is able to borrow money. One important question that remains to be answered is whether the formal and informal credit supplies, in particular the supply from an entrepreneur’s social network, complement and substitute each other. Descriptive statistics cannot answer this question, and further multivariate analysis is needed to explore this question. This is left for further research.
0 10 20 30 40 50 Quintiles of assets Q5 Q4 Q3 Q2 Q1 0 10 20 30 Sector of activity Service Trade Manuf. 0 10 20 30 40 50 Nb of employee 6 to 18 3 to 15 2 1 0 10 20 30 Quintiles of profit Q5 Q4 Q3 Q2 Q1 0 10 20 30 40 50 Age of HB > 16 years 10-16 years 5-9 years 0-4 years
Formal loans only Informal loans Self-rejected
only Formal and informal loans 0 10 20 30 40 50 Type of HB Rural / Informal Rural / Formal Urban / Informal Urban / Formal 40 50 40 50
Source: 2014/15 HB&IS survey, VASS-CAF & IRD-DIAL; authors’ calculations
fIGure 7.2.
applIcaTIon and self-rejecTIon raTes for formal and Informal credIT (MORE THAN 5 MILLION VND) accordInG To hB characTerIsTIcs (PERCENTAGE)
| The household Businesses and the Informal sector in vietnam | chapter 07
198
When decomposing the HBs’ demand for credit by sector of activity, no large diffe-rences were found in the demand for credit among HBs in the trade and service sec-tors (40 per cent of the HBs have a positive demand in both secsec-tors), but the rate was lower among HBs in the manufacturing sector (35 per cent). There is more variation in the application rates: Although HBs in the service sector have a significant demand, only a few apply for a loan (25 per cent), while in the manufacturing and trade sectors the application rates are 28 and 30 per cent respectively.
As expected, we found a positive correlation between the size of the HBs and the demand for credit: HBs that have a larger number of workers or that are in the higher quintiles of annual profit and the higher quintiles of assets have the highest application rates (see Figure 7.2). The self-rejection rates are inversely correlated with HB size, be it measured in terms of profit, assets or number of employees. Interestingly, the demand and application rates are higher among young HBs. Nascent HBs created during the last 4 years have an even greater application rate for formal loans than other HBs. This may be explained by the high investment required at the start of a business in order for it to reach a sufficient level of activity to be self-sustaining.
Finally, it is interesting to observe that the choice between formal and informal credit is not entirely explained by an HB’s sector, size or age. HBs from all sectors and of all sizes apply for informal loans. Their significant numbers in all categories indicate that the demand for informal credit cannot only be explained by constraints in accessing formal credit but also by the attractiveness of the credit offered by informal lenders, in particular that offered by friends and relatives.
Looking at the characteristics of HB owners (see Figure 7.3), there are noticeable diffe-rences related to gender. HBs run by men and women have similar demand rates (38 and 40 per cent respectively), but male owners are much more likely to apply for large loans from both formal and informal lenders.
0 10 20 30 40 50 Age 60 and more 50-59 y. 40-49 y. 30-39 y. 18-29 y. 0 10 20 30 40 50 Education College / University Vocational school Upper secondary Lower secondary Completed primary Some primary No education 0 10 20 30 40 50 Membership* No membership Other assoc. Mass org. Administration
Formal loans only Informal loans Self-rejected
only Formal and informal loans 0 10 20 30 40 50 Gender Men Women
*Note: Admin. refers to the VCP, the People’s Committee or the People’s Council. Mass org. refers to mass organisations.
Source: 2014/15 HB&IS survey, VASS-CAF & IRD-DIAL; authors’ calculations
fIGure 7.3.
applIcaTIon raTes for formal and Informal credIT (MORE THAN 5 MILLION VND) accordInG To The characTerIsTIcs of hB owners (PERCENTAGE)
| The household Businesses and the Informal sector in vietnam | chapter 07
200
There is a rather ambiguous relationship between education and the demand for credit, yet a very clear one when considering expressed demand only, i.e. applica-tions made for large loans. The probability of applying for credit strongly increases with the education level of the owner. Applying for a formal loan seems to require at least some reading and writing skills as very few owners with no education submit an application. Those who do turn almost exclusively to the informal sector, where the procedure is simpler. The rate of application to formal lenders increases with the level of education, but no such pattern has been observed regarding informal credit applications.
Age is negatively correlated with credit demand and with the rate of application for credit. It is mostly the youngest owners who apply to formal lenders (see Figure 7.3). This finding is related to the observation that the application rate is higher among young HBs (see Figure 7.2). Young entrepreneurs may be more motivated and less risk averse than older ones. They also need to acquire capital more often than older people, who may have accumulated capital over time. Finally, lenders may also prefer to lend to owners below a certain age threshold as they are more likely to live long enough to repay the loans.
Finally, we found no particular relationship between the demand for credit and mem-bership in organisations, yet there is a significant link when looking at application rates. This suggests that these organisations are a place where information about credit availability and application procedures circulates. For lenders, relying on such organisations is also a possible way to obtain information about potential borrowers, and in some cases membership is a necessary condition for accessing some types of loans (e.g. loans distributed through the Women’s Union). Members of administra-tive organisations (the Vietnamese Communist Party, the People’s Council and the People’s Committee) have a higher rate of application for credit, and from formal lenders in particular. Members of these organisations are rigorously selected and they are usually well educated. In these organisations they may acquire some information and a reputation that ease their access to credit from formal lenders (see Chapter 10). Members of mass organisations and other associations apply for credit comparati-vely less often from formal lenders than members of administrative organisations, and they turn more often to informal lenders.
2.2. determinants of the demand for credit
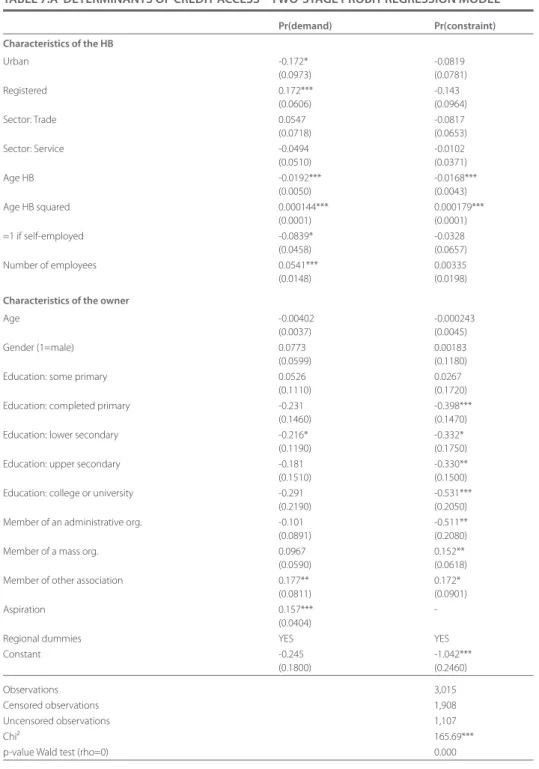
The demand for credit and the decision to apply for it seem therefore to be closely related to the HB and the characteristics of its owner. To assess the relative importance of these factors and find out more about the determinants of access to credit, we estimate using a two-stage probit model to predict HBs’ access to credit. In the first stage we model the probability of there being a positive demand for a loan grea-ter than 5 million VND, and in the second stage the probability of there being some constraints. The findings are presented in Table 7.A in the appendix, and the results from the demand model are reported in the first column. The results are relative to the demand. The advantage of this econometric approach is that it allows a multivariate analysis and enables us to explore simultaneous factors.
Among the significant determinants, rural businesses are more likely than urban ones, and formal businesses are more likely than informal ones, to have a demand for large loans. As previously observed, we found a significant relationship between the demand for credit and the age of the HBs. The probability of a demand for credit decreases at first with the age of the HBs, and then it starts to increase after an esti-mated threshold of 12 years. As previously observed, the demand for credit increases with the business size, measured here as the number of employees.5
Regarding the characteristics of HB owners, once HB characteristics are controlled for, there are no significant differences in the probability of there being a demand for cre-dit between men and women or between owners with different levels of education, as shown in the descriptive statistics. However, there are in large differences in appli-cation rates: Women and less-educated owners are less likely to apply even when they have a need for credit (see Figure 7.3). HB owners who are members of an association have a higher probability of having a demand for credit. Finally, we found that HBs whose owners responded positively to the question Do you think there is a future for an establishment like yours? (a question meant to capture the owners’ aspirations) are much more likely to have a demand for credit.
5. We do not include, as we do for the descriptive statistics, assets owned or level of profit. These variables are very much correlated with the number of employees, and their inclusion may be a source of multicollinearity. In addition, these measures of HB size are quite endogenous to credit access and may bias our results.
| The household Businesses and the Informal sector in vietnam | chapter 07
202
In sum, a large share of HBs, about 40 per cent, have a demand for credit, for purchasing raw materials, and for investing in premises and equipment. Demand is influenced by HB size, and larger HBs (in terms of manpower) are more likely to need credit. It evolves along the life cycle of a HB, and it is also influenced by registration status: Formal HBs are more likely than informal ones to ask for credit. Despite there being a positive demand, many HBs (around 12 per cent, which is a third of those that need credit) are discouraged from applying for a loan because they fear their appli-cation would be rejected or because they do not have information about how to get such a loan. In the next section we focus on all forms of credit constraints and evaluate to what extent HBs in Vietnam are affected.
3.
aRE HBS CREDIT CONSTRaINED?
This section studies the extent of credit rationing among HBs in Vietnam. From a policy vantage point, evaluating credit constraint and its determinants is particularly important, as credit constrained HBs are the ones who face difficulties investing and are unable to reach their full potential. Understanding these constraints and iden-tifying solutions is therefore important both for equity and efficiency considerations.
3.1. measuring hBs’ credit constraints
Credit rationing describes a situation in which an entrepreneur with a viable project is not able to borrow at a given interest rate. This phenomenon is common and has been explained theoretically by Stiglitz and Weiss (1981). They show that the main source of credit rationing lies in information asymmetries that generate screening, monitoring and enforcement costs at the expense of the lender. In order to maintain a reasonable interest rate, lenders must ration their supply and select borrowers on observable creditworthiness characteristics (the possession of collateral, e.g. land, mortgageable assets or household income). A number of credit demanders, gene-rally the poor, are thus denied access to credit and are limited in their investment capacity.
In this section we consider to be credit constrained those HBs that have a positive demand for credit but are not able to borrow the entire amount needed. We identify them as (1) those that had not asked for credit because they were too discouraged to ask for it (self-rejected); (2) those that had asked for loans but had had at least one
application rejected (fully rejected), and (3) those that had obtained a loan of an amount inferior than the amount asked for (partially rejected).6
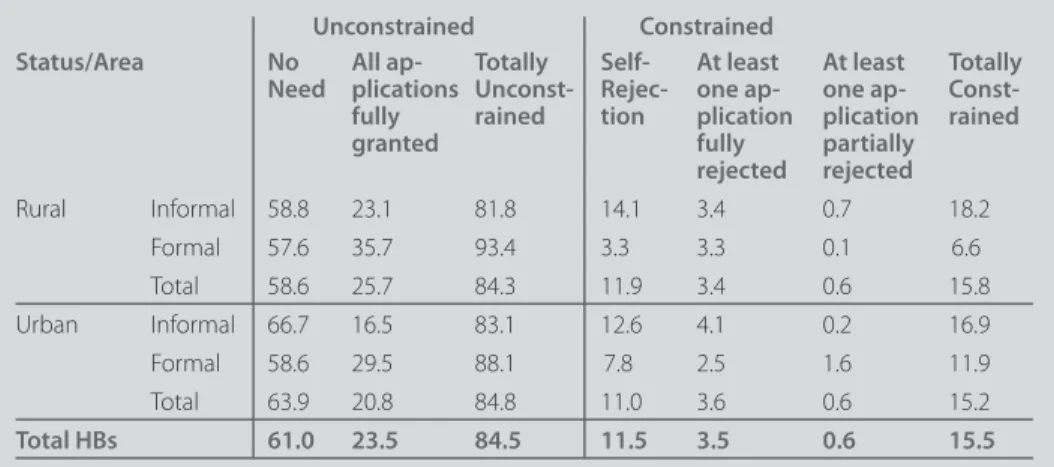
Table 7.2 displays the proportion of HBs in the various credit constraint categories, according to geographic area and registration status. Overall we found that a non-negligible share of HBs have difficulty obtaining the amount of credit they need, 16 per cent in total. The majority, 12 per cent, are self-constrained, 4 per cent have expe-rienced full rejection and less than one per cent have received less than they asked for.7
Rand (2007), in his analysis of the credit constraints of small and medium enterprises (SME) in Vietnam, found that 14 per cent of the enterprises in the manufacturing sector were denied credit after they applied, and that overall 25 per cent were credit constrained. This figure is close to ours in terms of self-rejection, but we obtained much smaller results in terms of rejection. Differences in methodology and in sam-pling do not allow for a direct comparison. Rand (2007) used data collected in 2001 from household businesses located in four of the provinces in Vietnam, while our data is more representative of the country. However, we cannot discard the fact that the
6. In their analysis of Vietnam, Barslund and Tarp (2007) define credit rationing as having an application rejected by both formal and informal lenders. Their approach thus does not take into account cases of self-rejection and cases of partial rejection by lenders.
7. This last form of constraint is perhaps underestimated due to the fact that borrowers may ask for less than needed to adapt their demand to the lenders’ lending capacity.
TaBle 7.2.
credIT raTIonInG BY GeoGraphIc area and reGIsTraTIon sTaTus (PERCENTAGE OF HBS)
unconstrained constrained
status/area no all ap- Totally self- at least at least Totally
need plications unconst- rejec- one ap- one ap-
const-fully rained tion plication plication rained
granted fully partially
rejected rejected Rural Informal 58.8 23.1 81.8 14.1 3.4 0.7 18.2 Formal 57.6 35.7 93.4 3.3 3.3 0.1 6.6 Total 58.6 25.7 84.3 11.9 3.4 0.6 15.8 Urban Informal 66.7 16.5 83.1 12.6 4.1 0.2 16.9 Formal 58.6 29.5 88.1 7.8 2.5 1.6 11.9 Total 63.9 20.8 84.8 11.0 3.6 0.6 15.2 Total hBs 61.0 23.5 84.5 11.5 3.5 0.6 15.5
| The household Businesses and the Informal sector in vietnam | chapter 07
204
gap between these two observations, one made a decade earlier than the other, can also be explained by the development of the credit market in Vietnam between 2001 and 2014.
Informal HBs constrain themselves more often than formal HBs out of fear of being rejected, and they are consequently more often constrained. Table 7.4 shows that applications from informal HBs are also more often rejected by formal lenders. Registe-ring a business appears to improve access to credit, but this is a weak determinant and it is certainly not a necessary condition for accessing formal credit. We saw in section 2 that some informal HBs are also able to access large formal loans. We have already shown in this section that registration status and geographic location are only weak determinants of access to credit. However, informal businesses appear to be much more constrained than their formal counterparts in their access to credit, and this appears to be due to their characteristics rather than because they are not registered. We explore this question through a multivariate analysis in section 3.2.
Table 7.3 displays the constraint rates of HBs according to their characteristics and those of their owners. Sector of activity appears to be a strong determinant, as almost half of the businesses engaged in service activities are constrained, while only a third of those in other sectors face difficulties.
Female entrepreneurs are also much more often constrained (and this is mostly due to self-censoring) despite the fact that many loans from MFIs are partly oriented towards women, in particular thanks to the support of the Women’s Union, and there are several reasons for this. As mentioned in a report by Hampel-Milagrosa et al. (2010), women tend to be discriminated against in credit markets as they often lack collateral and they are usually not mentioned on the household land title and may thus feel discouraged from applying. A second explanation is that according to social norms female entrepre-neurs are seen as being less creditworthy because they are engaged in less productive activities or because they are more risk averse. It may also well be that females have the kinds of businesses that are less prone to investment: They are proportionally less pre-sent than men in the manufacturing and service sectors (38 per cent and 44 per cent respectively of the HBs in those sectors are owned by women), and they are mostly present in the trade sector (72 per cent), as shown in Chapter 4, and the trade sector is where investments are the lowest (see Chapter 6). We further explore the gender issue using a multivariate approach in the next subsection to test whether the female variable remains a significant and negative determinant of credit access once business characteristics are controlled for.
As shown in Table 7.3, the probability of being credit constrained increases with the age of the owner. Above the age of 50, more than half of the entrepreneurs face strong difficulties accessing credit, probably because they are considered less creditworthy, either because they are less productive or because lending to them is considered to be more risky. Finally, the probability of being constrained strongly decreases with an increase in the education level of the owner. The probability of being rationed is about four times higher for an entrepreneur who has no education than for an entrepreneur who has attended college or university. Here again, self-rejection is the main form of rationing. Illiteracy is certainly a strong obstacle, as it may be necessary to be able to read and fill out documents when applying for a loan from a formal lender. The ability to calculate and anticipate future earnings and costs associated with investment may also be required.
TaBle 7.3.
consTraInT raTes amonG hBs wITh a demand for credIT accordInG To TheIr characTerIsTIcs and The characTerIsTIcs of The owners
credit credit Total
constrained unconstrained sector of activity Manufacturing 35.3 64.7 100 Trade 33.4 66.5 100 Service 48.8 51.2 100 Gender of hB owner Female 46.1 53.9 100 Male 32.9 67.1 100 age of hB owner 18-29 18.3 81.7 100 30-39 35.2 64.8 100 40-49 41.2 58.8 100 50-59 47.4 52.6 100 > 60 years 66.6 33.3 100 education No education 80.3 19.7 100
Some primary school 67.3 32.7 100
Completed primary school 35.7 64.3 100
Lower secondary school 39.9 60.1 100
Upper secondary school 25.5 74.5 100
Vocational and professional school 21.8 78.2 100
College or university 21.4 78.7 100
| The household Businesses and the Informal sector in vietnam | chapter 07
206
After self-rejection, which is by far the first and main source of credit rationing, constraint is also a result of lenders rejecting loan applications either partially or totally. Table 7.4 shows the proportion of unsuccessful loan applications by lender type and type of ap-plicant. Informal HBs are on average less likely to have their loan applications approved than formal HBs, with 16 and 20 per cent of their loan applications being either totally or partially rejected in both rural and urban areas respectively, while the proportions for formal HBs operating in rural and urban areas are 11 and 2 per cent respectively. Registration status appears to be a strong selection criteria in urban areas for all types of lenders, as only a very small proportion of formal HBs face rejection (partial or to-tal) compared to informal HBs. Registration status does not appear to be a factor that affects the rejection rates of formal and informal businesses in rural areas. One explana-tion for this is that lenders in rural areas have access to a wider range of informaexplana-tion and can thus use registration status as one of several factors to screen and select borrowers, while in urban areas information is scarcer and formal registration constitutes a main signal of creditworthiness. Rejection rates may also be generally higher in rural areas (among informal lenders in particular) because the global credit supply there is lower and because it is concentrated in urban centres. In 40 per cent of the recorded cases, a loan was rejected by an informal lender because of insufficient funds, while in the case of formal loans, this was the reason for 9 per cent of the applications that were rejected (see Table 7.5). Rejection by a formal lender is more often due to a lack of guaranties on the part of the borrowers (23 per cent) or documents being incomplete (16 per cent).
TaBle 7.4.
proporTIon of unsuccessful* loan applIcaTIons BY lender TYpe, GeoGraphIc area and reGIsTraTIon sTaTus for loans over or eQual To 5 mIllIon vnd (PERCENTAGE OF LOANS)
Geographic hB commer- micro- friends usurer other Total
area status cial bank finance & family informal
& mass org. loans
# of loans 439 529 845 174 123 2,110 Rural Informal 11.1 16.7 19.2 11.7 23.9 15.9 Formal 5.9 8.6 13.2 5.7 23.0 10.6 Urban Informal 20.5 16.5 20.9 25.0 10.7 19.7 Formal 2.7 1.4 2.8 0.0 1.7 2.1 Total 6.5 8.6 10.3 8.6 11.4 8.7
*Note: Unsuccessful loan applications correspond to rejected loans or credit, the granted value of which was less than 100 per cent of the amount requested.
3.2. The determinants of credit constraint
The multivariate analysis introduced in section 2.2, the results of which are reported in the right-hand side of Table 7.A in the appendix, informs us about the determinants of credit constraints among HBs that have a demand for credit. Credit constraint here takes all three forms detailed in section 3.1 and is equal to 1 if the owner self-censored him- or herself, or if he or she submitted an application which was totally or partially rejected.
The results show that once other factors are taken into account, geographic location and registration status do not significantly affect access to credit.8 There is, however, a quadratic relationship to the age of a HB, and the younger ones are more often constrai-ned than the older ones, but after a certain age HBs again face strong constraints. Thus, experience matters, but after a certain time HBs may not be considered (or consider themselves) to be creditworthy anymore. The size of a HB, measured here by the
num-8. We also introduced an interacted variable to test for the differentiated effect of business registration in urban and rural areas, but the coefficient turned out to be insignificant.
TaBle 7.5.
reasons GIven for compleTe rejecTIon of applIcaTIons for loans over or eQual To 5 mIllIon vnd over The pasT 3 Years
reasons for loan rejection (%)
all loans formal Informal
loans loans
# of observed rejected
loans in the sample 164 61 103
Lender had no funds 26.6 8.8 40.2
Insufficient guaranties 15.1 22.6 9.3
Too much debt 9.9 4.9 13.8
Complete but unconvincing documents 7.5 14.6 2.0
Incomplete documents 6.9 16.0 0.0
Insufficient initial capital 6.1 5.6 6.5
Profile did not fit the loan
(i.e. not poor/not a farmer) 5.8 13.4 0.0
Activity/enterprise deemed not viable 4.7 7.2 2.7
No answer from the lender 0.9 1.1 0.8
Do not know 16.5 5.9 24.6
Total 100 100 100
| The household Businesses and the Informal sector in vietnam | chapter 07
208
ber of employees, while being a main determinant of the demand for credit, was not found to affect the probability of being credit constrained.
In the previous sections (see Figure 7.3 and Table 7.3) we showed that male entre-preneurs are less often credit constrained than their female counterparts. However, results from the model indicate that once everything is controlled for, the gender effect is insignificant. This confirms our hypothesis that the gender gap is rather explained by the different characteristics of the businesses run by male and female entrepreneurs than by discrimination based on gender alone. Having a higher level of education considerably reduces the probability of being credit constrained, and it is correlated with a better ability to navigate application procedures and to convince lenders. In addition, better-educated individuals tend to run their businesses better and have convincing investment plans. Members of administrative organisations have a lower probability of being constrained, but members of mass organisations and other associations, everything else being equal, are more often constrained than non-members. This is, at first sight, counterintuitive as we know that such organiza-tions help to circulate information. Some microfinance programs even rely on mass organizations to select borrowers, distribute credit and collect repayments. However, as a large proportion of the population takes part in these mass organizations (39 per cent of the HB owners are a member of at least one mass organisation), the selection process may become more rigorous through this channel than through others.
4.
wHaT DO HBS NEED CREDIT fOR?
The previous sections highlighted the relatively high need for credit among HBs in Vietnam, in particular that about 40 per cent of them have a positive demand, but also that only two thirds of them were able to access the full amount needed between 2011 and 2014. This last section looks at how HBs use this credit. We thus focus here only on HBs that have applied for and obtained a loan, and we do not consider the needs of the self-constrained and the fully rejected entrepreneurs. Table 7.6 reports the different ways that HBs make use of the formal and informal loans they receive.
Our findings show that the loans are primarily used for the purchase of raw materials: Borrowers spend more than half of the money on such expenditures rather than on short-term investments. To a lesser degree the loans are used for long-term invest-ments like premises or the acquisition and maintenance of equipment. Decomposi-tion by localisaDecomposi-tion and registraDecomposi-tion status (not shown here for the sake of brevity) do
not show significant differences in how the money is used between the types of HBs. This finding is surprising as one would expect credit to be needed primarily for the financing of long-term investments and the expansion of the business. One expla-nation for this may be found in the characteristics of the loans as presented in Table 7.1. Formal loans from commercial banks are borrowed on average for a duration of 1.5 years, and half of them are for a period of less than a year, while microcredits are borrowed on average for a duration of 2.2 years. Informal loans have a significantly shorter duration and do not usually exceed one year.
Investments in premises or equipment, however, may require borrowing money for longer periods of time, as the returns may only be generated over the long term. The-refore, the question arises as to whether this surprisingly low share of long-term expen-ditures (of the total amount of credit supplied) reflects an inadequate supply or if this is due to other factors. As analysed in Chapter 11, access to credit remains an important preoccupation for 26 per cent of the HBs in Vietnam. In addition, a lack of space or pre-mises and a lack of equipment are cited as a main problem by 16 and 13 per cent of the HBs respectively. All together, these numbers tend to indicate that a substantial share of the HBs need to invest, and that the credit supply does not fully meet this need. A second issue we explore here is whether the formal and informal credit supplies complement or substitute each other. As seen in section 1, the supply in both sectors significantly differs depending on various loan characteristics (i.e. amount, duration and interest), and use of this credit may differ accordingly. One hypothesis often pro-posed in the literature for the coexistence of the formal and the informal sector in the same area is that the supply in each sector, due to different means used by lenders in both sectors, is different and responds to different needs. While we do not formally test this hypothesis in this chapter, a descriptive analysis can provide some insights that so far tend to contradict this hypothesis. In section 2 we observed that only a small share (8 per cent) of the HBs that have a demand for credit apply for credit in both sectors. Most HB owners choose one sector or the other.
There are some differences in how the loans obtained from each sector are used. About three quarters of the total amount borrowed from informal lenders is used to finance the purchase of raw materials, while less than 10 per cent is invested in premises or equipment. The share spent on raw materials is lower when the loan is formal, but this remains the primary use (46 per cent of the total amount). About 40 per cent of these loans are used for long-term investments. For other types of expenses, there is almost no difference between formal and informal loans.
| The household Businesses and the Informal sector in vietnam | chapter 07
210
Therefore, formal loans appear to be better suited for responding to the investment needs of HBs, but they may not be sufficient, as explained above. The fact that a large share of the formal loans are still spent on short-term expenses casts doubt on the complementary character of the formal and informal credit supplies. Rather, this tends to show that formal lenders like commercial banks and microfinance institutions could further differentiate their supply from that of informal lenders by increasing the dura-tion of their loans, and by so doing trigger long-term investment by HBs and growth in this sector.
CONClUSION
This chapter has explored access to credit and the constraints faced by HBs. It first highlighted the presence of a diversity of lenders, both formal or informal, that lend to all types of HBs, formal and informal, rural and urban. Access to credit from commercial banks is not the privilege of formal entrepreneurs only. The informal supply appears to be very heterogeneous and composed of a variety of actors, among which an entre-preneur’s social network occupies an important share. In fact, the data shows that an entrepreneur’s friends and relatives are the first source of credit for a HB in terms of the number of loans and the amount borrowed. In rural areas, social networks are the main source of credit. This is remarkable as social networks are often considered a limited source of credit, both in terms of their lending capacity and their high exposure to risk. This observation also raises some questions about the adequacy, and perhaps also the sufficiency, of the formal credit supply, as many HBs with access to formal credit turn to
TaBle 7.6.
use of The loans BY source of credIT (PERCENTAGE OF TOTAL AMOUNT)
all loans formal loans Informal loans
Business expenses (Total) 97 96.7 97.3
Purchase of raw materials 56.1 46.4 72.1
Premises 18.6 24.8 8.3
Acquisition & maintenance of equipment 12.5 14.4 9.4
Repayment of previous debts 6.5 7.7 4.5
Other businesses expenses 3.3 3.4 3
household expenses 3 3.2 2.7
Total 100 100 100
the informal sector to borrow. However, whether these two supplies are complemen-tary or substitute, i.e. whether HBs turn to informal lenders because the formal supply is insufficient or because the formal supply has not adapted to the needs of HBs is a question left for further research.
About 40 per cent of the HBs have a demand for credit, a demand that varies greatly according to the characteristics of a HB but little according to the characteristics of the owner. However, credit constraint strongly varies among the different groups of en-trepreneurs. In particular, female, older and poorly-educated entrepreneurs are more often constrained than others, but this seems to be due more to selection based on the characteristics of their business than discrimination based on their personal characte-ristics, since the results from the multivariate regression show that these variables have no significant effect. Overall, we found that a third of the HBs with a demand for credit and 16 per cent of all the HBs are constrained in their access to credit.
Finally, analyses of how credit is used show that only a small portion of the borrowed money is dedicated to long-term investments in premises or in equipment, and that a large share is used for the purchase of raw materials. This is particularly true for loans from informal sources, but it is also true, to a large extent, for loans from the formal sector. However, about a quarter of all the HBs in this survey stated that they have dif-ficulty realising long-term investments. Thus, the short- and medium-term loans (from less than a year to two years in duration) offered by the market do not seem sufficient to enable HBs to make long-term investments and thus to grow.
The findings in this chapter call for several recommendations. The first would be to explore the reasons for the high reliance of HBs, both formal and informal, on their social network to access loans; to examine the possibilities for formal lenders to better capture this demand; and to expand its supply. Second, the state also needs to address the high constraint rate observed among the HBs in need of credit. The current efforts being made by microfinance institutions with the support of the Women’s Union do not appear sufficient considering the high share of female entrepreneurs that remain credit constrained. Finally, the findings uncovered an urgent need to develop the sup-ply of long-term loans that would foster investment in the HB sector and thus promote inclusive growth.
| The household Businesses and the Informal sector in vietnam | chapter 07
212
appENDIx
TaBle 7.a deTermInanTs of credIT access – Two-sTaGe proBIT reGressIon model
pr(demand) pr(constraint) characteristics of the hB Urban -0.172* -0.0819 (0.0973) (0.0781) Registered 0.172*** -0.143 (0.0606) (0.0964) Sector: Trade 0.0547 -0.0817 (0.0718) (0.0653) Sector: Service -0.0494 -0.0102 (0.0510) (0.0371) Age HB -0.0192*** -0.0168*** (0.0050) (0.0043) Age HB squared 0.000144*** 0.000179*** (0.0001) (0.0001) =1 if self-employed -0.0839* -0.0328 (0.0458) (0.0657) Number of employees 0.0541*** 0.00335 (0.0148) (0.0198)
characteristics of the owner
Age -0.00402 -0.000243
(0.0037) (0.0045)
Gender (1=male) 0.0773 0.00183
(0.0599) (0.1180)
Education: some primary 0.0526 0.0267
(0.1110) (0.1720)
Education: completed primary -0.231 -0.398***
(0.1460) (0.1470)
Education: lower secondary -0.216* -0.332*
(0.1190) (0.1750)
Education: upper secondary -0.181 -0.330**
(0.1510) (0.1500)
Education: college or university -0.291 -0.531***
(0.2190) (0.2050)
Member of an administrative org. -0.101 -0.511**
(0.0891) (0.2080)
Member of a mass org. 0.0967 0.152**
(0.0590) (0.0618)
Member of other association 0.177** 0.172*
(0.0811) (0.0901)
Aspiration 0.157***
(0.0404)
Regional dummies YES YES
Constant -0.245 -1.042*** (0.1800) (0.2460) Observations 3,015 Censored observations 1,908 Uncensored observations 1,107 Chi² 165.69***
p-value Wald test (rho=0) 0.000
Robust standard errors in parenthesis clustered at the provincial level. Source: 2014/15 HB&IS survey, VASS-CAF & IRD-DIAL; authors’ calculations
Powered by TCPDF (www.tcpdf.org) Powered by TCPDF (www.tcpdf.org)