HAL Id: hal-01185730
https://hal.inria.fr/hal-01185730
Submitted on 21 Aug 2015
HAL is a multi-disciplinary open access
archive for the deposit and dissemination of
sci-entific research documents, whether they are
pub-lished or not. The documents may come from
L’archive ouverte pluridisciplinaire HAL, est
destinée au dépôt et à la diffusion de documents
scientifiques de niveau recherche, publiés ou non,
émanant des établissements d’enseignement et de
Nick Papoulias, Noury Bouraqadi, Luc Fabresse, Stéphane Ducasse, Marcus
Denker
To cite this version:
Nick Papoulias, Noury Bouraqadi, Luc Fabresse, Stéphane Ducasse, Marcus Denker. Mercury:
Prop-erties and Design of a Remote Debugging Solution using Reflection. The Journal of Object Technology,
Chair of Software Engineering, 2015, 14 (2), pp.36. �10.5381/jot.2015.14.2.a1�. �hal-01185730�
Mercury: Properties and Design of a
Remote Debugging Solution using
Reflection
Nick Papoulias
aNoury Bouraqadi
bLuc Fabresse
bStéphane Ducasse
aMarcus Denker
aa. RMoD, Inria Lille Nord Europe, France
http://rmod.lille.inria.fr
b. Mines Telecom Institute, Mines Douai
http://car.mines-douai.fr/
Abstract Remote debugging facilities are a technical necessity for devices that lack appropriate input/output interfaces (display, keyboard, mouse) for program-ming (e.g., smartphones, mobile robots) or are simply unreachable for local development (e.g., cloud-servers). Yet remote debugging solutions can prove awkward to use due to re-deployments. Empirical studies show us that on aver-age 10.5 minutes per coding hour (over five 40-hour work weeks per year) are spent for re-deploying applications (including re-deployments during debugging). Moreover current solutions lack facilities that would otherwise be available in a local setting because it is difficult to reproduce them remotely. Our work identifies three desirable properties that a remote debugging solution should exhibit, namely: run-time evolution, semantic instrumentation and adaptable distribution. Given these properties we propose and validate Mercury, a remote debugging model based on reflection. Mercury supports run-time evolution through a causally connected remote meta-level, semantic instrumentation through the reification of the underlying execution environment and adaptable distribution through a modular architecture of the debugging middleware.
Keywords Remote Debugging, Reflection, Mirrors, Run-Time Evolution, Se-mantic Instrumentation, Adaptable Distribution, Agile Development
1
Introduction
More and more of our computing devices cannot support an IDE (such as our smartphones or tablets) because they lack input/output interfaces (keyboard, mouse or screen) for development (e.g., robots) or are simply locally unreachable (e.g., cloud-servers). Remote debugging is a technical necessity in these situations since targeted devices have different hardware or environment settings than development machines.
Yet remote debuggers can prove awkward to use due to re-deployments in-between remote debugging sessions. Given that testing and debugging are estimated to cover roughly 50% of the developement time [Bei90b] and that validation activities - such as debugging and verifica-tion - cover 50 % to 75 % of the total developement costs [BH02], lenghty re-compilaverifica-tions and re-deployments of applications to remote targets can indeed have a negative impact on the development cycle. Empirical studies show us that on average 10.5 minutes per coding hour (over five 40-hour work weeks per year) are spent for re-deploying applications (including re-deployments during debugging) [Zer11]. This means that the specific facilities that a remote debugging solution offers (e.g.,. for incremental updating) during a remote debugging session can have a significant influence on productivity.
Moreover current solutions lack facilities that would otherwise be available in a local setting because its difficult to reproduce them remotely (e.g.,., object-centric debugging [RBN12]). This fact can impact the amount of experimentation during a remote debugging session - compared to a local setting. Empirical studies on software evolution [SMDV06] support this argument, identifying cases where the relationship or the interaction between two or more objects at runtime are more relevant to the programmer than the examination of execution at specific lines of code. Although emulators for target devices can help in this case, they are not always available, and are often of limited accuracy when sensory input or actuators are involved.
Finally remote debugging targets are becoming more and more diverse. Designing a debugging communication middleware to cover a wide range of applications (from mobile apps to server side deployments) that indeed operate under very different assumptions can be challenging. This fact has been pushing debugging middleware towards more and more extensible solutions.
In this work we identify three desirable properties for remote debugging: run-time evo-lution, semantic instrumentation and adaptable distribution. Given these properties we first evaluate existing solutions and then propose a live model for remote debugging that relies on reflection and more specifically on the concept of Mirrors [BU04]. We show how our model leverages both structural and computational reflection to meet the properties we have identified
and present its implementation in the Pharo language [BDN+09] discussing the trade-offs
that remote debugging imposes on reflective facilities. Finally we validate our proposal by exemplifying remote debugging techniques supported by Mercury’s properties, such as remote
agile debuggingand remote object instrumentation.
The contributions of this paper are the following:
• The identification of three desirable properties for remote debugging solutions. • The definition of a remote meta-level and infrastructure for remote debugging that can
exhibit these properties.
• A prototype implementation of our model and its validation.
Our work is organized as follows: we begin by providing definitions and motivation for remote debugging in Section 2. We then introduce the properties for remote debugging solutions (Section 3) that we have identified. Then in Section 4 - given these properties - we evaluate existing solutions. Section 5 presents our proposed model: Mercury. Section 6 details our prototype implementation of the Mercury model. Section 7 presents the experimental setting and validation of our proposal. Finally Section 8 concludes our work and presents future perspectives.
Developer's
end Target Devices
Deployment Log Collection 1 Coding / Compilation 2 Execution 3 4 5 Post-mortem analysis
(a) Debugging with Post-Mortem Analysis
Deployment Inspection Coding / Compilation 2 Exe cu tio n 3 Action / Modification 1 4 5 Developer's
end Target Devices
(b) Remote debugging and interaction with a live execution
Figure 1– Log-based Static Debugging vs. Remote Debugging
2
Background & Terminology
We provide working definitions for debugging that depend loosely on those given by Zeller [Zel05] and Sommerville [Som01] respectively:
Debugging is a two phases process via which a programmer: i) Relates a failure in the observational domain of a program to a defect [Bei90a, Hum99] in the program’s code and ii) Subsequently validates the elimination of a defect by applying a fix in the program’s code relating it to a success in the observational domain.
Debugger A debugger is an additional process of the execution domain of a program used for run-time analysis. The debugger acts upon the process that is being debugged (i.e., the debuggee), making a subset of the execution domain of a program part of the observational domain.
Remote Debugging Is the process of debugging, in the context where the process of the debugger runs on a different machine than that of the debuggee.
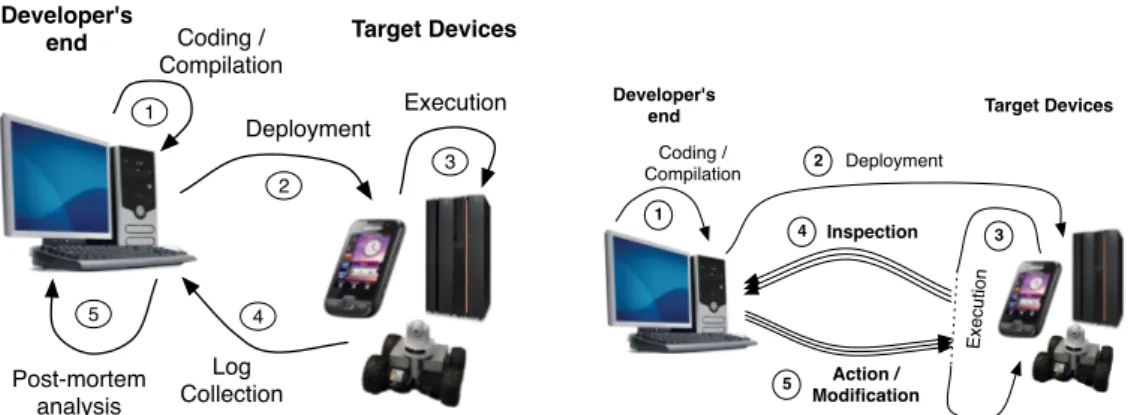
Figure 1(a) shows how developers can debug a target in absence of any support. Coding and compilation (step 1 in Figure 1(a)) need to be done on a developer machine, that is supposed to provide an IDE. Once the software is compiled, it is deployed (step 2) and executed (step 3) on the target. Next, the execution log is collected and transferred to the developer’s machine (step 4). Last, the developer can perform a post-mortem analysis of the execution log (step 5) to find out hints about defect causes.
When a problem arises during execution, the developer only relies on the log verbosity to identify the causes during the post-mortem analysis (step 5). If the log is too verbose, the developer might be overwhelmed with the amount of data. Conversely, limited logging requires to go again through a whole cycle, after adapting the code just for collecting more data. This is due to the static nature of logs whose content is determined at the coding and compilation step (step 1). These cycles for re-compilation and re-deployment are time consuming and make debugging awkward. Nevertheless logging is the most widespread technique [Zel05] for "manual" debugging since in its simplest form (of printf debugging) is accessible even to inexperienced developers and can have little to zero infrastructure requirements.
In Figure 1(b) we show the different steps of a remote debugging process. Steps 1 (coding) and 2 (deployment) are the same as before. However, the execution (step 3) is now
interruptible. This interruption is either user-generated (the developer chooses to freeze the execution to inspect it) or is based on predetermined execution events such as exceptions. Steps 4 and 5 represent the remote debugging loop. This loop takes place at execution time and in the presence of the execution context of the problem which can be inspected and modified. Step 4 represents the remote inspection phase, where information about the current execution context is retrieved from the target. While in step 5 we depict the modification phase where the developer can provide further user-generated interruption points (breakpoints, watchpoints, etc.), alter execution and its state (step, proceed, change the values of variables), or incrementally update parts of the code deployed in step 2 (save-and-continue, hot-code-swapping). Several loops can occur during the execution depending on the developers’ actions (step, proceed, user-generated interruptions) and on execution events (exceptions, errors, etc.). Having the ability to introspect and modify a live execution (without loosing the context) is a major advantage compared to analyzing static logs.
3
Desirable Properties of Remote Debugging Solutions
In this Section, we present three desirable properties for remote debugging solutions that we have identified, namely: run-time evolution, semantic instrumentation and adaptable distribution. We introduce and discuss each property individually based on a typical software stack for remote debugging.
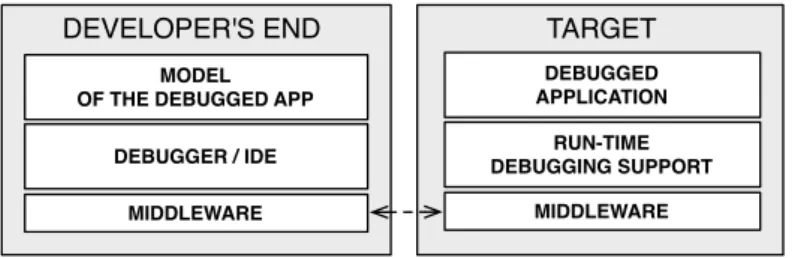
As we depict in Figure 2 the target device (on the right) that runs the debugged application must provide a middleware for communication and run-time debugging support for examining processes, the execution stack, the system’s organization, introspection of instance and local variables, etc.. On the other hand, the developer machine must provide a middleware layer, debugging tools, but also a model of the running application that describes the application running on the target (e.g., source code or breakpoints).
DEBUGGED APPLICATION
DEVELOPER'S END TARGET
RUN-TIME DEBUGGING SUPPORT
MIDDLEWARE DEBUGGER / IDE
MODEL OF THE DEBUGGED APP
MIDDLEWARE
Figure 2– Software Entities Involved in Remote Debugging.
3.1 Run-Time Evolution
Run-time evolution is the ability to dynamically inspect and change the target’s application code and state. By dynamically here we mean that inspections and changes on the target can be performed while the application is running.
In Figure 2, there is an implicit relationship between the model of the debugged application (on the developer’s end), and the state of the debugged application (on the target). This relationship can be either static or dynamic, depending on whether a change in either one of them updates the other. When a remote debugging solution supports run-time evolution, this relationship is dynamic.
The fact that the target application does not need to be restarted to be debugged and evolved allows developers to:
• Track the origins of bugs and fix them without losing the execution context.
• Fix flaws [Zel05] from within the debugger. Flaws are architectural bugs that are not associated with a specific location in the source file and require an architectural update (removing or adding new code) in order to be addressed.
• Increase productivity while debugging applications with a long startup time. • Debug critical applications (e.g., server side applications) that cannot be restarted. • Experiment with heisenbugs [Gra86] as they are observed.
In OO languages developers should be able to evolve every organizational module of the target application while debugging. These changes ought to include:
Add/Rem Packages The ability to introduce new packages1and remove existing ones.
Add/Rem Classes/Prototypes The ability to introduce new classes or prototypes and to remove existing ones.
Hierarchy/Delegation Editing The ability to add/remove superclasses or edit a delegation chain.
Add/Rem Methods The ability to introduce new methods and to edit or remove existing ones.
Add/Rem Fields The ability to add/remove fields to a class or prototype.
3.2 Semantic Instrumentation
With the term semantic instrumentation we refer to the ability of a debugging solution to alter the semantics of a running process to assist debugging. Instrumentation is the underlying mechanism through which breakpoints and watchpoints are implemented. A debugging solution instruments the running process to halt at specific locations in the code, or when specific events occur (such as variable access) to either return control to the debugging environment or to perform predetermined checks and actions (such as breakpoint conditions). In OO languages developers should be able to halt and inspect the running program both at specific locations in the source code and on specific semantical events that involve objects. In literature these events are referred to as dynamic reification categories [RC00]. These categories are a set of operations that can be thought of as events which are required for object execution [McA95][RRGN10].
Taking into account these semantic events, instrumentation categories for debugging should at least include:
Statement Execution The ability to halt at a specific statement or line in the source code. Method Execution The ability to halt at a specific method in the source code upon entry.
This is an event that can be triggered by multiple objects that share the same method (either through inheritance or through delegation).
Object Creation The ability to halt at object creation of specific classes or prototypes.
Field Read The ability to halt when a specific field of any instance of a class or prototype is read.
Field Write The ability to halt when a specific field of any instance of a class or prototype is written.
Object Read The ability to halt at any read attempt on a specific object. Object Write The ability to halt at any write attempt on a specific object.
Object Send The ability to halt at any message send from a specific object. This is an event that is triggered when any method is invoked from withing the scope of a specific object. Object Receive The ability to halt at any message send to a specific object.
Object as Argument The ability to halt whenever a specific object is passed as an argument. Object Stored The ability to halt whenever a new reference to a specific object is stored. Object Interaction The ability to halt whenever two specific objects interact in any way.
This is a composite category as defined in [RRGN10]. It can be seen as a composition of object receive, send and argument categories.
3.3 Adaptable Distribution
As seen in Figure 2 remote debugging requires a communication middleware. Designing a communication solution for debugging to cover a wide range of applications that operate under very different execution environments can be challenging since debugging targets are becoming more and more diverse (ranging from small mobile devices to large server deployments on the cloud). Adaptable middleware solutions are well-studied in literature [KCBC02] and offer the ability of flexible configuration during runtime [RKC01] from which remote debugging frameworks can benefit. For example targets with different resources (memory, processing power, bandwidth) may require different serialization policies. While others such as server applications may require different security policies when they are being debugged through an open network.
We distinguish the following four categories of distribution support for debugging solutions, in ascending order of adaptability:
No-Distribution (-) The debugging solution does not support remote debugging.
Fixed-Middleware (+) The debugging solution supports remote debugging via a dedicated and fixed protocol which cannot be easily extended.
Extensible Middleware (++) The debugging solution supports remote debugging via a gen-eral solution for distributed computing (such as an object request broker) which can be extended, such as CORBA or DCOM.
Adaptable Middleware (+++) The debugging solution supports remote debugging via a general solution for distributed computing which can be extended and adapted at runtime [DL02].
4
Evaluation of Existing Solutions
We now study existing debugging solutions of major OO languages in current use today (Java and other OO JVM-based languages (JPDA) [Ora13b, Ora13a], C# (.NET Debugger) [Mic12b], C++ and Objective-C (through Gdb) [RS03]) and Javascript [Mic12a] as well as dynamic languages with live programming support (such as Smalltalk and its debugging model
[LP90]) taking also into account bleeding-edge technological achievements [Zer12, WHV+12,
PTP07] and very recent research results [WWS10, BNVC+11, RBN12].
4.1 Existing Solutions
JPDA/JVM Java’s debugging framework stack is JPDA [Ora13b] and it consists of a mirror
interface (JDI) [Ora13a, BU04], a communications protocol (JDWP) and the debugging support on the target as part of the virtual-machine’s infrastructure (JVM TI). The application on the target machine must be specifically run with debugging support from the VM (the JVM TI) for any interaction between the client and the target to take place. JPDA does not provide facilities to dynamically update the target other then the hot-swapping of pre-existing methods. The communication stress is handled by the low-level debugging communication protocol (JDWP), whose specification is statically defined.
The debugging support for other JVM-based languages such as Scala [MO06] [Dra14], JRuby [Gra14] and Groovy [Eis14] rely on the debugging interfaces provided by JDI and provide all or a subset of the aforementioned facilities [Bru12].
JRebel and DCE The DCE VM [WWS10] and Jrebel [Zer12] are both modifications for
the Java virtual machine that support redefinition of loaded classes at runtime. Although these modifications of the underlying VM are not a solution for debugging themselves, they do provide incremental updating facilities for remote targets. These modifications if used in conjunction with the JPDA framework can support the property of run-time evolution that we described in Section 3.
Maxine The Maxine Inspector offers debugging and dissasembling facilities for the
ex-perimental java virtual-machine Maxine [WHV+12]. Maxine is specialized for vm-level
debugging (i.e., for system programming) by virtue of targeting a meta-circular vm (i.e., a vm written mostly in java itself). It provides a dual low-level / high-level view while debugging. This enables Maxine to support field watchpoints on objects regardless of whether the object has been moved or not by the gc and halt on semantical events related to garbage-collection. Maxine has experimental support for the JDWP communication protocol of JPDA but in con-trast with JPDA suffers from performance issues [OL14] which are nevertheless a well-studied reality of meta-circular virtual-machines in general [USA05].
TOD TOD [PTP07] is an omniscient (i.e., back-in-time) debugger targeting the Java
lan-guage. TOD is usually used with an uninterrupted execution (without any breakpoints) in order to trace execution events. Although omniscient debugging is out of the scope of our work, TOD in particular relates to our discussion by providing an event-driven architecture for organizing and storing execution traces. This architecture utilizes object-oriented instrumentation events as the ones we describe in Section 3.2 including field write and message interception. TOD supports instrumentation through JVMTI and ASM [BLC02].
.NET As with Java, the main remote debugging solution for .NET provided through visual
model of the running application is again static, with the developer being responsible for providing the right sources and configuration files. In the case of .NET though the debugger can attach to a running remote process without loosing the context, provided that the static model for the application is available. Although the model in the developer’s end is static, a limited form of updating is provided in the form of edit-and-continue [Mic12c] of pre-existing methods. There is currently no support for incremental updating of the target application with new packages, classes or methods although there are plans to add related features in the next major release of Visual Studio2.
GDB For Obj-C remote debugging is provided through the gnu-debugger [RS03]. Gdb uses
a dedicated process on the target machine called the gdb-server to attach to running processes. For full debugging support though the deployed application has either to be specifically compiled and deployed with debugging meta-information embedded on the executable or the static model for the running application has to be provided from a separate file. Gdb supports a limited form of updating through an edit-and-continue process of pre-existing methods by patching the executable on memory [RS03].
Smalltalk The most prominent example of an interactive debugger is the Smalltalk debugger
[BDN+09, LP90, Gol84]. In Smalltalk the execution context after a failure is never lost since
through reflection the debugger can readily be spawned as a separate process and access the environments’ reifications for: processes, exceptions, contexts etc. Moreover it supports incremental updating in such a way that introducing new behavior through the debugger is
not only possible but is actually advised [BDN+09]. Indeed incremental updating through
debugging encourages and supports agile development processes, and more specifically Test Driven Development (TDD) [ABF05]. In addition both the debugging and the reflecting facilities of Smalltalk are extensible. On the one hand the debugger model is written itself in Smalltalk. On the other hand the Smalltalk MOP is readily editable from within the system itself. Illustrative examples of MOP extensions in Smalltalk are given from Rivard in [Riv96]. In terms of distribution, middleware proposals like Dist. Smalltalk [Ben88] and OpenCorba [Led99] can be in principle used to allow simple exception forwarding.
Bifrost In Smalltalk supporting advanced debugging techniques through instrumentation is
illustrated in the Bifrost reflection framework [RRGN10] and through object-centric debugging [RBN12]. Bifrost is an extension to the Smalltalk MOP that relies on explicit meta-objects to provide sub-method [DDLM07] and partial behavioral reflection [TNCC03]. Bifrost is implemented through dynamic re-compilation of methods. Method invocations are intercepted using reflective methods [Mar06] similarly to the wrappers abstraction introduced by Brant et al. [BFJR98]. These are subsequently recompiled using AST meta-objects that control the generated bytecode. With Bifrost intercession techniques such as the explicit interception of variable access, is made available at the instance level.
JS/Rivet In–browser debugging of client-side web-applications is out of scope of our current
work. Nevertheless we surveyed the debugging tools of the following web-browsers: IE [Mic14], Mozilla [Moz14] and Chrome [Goo14] in terms of the features discussed in Section 3. These solutions apart from classic debugging facilities for execution control and breakpoints,
offer event-driven debugging facilities for the DOM (Document Object Model [WAC+98])
and some limited form of live-editing for slots and pre-existing methods.
Our own work is more related to the debugging facilities of standalone javascript appli-cations (like those of Node.js [Joy14]) which have nevertheless very rudimentary support
for execution control and breakpoints. The experimental solution of Rivet from Microsoft [Mic12a] comes closer than other solutions for JS to what we have described in Section 3. It supports run-time evolution through live-patching and has an easily extensible communication architecture build on top of HTTP.
AmbientTalk AmbientTalk is an ambient-oriented programming language dedicated to
mobile ad-hoc networks. AmbientTalk’s reflective model supports mirages [MCTT07] which are an extension to the mirror model adding implicit reflection capabilities. Through implicit reflection AmbientTalk extends the contemporary API of mirrors with the following three methods: a doesNotUnderstand(selector) protocol for message sends and two implicit hooks
for object marshalling (pass() and resolve()) [MVCT+09]. These hooks can be used during
a debugging session to support some of the object-oriented execution events we describe in Section 3, such as instantiation events, slot editing and interception [Cut14]. REME-D (the debugging framework of AmbientTalk) supports classical features of remote debuggers, such as step-by-step execution, state introspection and breakpoints and builds upon the reflective capabilities of AmbientTalk to support asynchronous message breakpoints and epidemic
debugging [BNVC+11]. These features although domain specific to mobile ad-hoc networks
are nevertheless supported by a communication paradigm (AmOP) that is very robust and adaptable.
4.2 Comparison
In this Section we compare existing solutions in terms of run-time evolution,semantic instru-mentation and adaptable distribution. Table 3 of Appendix A presents our findings in details (per sub-properties) while Table 1 (also part of Section 5) gives a summary per-solution. 4.2.1 Run-Time Evolution
As seen in Table 3 debugging environments of mainstream OO languages (JPDA, .Net Debug-ger, Gdb) do not support run-time evolution with the exception of a save-and-continue facility for pre-existing methods. In the case of Gdb method hotswapping can lead to inconsistencies [Zel05] since it is supported through memory patching, which is a blind process that replaces execution instructions in memory, without knowledge of the underlying semantics of the language. In the Java world recent developments (through Jrebel and DCE) provide full support for this property as do more dynamic environments such as Smalltalk, Bifrost and Rivet.
4.2.2 Semantic Instrumentation
In Table 3 we also do a comparison in terms of semantic instrumentation and its sub-properties as they were defined in Section 3. We have also included a last category marked as
condi-tion/actionthat describes whether in all instrumentation events the debugging solution can
support both user-generated checks and code in order to provide a more fine-grain control. As an example we can consider a conditional breakpoint that is able to execute user specified actions when triggered.
As we can see from our comparison, Bifrost is the front-runner of instrumentation with all mainstream solutions supporting only plain breakpoints and watchpoints while other – more experimental solutions – having a partial coverage. Bifrost though lacks an Object Stored event which is useful for following an object’s reference propagation and counting. Finally only Bifrost and Gdb provide support for both conditions and actions on instrumentation events.
4.2.3 Adaptable Distribution
Finally Table 3 presents our comparison in terms of distribution. Solutions are marked with -for not supporting distribution, + -for supporting distribution through a fixed-middleware, ++ for an extensible middleware and +++ for an adaptable middleware.
As we can see no general purpose solution supports an adaptable middleware, besides AmbientTalk which is an environment tailored to mobile ad-hoc networks. Nevertheless even in mainstream solutions we notice a trend towards more and more dynamicity. The .NET debugging framework for example follows in the comparison using a general purpose and extensible communication solution (DCOM) [Mic13] together with Rivet’s HTTP-based protocol. We should note here that in the case of Smalltalk (which does not have a dedicated solution for remote debugging), there were some efforts in the past to support remote develop-ment (including simple exception forwarding for debugging) in Cincom Smalltalk based on [Ben88], which were discontinued.
4.2.4 Comparison Overview
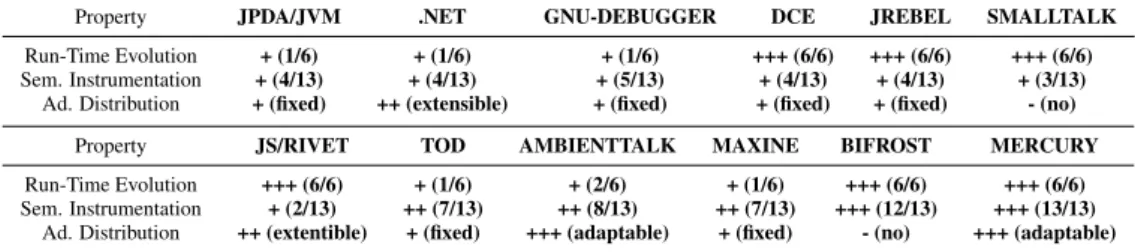
In Table 1 we present an overview of our comparison in terms of all properties that were described in Section 3:
Property JPDA/JVM .NET GNU-DEBUGGER DCE JREBEL SMALLTALK Run-Time Evolution + (1/6) + (1/6) + (1/6) +++ (6/6) +++ (6/6) +++ (6/6) Sem. Instrumentation + (4/13) + (4/13) + (5/13) + (4/13) + (4/13) + (3/13)
Ad. Distribution + (fixed) ++ (extensible) + (fixed) + (fixed) + (fixed) - (no) Property JS/RIVET TOD AMBIENTTALK MAXINE BIFROST MERCURY Run-Time Evolution +++ (6/6) + (1/6) + (2/6) + (1/6) +++ (6/6) +++ (6/6) Sem. Instrumentation + (2/13) ++ (7/13) ++ (8/13) ++ (7/13) +++ (12/13) +++ (13/13)
Ad. Distribution ++ (extentible) + (fixed) +++ (adaptable) + (fixed) - (no) +++ (adaptable)
Table 1– Comparison Overview for Existing Solutions and Mercury (Section 5)
As we can see from Table 1 debugging solutions based on reflection (such as Smalltalk and Bifrost in the local scenario) offer the most complete solutions in terms of run-time evolution and semantic instrumentation, but lack support for adaptable distribution (as in the case of AmbientTalk). On the other hand solutions of mainstream OO languages (JPDA, .Net Debugger, Gdb) and their extensions (Jrebel, DCE) lack support for either run-time evolution or instrumentation (or in some cases both). Other solutions (Rivet, TOD, AmbientTalk, Maxine) have partial support for some but not all of our properties. There is no solution that meets all our criteria in a satisfactory way.
5
Our Solution: Mercury
Our solution proposes a model of the debugged application (cf. Figure 3 (1)) that is dynamic and acts as a meta-level for target applications. It relies on specific meta-objects known as
Mirrorsdefined by Bracha and Unghar as “intermediary objects [...] that directly correspond
to language structures and make reflective code independent of a particular implementa-tion” [BU04]. Mirrors are located on the developer’s side. They are causally connected to the debugged application and support run-time evolution. The run-time debugging support on the target (cf. Figure 3 (2)) reifies the underlying execution environment to support semantic instrumentation. Finally our middleware follows a modular architecture to be adaptable even during runtime (cf. Figure 3 part (3)).
DEBUGGED APPLICATION
DEVELOPER'S END TARGET
RUN-TIME DEBUGGING SUPPORT
MIDDLEWARE DEBUGGER / IDE
MODEL OF THE DEBUGGED APP
MIDDLEWARE
1
2
3
Causally connected mirror-based live meta-level Reification of the underlying execution environment Factory based modular architectureFigure 3– Overview of our Solution
The rest of this section describes our solution based on this live meta-level and how it supports the three properties which were identified in Section 3.
5.1 The Core Meta-Level
The meta-level located on the development machine (left part of Figure 4) is a set of mirrors that reflect on objects (e.g., instance of the classPoint) on the target side (right part of Figure 4). The target machine also includes support for reflection and debugging. This is the role of the
packageRTSupportthat includes theRunTimeDebuggingSupportclass (our remote facade).
Target Side Object Point aPoint instance of RTSupport RunTimeDebuggingSupport + objectinstVarAt(forObject: Object, anIvName: String): Object + ... ... Mirror - targetObject: Object ObjectMirror - rtMirror: RunTimeMirror + instVarAt(anIvName: String): ObjectMirror + ... mirrorO nAPoint RunTimeMirror - runTime: RTDebuggingSupport + objectinstVarAt(forObject: Object, anIvName: String): ObjectMirror + ... ... aRunTime Mirror runTimeDebuggingSupp ort 1 * 1 1 reflects on instance of Development Side M I D D L E W A R E
Figure 4– Our core model
On the left side of Figure 4, we depict the 3 core classes of our meta-level. The root is theMirrorclass, that declares thetargetObjectfield. So, every mirror holds a remote reference to one object on the target. Nevertheless, an object on the target can be reflected by multiple mirrors on the development side.
Both on the developer’s end and on the target, a unique object is responsible to handle
all communications to the other side. This object is an instance ofRunTimeMirror on the
developer’s end and an instance ofRunTimeDebuggingSupporton the target. On the developer’s
theRunTimeMirroris completely equivalent to the one ofRunTimeDebuggingSupportwith one crucial difference: each call to the target side results in a mirror or a collection of mirrors
being returned to the developer’s sideensuring the encapsulation of the remote debugging
facilities. This cascading encapsulation between calls to a mirror object is equivalent to the transitive wrapping mechanism described by C. Teruel et al. [TCD13] for proxies, only in this case an entire remote environment is being wrapped rather than a local object-graph.
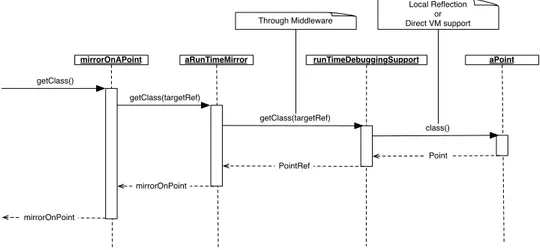
To show how communication and reflection is handled between the development machine
and the target, consider the example of the mirrormirrorOnAPointand its target objectaPoint
on Figure 5. Suppose that the developer wants to get the class ofaPoint. To perform this
operation, the IDE sends thegetClassmessage tomirrorOnAPoint. As a result,mirrorOnAPoint
sends thegetClass(targetRef)message toaRunTimeMirrorpassing as a parameter the remote
ref-erence that it holds. Then,aRunTimeMirrorinvokes through the middleware the corresponding
getClass(targetRef)method onrunTimeDebuggingSuppportlocated on the target. The runTimeDe-buggingSuppportretrieves the classPointand answers it back through the middleware. The class on the target is retrieved either via local reflection or through direct vm-support provided
by the RunTimeDebuggingSupport class of Figure 4. On the developer side,aRunTimeMirror
receives a remote reference on thePointclass, and creates a new mirror on the remote class. It is this mirror on thePointclass that is returned back tomirrorOnAPoint.
mirrorOnAPoint aRunTimeMirror runTimeDebuggingSupport aPoint
getClass() getClass(targetRef) getClass(targetRef) class() Local Reflection or Direct VM support Through Middleware Point PointRef mirrorOnPoint mirrorOnPoint
Figure 5– Sequence Diagram detailing Remote Reflection with Mercury
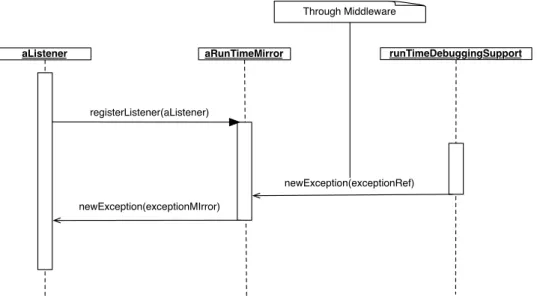
Communication can also be initiated by the target as shown in Figure 6 to trigger updates of the remote meta-level on the developer’s side. For example when a new exception is
thrown on the target (right side of Figure 6) the asynchronousnewException(exceptionRef)
message is send carrying a remote reference to this newly raised exception. As before aRunTimeMirrorwill receive the remote reference and will create a new exception mirror. It is this exception mirror that will be forwarded to interested listeners who have registered through theregisterListener(aListener)message of the run-time mirror. Typically a listener will be an instance of the EnviromentMirror class (see Figure 7) through which interrupted processes and unhandled exceptions are accessed.
5.2 Run-Time Evolution
To support run-time evolution, the model of the debugged application on the developer’s end and the state of the debugged application on the target (cf. Figure 2) needs to be causally connected. This means that an arbitrary change in either one of them should update the other.
aRunTimeMirror runTimeDebuggingSupport registerListener(aListener) newException(exceptionRef) newException(exceptionMIrror) aListener Through Middleware
Figure 6– Asynchronous communication initiated by the target
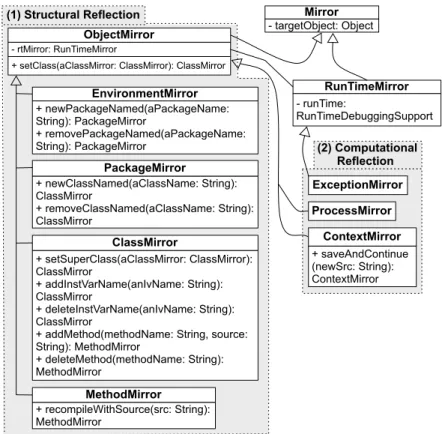
We describe how our model supports this property through the class hierarchy and the
API of our meta-level (starting fromObjectMirror). Figure 7 depicts 8 core classes of our
meta-level which are divided into two groups: the ones that reify the structure of the debugged application (structural reflection) and the ones that reify the computation (computational reflection) [Fer89, Mae87].
In our model, both structural reflection and computational reflection are causally connected to the other side. For structural reflection, this means that the addition of a new package, a new class or method through mirrors, etc. in the development side results in a structural update of the running application on the other side. These 8 core classes depicted in Figure 7 define an API that supports run-time evolution. Instances of these classes reflect on remote objects on the target and all of their methods can be executed while the application is running.
ObjectMirror. AnObjectMirrorenables retrieving information from the object reflected such
as its class, reading/setting its fields or sending new messages to it but also changing its class (setClass).
EnvironmentMirror. It is the entry point mirror to the target application depicting the remote environment as a whole. Through the environment mirror globals are read/written, loaded packages are retrieved, interrupted processes and unhandled exceptions are accessed, code is evaluated (evaluate) and packages can be created, removed, or edited (newPackage,removePackage, etc.).
PackageMirror. A package mirror reflects on loaded packages on the target application. This mirror gives access to package’s meta-information such as its name and the classes it
contains. Classes can also be added or removed using the methodsnewClassNamedand
removeClassNamed.
ClassMirror. Through a class mirror the name, superclass, fields, methods and enclosing package of the reflected class can be retrieved. The superclass can be changed, new
instance variables and methods can be added/removed or edited (setSuperClass,
(2) Computational Reflection ExceptionMirror ProcessMirror ContextMirror + saveAndContinue (newSrc: String): ContextMirror
(1) Structural Reflection Mirror
- targetObject: Object RunTimeMirror - runTime: RunTimeDebuggingSupport ObjectMirror - rtMirror: RunTimeMirror
+ setClass(aClassMirror: ClassMirror): ClassMirror
...
EnvironmentMirror + newPackageNamed(aPackageName: String): PackageMirror + removePackageNamed(aPackageName: String): PackageMirror ClassMirror + setSuperClass(aClassMirror: ClassMirror): ClassMirror + addInstVarName(anIvName: String): ClassMirror + deleteInstVarName(anIvName: String): ClassMirror+ addMethod(methodName: String, source: String): MethodMirror + deleteMethod(methodName: String): MethodMirror PackageMirror + newClassNamed(aClassName: String): ClassMirror + removeClassNamed(aClassName: String): ClassMirror MethodMirror + recompileWithSource(src: String): MethodMirror
Figure 7– Core classes and API for supporting Run-Time Evolution
MethodMirror. Apart from retrieving the name, source or class membership of a Method,
the developer can edit a method in place (recompileWithSource).
ProcessMirror. It allows one to retrieve meta-information on a process such as its stack and manipulate the execution flow.
ExceptionMirror. It is the reification of exceptions on the target. Through an exception mirror the description of an unhandled exception can be retrieved, as well as the process that it occurred and the offending execution context.
ContextMirror. It is the reification of a stack frame (context) on the target application. Through a contextMirror its process, method, receiver and sender can be retrieved, temporaries and arguments of the invocation can be read/written, its execution can be restarted but also the method that was invoked and created the context can be edited
before continuing the execution (saveAndContinue).
5.3 Semantic Instrumentation
Semantic Instrumentation in our model is supported through intercession. Specifically the underlying execution environment is reified inside the run-time environment of the target as to be able to control the semantics of a running process.
The observer [ABW98] An observer defines a dependency between an object and its depen-dents, so that the dependents are notified for state changes on that object.
The implicit meta-object [Mae87] Implicit meta-objects are meta-objects that are invoked automatically by the underlying execution mechanism.
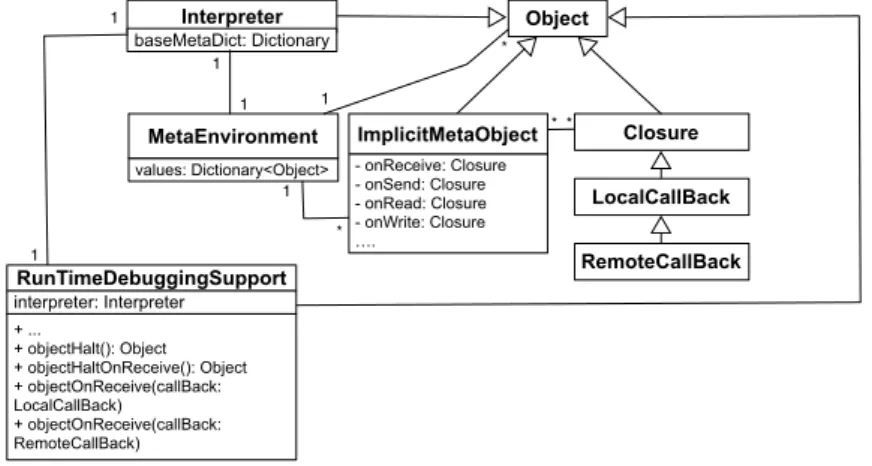
Objects can be instrumented either to perform user-generated conditions and actions upon invocation of specific events (e.g., RunTimeDebuggingSupport»objectOnReceive) or to halt the process on those specific events (e.g., RunTimeDebuggingSupport»objectHaltOnReceive). Figure 8 depicts the reification of the Interpreter (the underlying execution environment) which acts as our observer, connecting instances of Object (regular objects) to instances of ImplicitMetaObject (dependents). Whenever an event of interest is being applied to an object (such as a message send) the underlying execution mechanism invokes the Interpreter reification, which in turn notifies the ImplicitMetaObjects. The Interpreter resolves the relationship between objects and meta-objects through the MetaEnvironment, which acts as an environment dictionary for the meta-level. The MetaEnvironment provides a one-to-one mapping between objects and meta-objects.
Implicit meta-objects when notified, will invoke a callback (class Closure in Figure 8) which can be either a local callback or a remote callback from the developer’s end. The RunTimeDebuggingSupport maintains a reference to the Interpreter reification to register these callbacks coming from mirrors on the developer’s side. Thus our implicit meta-objects extend our mirror model in order to add implicit reflection capabilities as in Mostinckx et al. [MCTT07] (see also AmbientTalk on Section 4). In our case though these meta-objects implement all additional implicit events for remote debugging described in Section 3 which are made possible by our reification of the underlying execution environment.
Object Closure LocalCallBack RemoteCallBack ImplicitMetaObject - onReceive: Closure - onSend: Closure - onRead: Closure - onWrite: Closure …. Interpreter baseMetaDict: Dictionary RunTimeDebuggingSupport + ... + objectHalt(): Object + objectHaltOnReceive(): Object + objectOnReceive(callBack: LocalCallBack) + objectOnReceive(callBack: RemoteCallBack) interpreter: Interpreter values: Dictionary<Object> MetaEnvironment 1 1 1 1 * * * 1 * 1
Figure 8– Core classes for Instrumentation support in the Target
5.4 Adaptable Distribution
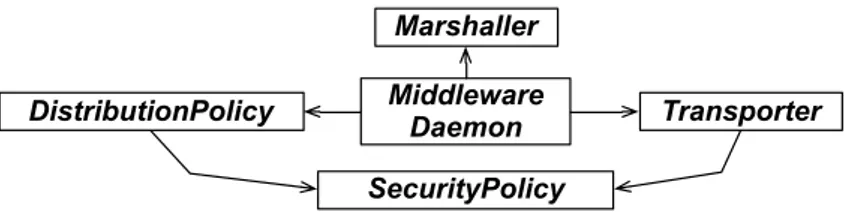
To support distribution via an adaptable middleware, we modeled our solution using the concept of the abstract Factory [ABW98], through which families of related objects can be assembled and parametrized at runtime. Our model for adaptable distribution is part of our proposed model for remote debugging. It is specifically tailored for this context and should not be considered a contribution on its own.
Middleware Daemon Marshaller
DistributionPolicy Transporter
SecurityPolicy
Figure 9– Core classes of our adaptable middleware
Middleware Daemon This abstract class defines methods for the orchestration (assembling) and initialization of our middleware, acting as an Abstract Factory. It is also responsible for loading the RTSupport package (cf Figure 4) on the target upon the successful authentication of a client.
Transporter The concrete subclasses of this abstract class handle the actual communication between peers. Different transporters can support different communication protocols (e.g., tcp, udp or web-sockets)
Marshaller The marshaller (through its concrete subclasses) is responsible for serializing and materializing information, passed through the connection. Different marshallers can support different transcoding algorithms to fit the needs of the debugging context (e.g., serializing to xml, json or binary-form).
Distribution Policy This class (through its concrete subclasses) decides how specific ob-jects or group of obob-jects will be distributed among peers. Options can include: full serialization, shallow serialization, proxying, etc..
Security Policy The concrete subclasses of this abstract class are responsible for authenti-cation and for restricting access (either message sending or distribution) for specific instances or whole classes of objects.
5.5 Comparison with Existing Solutions
In this Section we compare the state-of-the-art debugging solutions (which we discussed in Section 4.2.4) with our work in terms of run-time evolution, semantic instrumentation and adaptable distribution.
As we can see from Tables 1 and 3 (Appendix A) our solution manages to cover all three properties that were identified in Section 3 being comparable only to the Bifrost framework (in the local scenario) in terms of run-time evolution and semantic instrumentation. In our case though these properties are brought to remote debugging through an adaptable middleware. In terms of distribution Mercury is only comparable to AmbientTalk and to a lesser extend to Rivet and the .NET debugging framework which both use an extensible (but not adaptable) communication middleware (DCOM) [Mic13].
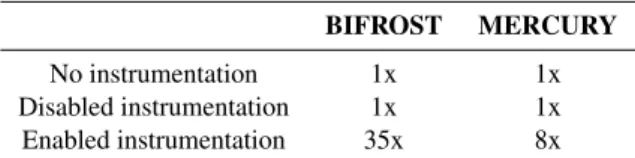
Finally since both our solution and Bifrost are based on Smalltalk, we were also able to perform a micro-benchmark to compare the two, in terms of the overhead introduced by instrumentation. The benchmark is based on Tanter [TNCC03] and the Bifrost metrics are those reported in [Res12]. The benchmark measures the slowdown introduced by each solution for one million messages send to a test object when a) no instrumentation is present b) instrumentation is loaded but is disabled for this specific object and c) instrumentation is enabled on the test object of the micro-benchmark.
BIFROST MERCURY No instrumentation 1x 1x Disabled instrumentation 1x 1x Enabled instrumentation 35x 8x
Table 2– Instrumentation benchmark for Bifrost and Mercury
As we see in Table 2 for both solutions there is no overhead introduced when a specific object is not being instrumented, regardless of whether the solution is loaded into the environ-ment. This is important for practical reasons so as to avoid slowing down the whole system while debugging. While instrumenting a specific object our solution introduces a significantly smaller overhead than Bifrost. We believe that this is due to the fact that our solution is based on the underlying virtual-machine rather than on byte-code manipulation as in the case of Bifrost.
5.6 Limitations
In contrast with the debugging solutions presented in Section 4 our solution has the following limitiations:
Distributed Applications Mercury is a model for remote debugging and can thus seperately
debug the connected parties of a distributed application, as is usually the case with debugging remote server or client applications. Special debugging facilities for distributed applications
- such as asynchronous breakpoints supported by REME-D [BNVC+11] - were outside the
focus of our work.
VM-Debugging Also our solution concerns itself exclusively with language-side debugging,
in contrast for e.g., with Maxine [WHV+12]. Maxine targets a meta-circular language-vm
system and can thus be used to debug both the Maxine virtual-machine as well as the java program running on top of it.
In-browser Debugging Finally Mercury cannot be used to debug in-browser client-side
applications. We nevertheless surveyed several javascript debugging solution in terms of the properties discussed in Section 3.
6
Mercury’s Implementation
6.1 Implementation Overview
Given our state-of-the-art survey in Section 4 we chose to implement Mercury in a platform
that was as close as possible to our goals. We chose to implement a prototype3of our model
(described in Section 5) in Pharo [BDN+09] and Slang [IKM+97]. Pharo is a reflective,
object-oriented and dynamically typed programming environment that is inspired by Smalltalk. Slang is a subset of the Smalltalk syntax with procedural semantics that can be easily translated to C. In Figure 10 we show the different constituents of our implementation.
Mercury-Core
Mercury-Ui
Seamless
MetaStackVM
(Alexandria)
Figure 10– Core parts of Mercury’s Prototype
MetaStackVM Is a dedicated virtual-machine for debugging targets, that extends the reflec-tive facilities of the standard Stack VM of Pharo [Mir08] in order to support interces-sion [Pap13].
Seamless Is our adaptable middleware that provides flexible communication facilities be-tweens peers during debugging sessions.
Mercury-Core Is the sub-project of Mercury that hosts the debugging meta-level and the debugging run-time support.
Mercury-UI Is a debugging front-end that exemplifies key functionalities of our solution. All four part of our prototype implementation for Mercury are released under the MIT license4.
6.2 Discussion: Implementation trade-offs
6.2.1 Supporting Run-Time Evolution
Implementors of our model have essentially two options for supporting run-time evolution through the RunTimeDebuggingSupport (depicted in the left side of Figure 4):
(a) Local reflection Local reflection on the target can be used to provide the corresponding API for run-time evolution. This solution is applicable to languages that already provide a rich set of local reflective facilities. It is also a portable and extensible solution since the debugging support is written in the same language as the target application. (b) Virtual Machine support Debugging support on the target can be also hard-coded inside
the virtual-machine of the target. This solution fits better with languages that do not support advanced reflective facilities on their own. It is also an attractive option for system debugging, in cases where core language reflection itself has to be debugged. This solution is less portable and extensible if it is not supported by the vendor of the target language.
In our prototype we used a combination of the two approaches mentioned above. Remote reflection on the instance level is separated from local reflection on the target and can thus support some limited form of system debugging. However, we also make use of local reflective facilities on the target for system-organization reflection (packaging meta-objects) and computational reflection (reifications of contexts and processes). Our implementation currently depends on the compiler on the target. Ideally, the developers’ end compiler should be used and the target should not host a compiler itself to further minimize the footprint.
6.2.2 Supporting Instrumentation
To support semantic instrumentation the following options can apply:
(a) Bytecode Manipulation The compiler can be used to re-compile part of the system to transparently introduce crosscuts that perform instrumentation checks (for message sending, field access, etc.). This solution has the disadvantage of instrumenting only static entities (such as classes or methods) and may perform poorly when specific objects (runtime entities) need to be instrumented. For example when instrumenting message sending on a specific object, all the methods of its class and its superclasses have to be re-compiled to introduce the crosscuts. On the other hand in the case of a self-hosted compiler this option favors portability.
(b) Virtual Machine support Instrumentation support on the target can be also hard-coded inside the virtual-machine of the target. This solution fits better with instrumentation of run-time entities, since the checking can be performed on the object itself while it is being interpreted by the underlying execution environment. Portability may be an issue in this case if instrumentation is not supported by the vendor.
In our prototype we supported instrumentation by extending the stack-based virtual ma-chine of Pharo. We chose to provide virtual-mama-chine support since our focus was on instru-menting run-time rather than static entities. Furthermore we did not wish to have further dependencies on the compiler of the target.
6.3 Discussion: Implementing Mercury in Java
We take the Java language as an example to investigate the feasibility of implementing Mercury in other languages. We discuss the technological prerequisites for implementors for each part of our model as was discussed in Section 5.
A causally connected dynamic meta-level for debugging that can support run-time evolu-tion can be build for Java by combining the currently available debugging infrastructure found in JPDA [Ora13b] with the incremental updating facilities of the DCE VM project [WWS10] or those found in the JRebel vm-plugin [Zer12] (see also Section 4). Support for semantic instrumentation can be build on top of solutions for bytecode manipulation or reflective inter-cession for Java like those in Iguana/J [RC00], Reflex [TBN01], ASM [BLC02] or JavaAssist [CN03]. We should note here however that since Java is more static in nature - compared to Pharo - these frameworks should be able to inter-operate with the incremental updating support we discussed previously (DCE, JRebel) to apply the required adaptations at run-time as we do with Mercury. Supporting remote debugging through an adaptable middleware can be achieved in Java by substituting the static low-level debugging communication protocol (JDWP) of JPDA with a more dynamic and flexible middleware solution like Cajo [Cat14]. Another approach would be to reconcile core reflection with remote method invocation bypassing the restrictions imposed by the Java reflection API. This was proposed in the work of Richmond and Noble [RN01] through a set of carefully designed local and remote proxies.
7
Mercury’s Validation
In this Section we first show some basic examples of Mercury in terms of API (sub. 7.1) and then continue by validating Mercury’s properties in an experimental setting (sub. 7.2). Two case studies are considered involving remote debugging of multiple remote devices. The first
case study details how the property of interactiveness can be used to support a remote agile debugging paradigm (sub. 7.3). While the second shows how Mercury brings the idea of object-centric debugging in a distributed setting through remote object instrumentation (sub. 7.4).
7.1 Basic API Examples
7.1.1 Inspecting remote environments and accessing objects
On line 1 of Script 1, the current process on the developer machine uses the mirror factory Reflectionto access an environment on the remote target at addressminesdouai.fr:8080. On
line 2 a package meta-object is accessed named:#Graphics-Primitives, then on line 3 a class
meta-object inside this package named:#Pointis retrieved. On line 4 a new instance of the class #Pointis created on the target and its corresponding meta-object is returned on the developer’s
machine. Finally on line 5 the instance variable namedxof this newly created object is set to
a new value.
Example Script 1: Inspecting a remote environment and editing remote objects 1 anEnvironmentMirror:= Reflection on: RemoteEnvironment @ ’mines-douai.fr:8080’. 2 aPackageMirror := anEnvironmentMirror packageNamed: #’Graphics-Primitives’. 3 aClassMirror := aPackageMirror classNamed: #Point.
4 anObjectMirror := aClassMirror newInstance. 5 anObjectMirror instVarAt: #x put: 100.
7.1.2 Handling remote exceptions
In Script 2, as before the remote environment is accessed through our mirror factory (line
1). Then on line 2 an expression is evaluated on the remote target: ‘3 / 0’. Then we show
that if a remote exception occurs during the evaluation of an expression, a corresponding exception meta-object is returned and can be used by clients of our meta-level. In this case aLocalDebuggingClientclass which makes use of our meta-level, is invoked with our remote exception meta-object.
Example Script 2: Handling a remote exception
1 anEnvironmentMirror := Reflection on: RemoteEnvironment @ ’mines-douai.fr:8080’. 2 anEnvironmentMirror
3 evaluate: ’3 / 0’
4 onRemoteExceptionDo: [:aRemoteExceptionMirror |
5 LocalDebuggingClient debug: aRemoteExceptionMirror]
7.1.3 Changing variables and controlling execution flow
On line 2 of Script 3, we access all interrupted processes (threads) on the remote target. These are all execution threads that have raised unhandled exceptions or have been interrupted for inspection by the developer. Then on line 3 we retrieve the top context on the stack of the first interrupted process. On line 4 we modify a temporary value inside that context. Then finally on line 5 we make the process to proceed with the interrupted execution.
Example Script 3: Controlling execution flow
1 anEnvironmentMirror := Reflection on: RemoteEnvironment @ ’mines-douai.fr:8080’. 2 interruptedProcessesMirrors := anEnvironmentMirror interruptedProcesses.
3 aContextMirror := interruptedProcessMirrors first topContext 4 aTempObjMirror := aContextMirror tempNamed: ’x’ put: ’3’. 5 interruptedProcessesMirrors first proceed.
7.1.4 Incrementally changing the target’s code and state
On Script 4, we show how a developer can introduce new behavior in the targeted application (interactiveness). On line 2 we introduce an empty new package through our environment meta-object. From line 3 to 5, we add a new class in this package with two instance variables
and one method namedhypothesis. We instantiate this new class (line 6) and send a message to
this new instance (line 7) through its meta-object. As before (on Script 3) if our message-send raises an exception, a corresponding exception meta-object will be returned which can be used by clients of our meta-level.
Example Script 4: Incrementally updating the remote target to test a bug
1 anEnvironmentMirror := Reflection on: RemoteEnvironment @ ’mines-douai.fr:8080’. 2 aPackageMirror := aRemoteEnvironment newPackageNamed: #NewPackage.
3 aClassMirror := aPackageMirror newClassNamed: #NewClass. 4 aClassMirror := aClassMirror ivs: { #x . #y}.
5 aClassMirror := aClassMirror addMethod: ’hypothesis: aNumber ...’ 6 anObjectMirror := aClassMirror newInstance.
7 anObjectMirror perform: #hypothesis 8 withArguments: { 3 }
9 onRemoteExceptionDo: [:aRemoteExceptionMirror |
10 LocalDebuggingClient debug: aRemoteExceptionMirror]
7.1.5 Introducing breakpoints on execution events
In Script 5, we show how instrumentation can be used to alter semantics on the target application and provide facilities such as object-centric watchpoints. Especially in this example we show how halting on object creation can be achieved by conditioning the message receive event on a class.
On line 1 a class mirror is retrieved. On line 2 a remote callback is registered for instru-menting message sending on the remote class. This callback accepts one or more arguments that provide meta-information about the event, such as the name of the method being invoked. On line 3 a condition and an action are set within the callback. Specifically when the message
new(responsible for object creation) is sent to the remote class, the class that triggered the
event (i.e reifications trigger) will cause the remote process to halt, effectively producing a watch-point on object creation.
Example Script 5: Instrumentation of object creation 1 aClassMirror := aPackageMirror classNamed: #Point. 2 aClassMirror onReceive: [:reifications |
3 reifications message selector = #new ifTrue: [reifications trigger halt] ]
7.1.6 Distribution
In Script 6, we show how we can adapt the middleware’s serialization policy at runtime while debugging. On line 1 we retrieve a class mirror (on the class #Class) and then on line 2, we ask the class mirror for an object mirror on its instance variable: #localSelectors. The localSelectors instance variable is a Set holding all selectors (method names) defined locally in that class. Since this is a collection of basic instances (i.e symbols), further processing on it (like printing) would be more convenient if instead of a mirror (i.e the ivMirror in this case) we had a local copy. This is achieved on line 3 where we send the message resolveLocally to the ivMirror. This message (at run-time) instructs the middleware to override its serialization policy specifically for this instance and return a local copy of the underlying remote reference.
Example Script 6: Adapting serialization at run-time 1 aClassMirror := aRemoteEnvironment globalAt: #Class. 2 ivMirror := aClassMirror objInstVarNamed: #localSelectors. 3 localSet := ivMirror resolveLocally.
7.2 Experimental Setting
For validating Mercury we have considered three different kinds of devices as debugging targets. These devices (see Figure 11) where chosen as illustrative examples of either:
• Targets that have different hardware or environment settings than development machines. • Targets that are not locally or easily accessible.
• Targets that have no input/output interfaces for local development.
Through this setting, we have verified the applicability of Mercury for different debugging targets. We experimented on how a debugging session can benefit from Mercury’s properties, by studying the following two use-cases:
1. Combining agile development [ABF05] with debugging in a single remote debugging session without the need of re-deployment.
2. Supporting both OO-centric [RBN12] and Stack-based debugging in a remote setting through remote object instrumentation.
Developer-Machine
Mac-Mini - (2.3 GHz / 4GB RAM) Ubuntu 12.04
Device (A) Phone
Galaxy Nexus - (1.2 GHz / 1GB RAM) Android 4.3
Device (B) Tablet
Galaxy Tab - (1.0 GHz / 1GB RAM) Android 4.0 Device (C) Remote Server Running HP Workstation - (2.3 GHz / 4GB RAM) Ubuntu 12.04 over wifi over wifi over ethernet ETH: 10.1.10.206 WIFI: 10.1.160.116 WIFI: 10.1.160.158 ETH: 10.1.10.81 WIFI: 10.1.160.92 Mercury IDE
Figure 11– Experimental Set-up for our Debugging Targets
Figure 11 shows the set-up of our experiment. In the upper part of the figure we depict our debugging targets. Device A is a smart-phone target connected to our development machine through wifi. Device B is a tablet target also connected through a wireless network, while Device C is a remote server to which we connect through ethernet.
In the lower part of the figure we show the development machine running our debugging front-end. A cropped screenshot of the Mercury IDE is shown at the center of the figure. Each tab corresponds to tools supporting remote development and debugging of a single target.
The developer machine connects to our targets through the two communication interfaces designated as ETH and WIFI for ethernet and wireless communication channels respectively. For our two android devices (phone and tablet), we have also tested communication through a
usb channel that establishes ethernet connections using port forwarding.5
7.2.1 The Droid and Cloud File Browsers
Figure 17 shows the Droid-Browser application running on the phone and tablet devices (middle and right part of Figure 17 respectively). The Droid-Browser is a local file browsing application that presents the option to upload local files stored on the device to the cloud (i.e the remote server of our experimental setting).
On the other hand the Cloud-Browser is a normal web-application that presents the option to download files that where previously uploaded on the server.
The two applications share part of their code for file browsing and serving of web-pages as seen in Figure 12. The core logic of both applications resides in two subclasses of a common ancestor class named FileBrowser. FileBrowser is itself a subclass of WAComponent which is part of the Seaside [DLR04] web-framework.
FileBrowser DroidBrowser CloudBrowser WAComponent
...
Seaside Web-Framework FileBrowserTest + suffixOf: aString + testSuffixWithDot + testSuffixWithoutDot + testLongFilePath TestCaseFigure 12– Left: The Droid and Cloud browser apps implemented as Seaside components Right: FileBrowserTest class and methods introduced through run-time evolution
7.3 Case Study I: Remote Agile Debugging
Our starting point is the deployment of our target software in all three devices, and the subsequent launch of the applications.
We then connect through the debugging front-end of Mercury to our remote targets. All our targets upon start-up raised the same error. From the exception name and the remote stack we can deduce that a NotFound error was triggered from inside the #detect: method of class Collection, as seen in Script 8.
Script 8: The method which raised the initial error detect: aBlock
1 "Evaluate aBlock with each of the receiver’s elements as the argument. 2 Answer the first element for which aBlock evaluates to true."
3
4 ^ self detect: aBlock ifNone: [self errorNotFound: aBlock]
After navigating the stack through our context mirrors we come to the first context related with our application, which can be seen in Script 9. The method in Script 9 is an extension
of our application for the system class String, which calculates the suffix of a given filename. Mercury informs us that the offending method call to #detect: originated from our code on line 3.
Script 9: Calculating a filename suffix String>>suffix
1 | dot dotPosition | 2 dot := FileDirectory dot.
3 dotPosition := (self size to: 1 by: -1) detect: [ :i | (self at: i) = dot ]. 4 ^ self copyFrom: dotPosition + 1 to: self size
In turn the method suffix was called while the Droid Browser was trying to render a corresponding icon for a file system entry according to its suffix, as seen in Script 10. The method #renderPathOn: in Script 10 belongs to the class FileBrowser (superclass of both Droid and CloudBrowser as seen in Figure 12) which seems to be the reason why all of our targets failed to render their ui. To validate this hypothesis we check the stack on all 3 targets and browse the offending file system entries for each case:
Phone: ’/charger’ Tablet: ’/default.prop’
Server: ’/var/www/User/.profile-xmind-portable-201212250029’
Script 10: Icon rendering code calling the suffix method FileBrowser>>renderPathOn: html
[...]
html image url: (FileIcons urlOf: (each asString suffix , ’Png’) asSymbol). [...]
The entries unfortunately tells us three different things: the suffix method fails both when it is invoked on a filename with no extension (as in the case of our smart-phone target) and on file paths that do have an extension (as in the case of our tablet target). Moreover in the case of the server target the failing filename is a longer file-path whose dot signifies something other than an extension (the fact that this is a hidden file on unix systems), which may be a contributing factor.
7.3.1 Remote Agile Debugging through Run-Time Evolution
Up until now we have seen a normal remote debugging session, where we where able to browse remote targets, navigate their stack and control execution. We will now see how we can use Mercury to dynamically introduce new code and tests while debugging without lengthy re-deployments of our applications.
By doing so we aim to achieve the following:
1. Re-produce the initial error multiple times in order to test different hypothesis without the need of re-deployment.
2. Simplify the offending context without re-starting the debugging session. 3. Maintain the state and suspended execution flow of the initial unhandled errors:
(a) In order to cross-examine the initial failing state with new findings.
(b) In case the initial errors are not easily reproducible (as is the case with heisenbugs [Gra86])
Our next step is shown in Figure 12. Since Mercury can dynamically evolve the target’s code (run-time evolution) we can remotely introduce new classes and methods for testing to all of our targets while debugging.
In this case we introduce the test class FileBrowserTest (right part of Figure 12) as a subclass of the class TestCase which is part of the SUnit framework on the target. Getting a class mirror on FileBrowserTest will allows us to incrementally run tests on our remote machines and debug their results, without ever quitting our current debugging session.
The code of our FileBrowserTest class is given on Script 11. Our first method #suffixOf: is a helper method that replicates the behavior of the String»#suffix method of Script 9. Our second method #testSuffixWithDot invokes our helper method on a simple dotted filename and makes an assertion about the return value of this invocation (this case is similar to our initial error on our tablet). Method #testSuffixWithoutDot makes an assertion for the case of a not-dotted filename (similar to our initial error for the smart-phone). Finally testHiddenFilePath tests a long hidden filename with its full path (similar to our initial error on the cloud server). Note here that all three tests will raise a new exception both when our helper method has a defect as well as in the case of a failed assertion.
Script 11: Test methods
FileBrowserTest>>suffixOf: aString
"assumes that I’m a file name, and answers my suffix, the part after the last dot" | dot dotPosition |
dot := FileDirectory dot.
dotPosition := (aString size to: 1 by: -1) detect: [ :i | (aString at: i) = dot ]. ^ aString copyFrom: dotPosition + 1 to: aString size
FileBrowserTest>>testSuffixWithDot self assert:
(self suffixOf: ’filename.ext’) = ’ext’ FileBrowserTest>>testSuffixWithoutDot
self assert:
(self suffixOf: ’filename’) = ’’ FileBrowserTest>>testHiddenFilePath
self assert:
(self suffixOf: ’/var/www/User/.a-looooooooong-hidden-filename’) = ’a-looooooooong-hidden-filename’
We add our test class and methods to all three targets, and run the tests. This way we will be able to determine if there is some device-specific cause for the error on one of the devices (e.g., different representation of file-systems). This process is shown in Figure 13.
On Step 1 we run each test individually, on Step 2 we examine the results on the bottom left panel. If the results informs us of an error we can hit the debug button to examine and manipulate it (Step 3). Finally on Step 4 we can see that we are able to switch and cross-examine state and execution between the initial error and the re-produced errors from the test cases. Note here that it is possible to run and debug a single test multiple times, although in this case we run and debug each test only once.
We repeat this process for all three devices and find that all tests fail on all three of our targets. By doing so we deduce that there is no device-specific cause underlying each case, although each one of the tests may be failing for different reasons.
7.3.2 Debugging Hypotheses and Fixes
At this point having 12 different threads of execution at our disposal spanning 3 different devices, we can start debugging our hypotheses.
Our expectation for the String»suffix method is to return an empty string for filenames without a dot. Since our second test fails with a NotFound error notification we can now device