HAL Id: hal-02909944
https://hal.archives-ouvertes.fr/hal-02909944
Submitted on 31 Jul 2020
HAL is a multi-disciplinary open access
archive for the deposit and dissemination of
sci-entific research documents, whether they are
pub-lished or not. The documents may come from
teaching and research institutions in France or
abroad, or from public or private research centers.
L’archive ouverte pluridisciplinaire HAL, est
destinée au dépôt et à la diffusion de documents
scientifiques de niveau recherche, publiés ou non,
émanant des établissements d’enseignement et de
recherche français ou étrangers, des laboratoires
publics ou privés.
Demo abstract: end-to-end root cause analysis of a
mobile network
Achille Salaün, Anne Bouillard, Marc-Olivier Buob
To cite this version:
Achille Salaün, Anne Bouillard, Marc-Olivier Buob.
Demo abstract:
end-to-end root cause
analysis of a mobile network.
INFOCOM 2020: IEEE International Conference on Computer
Communications, Jul 2020, Virtual conference, Canada. pp.1324-1325,
�10.1109/INFOCOMWK-SHPS50562.2020.9162999�. �hal-02909944�
Demo Abstract: End-to-end Root Cause Analysis
of a Mobile Network
Achille Sala¨un
1,2, Anne Bouillard
1, Marc-Olivier Buob
11Nokia Bell Labs France
achille.salaun@nokia.com, {anne.bouillard, marc-olivier.buob}@nokia-bell-labs.com
2CNRS, Samovar, T´el´ecom SudParis, Institut Polytechnique de Paris
Abstract—In telecommunications, fault management is critical to improve network availability and user experience. To enhance reliability of their networks, operators require tools to quickly understand the cause of an outage. In particular, logs of alarms keep track of failures arising in their infrastructures. Due to the increasing size of networks and to the high diversity of technologies, these files may be verbose and noisy. That is why analyzing a log is often complex, hence delaying recovery and then degrading network availability. This demo presents a tool suite dedicated to log analysis. Our methodology is illustrated through the processing of a real alarm log issued from a 4G network. First, one can simplify the log by discarding irrelevant alarms and by clustering co-occurrent ones. Then, the underlying graph structure, called DIG-DAG, can store causal patterns by processing the input log online. Hence, experts can query the DIG-DAG to retrieve small and interpretable patterns.
Index Terms—fault diagnosis, pattern matching, online algo-rithm
I. INTRODUCTION
The increasing complexity of telecommunication networks makes their management challenging. Indeed, they often in-volve a large number of devices and technologies. Therefore, networks are error-prone, which can degrade the overall qual-ity of service. A quick understanding of the origin of an outage to solve it is a key task for system administrators. To do so, faults are recorded in files called logs. For large networks, these logs are often noisy and verbose. They may be hard to analyze, even for an expert. Several RCA solutions have already been proposed and rely on various techniques. Those based on neural nets [1] face interpretability issues. Moreover, they generally require a tedious management of hyperparameters. Bayesian networks [2] and decision trees [3] are more interpretable but lack scalability. Hence, interpretable RCA tools are still rare. To address this problem, we have proposed the DIG-DAG [4], a graph structure that stores online all the causal patterns observed in an alarm log. The DIG-DAG can be queried as detailed in [5] to extract patterns of alarms matching experts’ interests.
This demo presents several tools dedicated to log analysis and applied on a real alarm log issued by a 4G network. In the process, irrelevant alarms are filtered out. Then, redundant in-formation is clustered and prior knowledge integrated. Causal chains of events can be stored in a dedicated structure that can, finally, be exploited to retrieve small and interpretable causal patterns. The demo is designed to be interactive: the audience
can use the presented tools and propose its own diagnosis after the presentation. Moreover, a poster and slides will also be available to explain the theoretical foundations of our solution.
II. END-TO-END METHODOLOGY
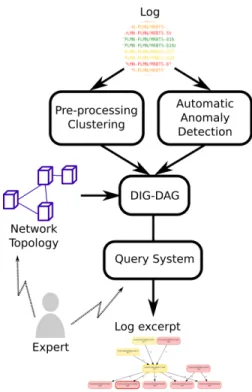
This section presents our methodology to analyze a log, from its parsing to the obtention of human readable displays. A schematic overview is provided by Fig. 1.
Fig. 1. Overview of the end-to-end methodology
Alarm logs are collections of events characterized by an emitting machine, an alarm identifier, a starting date and an ending date. An alarm contains the spatial information that characterizes an event: the emitting machine, the type of the event, its severity, etc. From a log, one can derive a directed interval graph (DIG) where nodes correspond to the events of that log and arcs represent potential causalities between two events in the log. We say that an event potentially causes another one if it occurs before that one, if the first event is still active when the second one starts, and if the two events occur on the same or on two neighboring machines. The
analysis of the log can be significantly eased thanks to simple operations. Indeed, alarm logs often contain irrelevant or redundant information. For example, some alarms are almost always active in the log. These alarms can be removed as they do not provide any insight about the outage. Similarly, some alarms activate and deactivate synchronously, and so they can be aggregated without loss of information. The DIG-DAG is a graph structure designed to store and count online all the causal sequences of alarms observed in the DIG [4]. In particular, it can be built by processing the DIG online. It is possible to run in parallel an online anomaly detection algorithm, such as [6], to detect peaks of alarms and stop the construction of the structure when an anomaly is detected. In real use cases, the DIG-DAG is often too large to be directly displayable and analyzed by an expert. That is why [5] introduces a query system to extract from the DIG-DAG patterns matching expert’s interests. For instance, one may want to only select the sequences of alarms with relevant causalities ending on critical alarms. If the query is accurate enough, the expert can obtain small graphs. Fig. 3 depicts a query result, which is more readable than a noisy and verbose log.
III. TECHNICAL DESCRIPTION& REQUIREMENTS
In this demo, the methodology presented in Sec. II is applied on a real alarm log issued from a 4G network. It contains 20,944 events. The geolocation of the machines (antennas) is also known. Hence, if two antennas are too far from each other, events of one antenna cannot directly cause events of the second. The interactive part of the demo is realized in a Jupyter Notebook. The methodology described in Sec. II is run in real-time. The log and the DIG-DAG are illustrated through dynamic charts. One can specify a query through the interface shown on Fig. 2. It allows to extract causal patterns from the DIG-DAG based on vertex-based, arc-based or weight-based filters. The corresponding patterns are displayed like the one shown in Fig. 3 and their relevance for RCA will be discussed in the presentation. During the demo, the audience will be invited to tune the filtering and clustering functions, and choose the threshold on the distance for two antennas to be able to interact or not.
Fig. 2. Interface for querying a DIG-DAG
In addition, a poster and slides (presented in [4]) provide some theoretical background. Especially, they highlight how to
Fig. 3. Most relevant sequences of alarms starting by a severe (red) alarm and ending by an active (bold) severe alarm (edge weights correspond to a causal relevance quantified by ratios introduced in [4])
graphically model an alarm log, how to cluster similar alarms, and how the DIG-DAG structure grows.
IV. CONCLUSION
This demo showcases a network analysis tool that processes an input log and an optional network topology. The demo shows several pre-processing tricks that simplify the input log. Then, it demonstrates how every pattern of alarm appearing in a log can be stored in a specialized data structure called DIG-DAG. Finally, it presents a query system extracting patterns of alarms matching expert’s interests. For all those reasons, we believe this tool suite can significantly help expert for troubleshooting.
REFERENCES
[1] C. Zhang, D. Song, Y. Chen, X. Feng, C. Lumezanu, W. Cheng, J. Ni, B. Zong, H. Chen, and N. V. Chawla, “A deep neural network for unsupervised anomaly detection and diagnosis in multivariate time series data,” in Proceedings of the AAAI Conference on Artificial Intelligence, vol. 33, 2019, pp. 1409–1416.
[2] A. Alaeddini and I. Dogan, “Using Bayesian networks for root cause analysis in statistical process control,” Expert Systems with Applications, vol. 38, no. 9, pp. 11 230–11 243, 2011.
[3] M. Chen, A. X. Zheng, J. Lloyd, M. I. Jordan, and E. Brinewer, “Failure diagnosis using decision trees,” in International Conference on Autonomic Computing, 2004. Proceedings. IEEE, 2004, pp. 36–43.
[4] A. Bouillard, M.-O. Buob, M. Raynal, and A. Sala¨un, “Log analysis via space-time pattern matching,” in 2018 14th International Conference on Network and Service Management (CNSM). IEEE, 2018, pp. 303–307. [5] A. Sala¨un, A. Bouillard, and M.-O. Buob, “Space-time pattern extraction in alarm logs for network diagnosis,” 2nd IFIP International Conference on Machine Learning for Networking, 2019.
[6] A. Bouillard, A. Junier, and B. Ronot, “Hidden anomaly detection in telecommunication networks,” in 2012 8th international conference on network and service management (CNSM). IEEE, 2012, pp. 82–90.