HAL Id: hal-01577256
https://hal.archives-ouvertes.fr/hal-01577256
Submitted on 25 Aug 2017
HAL is a multi-disciplinary open access archive for the deposit and dissemination of sci-entific research documents, whether they are pub-lished or not. The documents may come from teaching and research institutions in France or abroad, or from public or private research centers.
L’archive ouverte pluridisciplinaire HAL, est destinée au dépôt et à la diffusion de documents scientifiques de niveau recherche, publiés ou non, émanant des établissements d’enseignement et de recherche français ou étrangers, des laboratoires publics ou privés.
strategy of inland waterways in uncertain context
Guillaume Desquesnes, Guillaume Lozenguez, Arnaud Doniec, Eric Duviella
To cite this version:
Guillaume Desquesnes, Guillaume Lozenguez, Arnaud Doniec, Eric Duviella. Large Markov Decision Processes based management strategy of inland waterways in uncertain context. Simhydro 2017, Jun 2017, Sophia-Antipolis, France. �hal-01577256�
LARGE MARKOV DECISION PROCESSES BASED MANAGEMENT
STRATEGY OF INLAND WATERWAYS IN UNCERTAIN CONTEXT
Guillaume Desquesnes1, Guillaume Lozenguez, Arnaud Doniec, Éric Duviella IMT Lille Douai, URIA, F-59000 Lille, France
{guillaume.desquesnes, guillaume.lozenguez, arnaud.doniec, eric.duviella}@mines-douai.fr
KEY WORDS
Inland waterways, Water management, Uncertainties, Markov Decision Processes, Global change
ABSTRACT
Inland waterways management is likely to go through heavy changes due to an expected traffic increase in a context of climate change. Those changes are going to requires adaptive and resilient management of the water resource. A representative model of the inland waterway has been proposed, using Markov decision processes to model the dynamic and uncertainties of the waterway. It is used to obtain an optimal plan for the distribution of the water on the network that takes into account the uncertainties arising for the operation of such networks. A subnetwork of the Hauts-de-France is modeled using this approach based on real data of traffic and water levels. The produced plans are tested on different scenarios under expected and unexpected conditions of traffic and climate to observe the quality and resilience of the generated plan during its execution. Simulations will show the advantages and limitations of such a modeling of the inland waterway network.
1. INTRODUCTION
It is now well recognized that human activities have a big impact on climate change. It is mainly due to the emission of greenhouse gas (GHG). The last report of IPCC [1] indicate that anthropogenic GHG emissions “came by 11% from transport” from 2000 to 2010. They recommend technical and behavioral mitigation measures in the transport sector. One solution should be a shift of the truck traffic to the inland waterway network that would provide both economic and environment benefits [2] [3]. These mitigation measures are also advocated by the last historical agreement of the COP21 in Paris. This one aims at limiting the temperature increase to 1.5°C from 2100. By focalizing on inland navigation, it is thus expected an increase of traffic [4], with an estimated growth of 35% [5], and an increase of the frequency and intensity of flood and drought periods in close future. Management of inland waterways must deal with this new challenge.
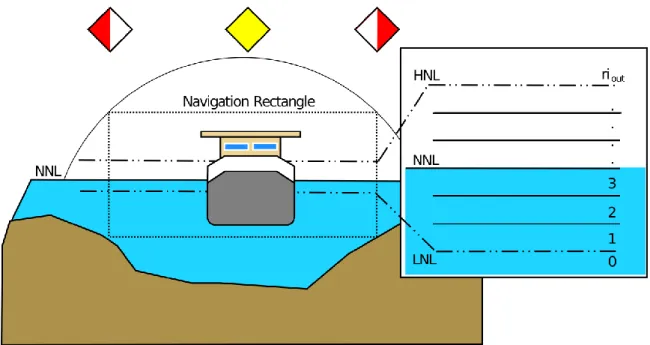
An inland waterway network (IWN) is a large scale system build by humans, to responds to their needs, which can be divided in reaches connected by locks. To allow navigation, the level of a reach has to be in a certain range called the navigation rectangle. The role of IWN managers consists in minimizing the time where reaches are outside of their navigation rectangle, by optimizing the water resource allocation amongst reaches using locks, gates or pumps. It allows avoid important economic and ecological costs.
To overcome this issue, efficient adaptive water resource management strategies have been designed in [6] dealing with the expected constraints. These management strategies allow determining the resilience of IWN and optimizing water resource allocation. However, the used approaches are based on deterministic model of IWN and are limited when uncertainties have to be considered. For instance, the exact number of boats crossing the locks every day is not always known, uncontrolled withdrawals and water intakes are located along the reaches, exchanges with groundwater can occur and obviously weather phenomena will influence the water levels. Hence, it is necessary to introduce a stochastic modeling of the inland water networks. The IWN are modeled as large Markov Decision Processes (MDP), as introduced in [7], taking into account uncertainties. This model is tested on realistic and real data of the IWN of the north of France.
1
This article is organized as follows: first we introduce more formally the inland waterway networks and its operation. Then in a second part, we will quickly introduce Markov Decision Processes and the modeling of IWN using such formalism. Finally, the results and resilience from modeling on realistic and real data will be presented.
2. INLAND WATERWAY NETWORK MANAGEMENT
An inland waterway network (see Figure 1) is a large scale system, mostly used for navigation. It can provide safe and efficient transports of goods [8]. It is mostly composed of interconnected canalized rivers and artificial channels that are divided by locks. Any part of a river or channel separated by at least two locks is a navigational reach. For simplicity sake, navigational reach will be called reach for the rest of this article.
The goal of an inland waterway manager is to maintain a correct level of water in all reaches to make navigation possible. This level has to respect conditions defined by the navigation rectangle (see Figure 2) and be as close as possible from the Normal Navigation Level (NNL). The lower and upper boundaries of the navigation rectangle are respectively the Lowest Navigation Level (LNL) and the Highest Navigation Level (HNL). The non-respect of the navigation rectangle could results in damage of both the network and the boat and so forbid navigation.
For normal situations, boats crossing locks is the main perturbation of the water level, since using a lock drains water from a reach towards another reach. Multiple other factors affect the water level, such as ground exchanges, natural rivers joining in a reach, the weather and other unknown exchanges, like illegal discharges. Locks are not dedicated to control water level as they are only tools to help compensate the difference of elevations in the network. However, specialized structures are presents all over the network to control the level of water. Structures, such as gates or dams are used to send water downstream and when available, pumps can be used to send some upstream. Those are the mains structures used to displace the water resource between the reaches of the network.
At the moment, navigation is only allowed during daytime periods, with few exceptions, notably on Sunday. Reaches management is based on human expertise gathered over time. However, new policies leading to traffic increase and climate change will impose new constraints that will heavily impact the current management strategies. An adaptive and resilient approach based on Markov Decision Processes has been proposed to anticipate the impact of those constraints and ensure the navigation requirements at each point of the network. It determines a global planning for the water distribution on the whole network by taking into account the uncertainties of climate events and of the navigation demand. The allocation of water is planned over a certain horizon to allow better anticipation of possible future events. The information on the current state of the inland waterway network is collectable in real time through a network of level sensors equipping the reaches.
3. MARKOV DECISION PROCESS
3.1 Definition
Markov Decision Process (MDP) is a generic framework modeling control possibility of stochastic of stochastic dynamic system as a probabilistic automaton. The framework is well adapted to the inland waterway network supervision since the state of the network is fully observable (in state of water volumes) and the control is uncertain due to uncontrolled water transit.
A MDP is defined as a tuple ‹S, A, T, R› with S and A respectively the finite state and action sets that define the system and its control possibilities. T is the transition function defined as T: S × A × S → [0, 1]. T(s,a,s’) is the probability to reach the state s’ after doing the action a in state s. The reward function R is defined as R: S × A × S → ℝ, R(s, a, s’) gives the reward obtained by attaining state s’ after executing a from s.
A policy function π: S → A is an assignation of action to each system state. Optimally solving a MDP consists in finding an optimal policy π* that maximizes the expected reward. π* maximizes the value function of Bellman equation [9]:
𝑉𝜋(𝑠) = ∑ 𝑇(𝑠, 𝜋(𝑠), 𝑠′) × (𝑅(𝑠, 𝜋(𝑠), 𝑠′) + 𝑉𝜋(𝑠′))
𝑠′∈𝑆 (1)
Multiple algorithms exists to solve optimally a MDP, a notable version is Value Iteration [10]. 3.2 Application to the inland waterway management
A quick simplified reminder of the modeling of IWN using Markov Decision Process, introduced in [7] is proposed here. The aim is to plan the best course of actions for the entire network over τ time steps, under possibly evolving conditions. For example, the fluvial traffic could have an unexpected increase on some reaches, leading to an increased locks usage; a sudden downpour would increase the volumes of affected reaches.
A time step represents a period of twelve hours in the network. At the moment, they model the active navigation periods during daytime and the inactive periods during the night. Large time steps are used to smooth the uncertainties on the traffic and other temporal variations, as well as considering the water level to be uniform on each reach.
3.2.1 Definition of states and actions
A state of the system, will represent the complete value of the network at a given time, and thus be an assignation of volumes for each reach of the network at a given time step. Similarly, an action will represent the amount of water moved by each transfer point (lock, pump, gate or dam) corresponding to the decision of a manager.
However, the MDP formalism requires discrete states and actions set. Since the volumes observed (obtained from level measures) and transferred between each reach are continuous, they had to be discretized in intervals. All possible volumes of the reach are divided in regulars intervals (see Figure 3), with the exception of the first and last intervals. They represent values outside of the navigation rectangle, so respectively all values under the LNL and over the HNL. To simplify the model, they are considered to be of infinite size. Transfer points follow a similar discretization, however as they are considered fully controllable they do not have intervals of infinite size.
Formally, the set of states S is defined as the combination of all possible intervals of each reach at all time steps. In a network of N reaches the set can be written as:
𝑆 = {0, … , 𝜏} × ∏[0, 𝑟𝑖𝑜𝑢𝑡]
𝑁 𝑖=1
Having the time step modeled in the state add the possibility to express temporal probabilities on uncontrolled or unknown inputs and outputs of the network.
Similarly the set of actions A is defined as the combination of the intervals of volumes transferred by each transfer point. Unlike the states, actions are time independent as, the assumption is made that the control capacities don’t change over time. A is defined as:
𝐴 = ∏ 𝐴𝑖,𝑗
𝑖,𝑗∈[0,𝑁]2 (3)
where 𝐴𝑖,𝑗 is the set of possible volumes intervals for points of transfer linking reach i to reach j. The reach with identifier 0 represents external elements, such as external rivers, that connect and is able to bring or take from any managed reach. The status of those external elements is not modeled in the state, they might correspond to reaches of a foreign country managed by another organism. It is important to note that the number of transfer points is limited as the inland waterway network is sparsely connected. In all transfer points 𝐴𝑖,𝑗, between two unconnected reaches i and j, no transfer is possible (𝐴𝑖,𝑗 = {0}).
Details on the transition function construction will not be presented in this article. It simply corresponds to the probability of uncertain water displacement that take into account the discretization. More information and details are available in [7].
3.2.2 Reward function
The objective of the planning is to maintain all reaches within their navigation rectangle and to try to minimize their distance to their NNL. This corresponds to the following function, to maximize, defined in cooperation with expert of the management of inland waterways.
𝑅(𝑠, 𝑎, 𝑠′) = 𝑓(𝑎) − ∑ { (𝑁𝑁𝐿𝑖− 𝑟𝑖𝑠′)2 𝑖𝑓 𝑟𝑖𝑠′ ∈ 𝑅𝑒𝑐𝑖 𝑔2 𝑖𝑓 𝑟𝑖 𝑠′∩ 𝑅𝑒𝑐𝑖 = ∅ (0.5 × 𝑔)2 𝑖𝑓 𝑟𝑖 𝑠′ ∩ 𝑅𝑒𝑐𝑖 ≠ ∅ 𝑎𝑛𝑑 𝑟𝑖𝑠′ ∉ 𝑅𝑒𝑐𝑖 𝑁 𝑖=1 (4)
where the function f(a) represent costs relative to the usage of the different transfers points. For example, using an electric pump costs more than opening a gate. This function will be highly specific to each reach and network. 𝑁𝑁𝐿𝑖 is the volume corresponding to the NNL of reach i. 𝑟𝑖𝑠′ is the volumes of reach i in state
s’. g is a penalty cost for halting the navigation when the water level is fully outside of the navigation rectangle. Half the cost is applied when the interval is only partially outside the rectangle of navigation.
This reward function penalized drastically the distance to the NNL, with a prohibitive cost when outside of the navigation rectangle. A smaller cost is used optimize the choice of transfer points used.
4. APPLICATION ON REAL DATA
The Douai-Fontinettes-Grand Carré subnetwork in the north of France inland waterway network has been modeled using the proposed modeling and plan over. This network is composed of three reaches with different navigations conditions (see Table 1). The three reaches, the circles, are connected by gates and locks, the arrows (see Figure 4). Those reaches are connected to unmodeled part of the network by transfer points (arrows: 0, 1, 2, 7, 8, 9, 10, 11) that consists in locks and external rivers. Their water levels are divided in 12 intervals, 10 of them with a fixed size, the first and last are considered of infinite size. In this scenario, only three transfer points are controllable by the manager of the subnetwork (arrows: 4, 6, 11), with respectively 124, 375 and 352 actions each.
Reach Name LNL NNL HNL Interval size
0 Douai-Don-Cuinchy 8660177 8778810 9016076 26363
1 Cuinchy-Fontinettes 9348300 9458280 9568260 24440
2 Don-Grand-Carré 3766098 3824038 3881978 12876
Table 1: Network properties
Multiple operating scenarios corresponding to real case applications have been proposed to test the proposed planning approach. All those scenarios are over eight 12 hours time steps corresponding to 4 days. The traffic values for each lock correspond to the average traffic of the subnetwork for a single period (see Table 2). The minimum and maximum transfer capacity of controllable transfer points are fixed and supposed to be the same for each scenario (see Table 3). The values transferred by each other transfer points will be dependent of the scenarios and so will be introduced during their presentation. The planning of all scenarios has not been subject to variations, however those will be present during the simulations to test the resilience. Due to the size of the model, a distributed version of the algorithm had to be used for the resolution. This lead to solutions that are local optimum. The decomposition of the subnetwork for the distribution is shown by the different colors of transfer points (see Figure 4).
Table 2: Average traffic and volumes transferred per lock per 12 hours Table 3: Controllable transfer points capacities per 12h
As actions of the modeled network corresponds to intervals of volumes by each controllable transfer point, the simulations use random values drawn from each interval of the chosen action instead of choosing the best or average values. The goal is to have a better perception of quality of the interval selected by the policy. Because the volumes transferred are chosen randomly, fives simulations were made for each scenario. This help visualizing the consequences of the random selection of transferred volumes of the used policy. A single policy is produced for each scenario but is simulated on different conditions, both expected and unexpected. Five different conditions are tested per scenario. The first three tests correspond to the expected conditions of traffic and water availability. In the first test, all reaches start at their NNL, in the second they start close to their HNL and in the third one they begin close to their LNL. In the last two tests, the traffic is respectively 10% higher and lower than the expected at all time.
Lock 0 3 5 7 9
Traffic (boat) 21 13 14 10 16
Volumes (m3) 140889 45838 82656 230000 117424
Transfer points 4 6 11
Figure 4: Decomposition of the subnetwork
4.1 Normal conditions
The first scenario corresponds to the normal conditions of navigation, with navigation allowed only during daytime periods. No perturbations are anticipated on the network and the expected traffic corresponds to the average value. The volumes transferred by the uncontrollable transfer points in this scenario are in defined in Table 4.
Transfer point 1 2 8 10
Volumes (m3) 283392 -43200 27216 51840
Table 4: Uncontrollable volumes per 12h
On Figure 5, it is possible to see the evolution of the relative distance of the three reaches to their NNL over time under normal condition and expected traffic, with a value of 100 corresponding to a volume at the HNL and a volume at -100 to the LNL. One can see the volumes of the three reaches oscillating around their respective NNL. The oscillations are due to the discretization of both the state and action in interval. An interval of volume corresponds to a single state, which means a single action from the policy, however the optimal actions at two opposite points in the interval might be different. For example, if an interval englobes the NNL, the optimal choice for the upper part of the interval would be to decrease the volumes while for the lower part it would be preferable to increase it. The impact of the oscillation is dependent on the size of the intervals, and smaller discretization would lead to better results but with an increased size of the model.
If the reaches start for a suboptimal position (see Figures 6 and 7), they are able to recover to a solution close to their NNL by following the planning produced. It is possible to see that coming back from the LNL is easier than from the HNL. This due to the fact that, in this network, storing water is easier than removing it.
The last two experimentations consist in having respectively an increase (see Figure 8) or decrease (see Figure 9) of the traffic compared to the expected value. In both cases the reaches manage to relatively stay close to their NNL, even if the limit seems to be showing in the case of a smaller traffic than expected as reach 0 has trouble to reduce its water level.
Figure 6: Starting close to the HNL Figure 7: Starting close to the LNL
Figure 8: Traffic 10% greater than expected Figure 9: Traffic 10% lower than expected
For this scenario, the produced plan was able to maintain ideal navigation conditions in expected case, to recover from bad events that leaves the network at suboptimal water levels and was able to adapt to unexpected traffic conditions.
4.2 Low flow conditions
During summer or drought periods, the external rivers flow will be minimal but the traffic is still present and the navigation condition has to be maintained. The second scenario corresponds to this case, during low flow periods, with reduced uncontrolled water income (see Table 5), but still with the same traffic.
Transfer point 1 2 8 10
Volumes (m3) 108000 -12960 15120 40608
Table 5: Uncontrollable volumes per 12h during low flow
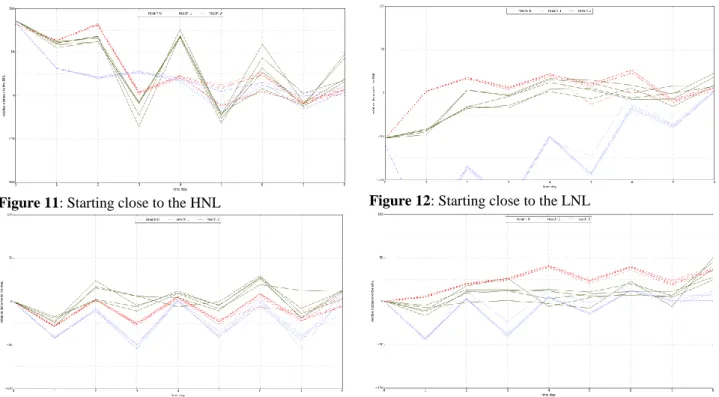
It is possible to see on Figure 10, that results are similar to the scenario under normal conditions, the different levels still oscillating around their NNL. However the oscillations, especially for reach 2 are wider than in the first scenario. This is due to the fact that more water as to be displaced to compensate for the reduced uncontrolled incomes. When reaches start close to their HNL (see Figure 11), they are able to globally recover by the end of the simulation, with some difficulty for reach 2. Some choice of volume in the chosen action interval leads to drastically better results than other: 20% of distance compared to 50% in the last time step. Alas, if reaches start close to their LNL (see Figure 12), the locally optimal solution doesn’t allow to recover directly the network. A reach, reach 0, has to go outside of its navigation rectangle to let the
network recover. Nevertheless at the end of the planning period, the entire network is fully working again and levels are close to their NNL.
Figure 10: Low flow condition, starting from NNL
In the case of unexpected traffic increase (see Figure 13) or decrease (see Figure 14), the network can maintain itself. The difficulty of dealing with less traffic that was present under normal condition is attenuated thanks to the reduced of uncontrolled income.
Under low flow conditions, the generated plan still ensures a certain resilience of the network, but as expected has difficulty to recover from low reach levels situation. Even then, if given enough time and no unexpected perturbation, the network will be able to recover.
Figure 11: Starting close to the HNL Figure 12: Starting close to the LNL
4.3 Future conditions
In the future, the goal is to allow traffic during nighttime. Furthermore, the traffic is also expected to increase. This condition has been applied to this subnetwork to test its capacity to handle such an increase of traffic with the suppression of the resting time during the night. This scenario follows the same uncontrolled volumes as the normal condition, navigation is allowed during the night. This scenario assumes that the night and day traffic will be the same implying a daily increase of boat crossing lock by 100%.
Figure 15: Future conditions: starting from NNL
The plan obtained for the future conditions (see Figure 15) leads all reaches, starting from their NNL, to a smooth evolution with small oscillations. Those smaller oscillations are due to the homogeneous traffic, that doesn’t stop during the night. Under those conditions of navigation, there is no difficulty for the network to recover from events that lead the reaches to their HNL (see Figure 16) or to their LNL (see Figure 17). In both case, the recovery is pretty quick in only 2 time steps. When starting close to the HNL, the recovery is significantly faster than in the normal conditions, as the traffic is more important it is easier to move large volumes of water from on reach to another. If the traffic is lower than expected (see Figure 19), the plan produced is still efficient. However, in the case of a traffic increase (see Figure 18) some simulations went close to crossing the LNL. As simulations choose random values in the selected intervals, it is possible that a bad succession of choice lead to poor results. Three of the five simulation went close to the LNL while the other went closer to NNL. This shows the limit of the discretization in interval of volumes for both action and state and the importance of the chosen value in the interval by the manager, as the same intervals can lead to both good and bad results depending on the chosen values.
5. CONCLUSION
In this article, the modeling of the inland waterway network, using Markov Decision Processes, that aims to optimize the water management in inland waterway networks by planning over a given horizon have been used on a real subnetwork in the north of France. This approach aims to reduce the impact of drought and flood that may be increased by climate change in the next years.
The modeling has been tested by planning on the Douai-Fontinettes-Grand Carré subnetwork in the Hauts-de-France under different scenarios of traffic and weather. The plan obtained for each scenario has been tested under both expectable and unexpected conditions, leading to positive results. Those plans over short periods of time could increase the resilience of the network. However limits are showing due to the discretization as, in some cases different values from the same action interval can lead to drastically different results in reality.
Future works would try to minimize the size of the chosen action intervals to ease and reduce the impact of the choice of volumes for the network manager. The question, on how to choose a volume from the intervals in a real situation stay open, it could be, for example, the result of a greedy algorithm or of the experience of the managers. It would also be interesting to continue to model the inland waterway network of the Hauts-de-France to get a better vision of the evolution of the network and to find the weakest links in the network to improve its resilience. Finally, experimentations of periods of flood to try to minimize the damage would also be explored.
REFERENCES
[1] IPCC, "Climate Change 2014," The Core Writing Team, R. K. Pachauri and L. Meyer, Synthesis Report.
[2] I. Mallidis, R. Dekker and D. Vlachos, "The impact of greening on supply chain design and cost: a case for a developing region," Special Section on Rail Transit Systems and High Speed Rail, vol. 22, pp. 118-128, 2012.
[3] S. Mihic, M. Golusin and M. Mihajlovic, "Policy and promotion of sustainable inland waterway transport in Europe - Danube River," Renewable and Sustainable Energy Reviews, vol. 15, no. 4, pp. 1801-1809, 2011.
[4] R. K. Pachauri, M. Allen, V. Barros, J. Broome, W. Cramer, R. Christ, J. Church, L. Clarke, Q. Dahe, P. Dasgupta and others, "Contribution of Working in Groups I, II and III to the Fifth Assesment Report of the Intergovernmental Panl on Climate Change," Climate Change 2014: Synthesis Report., 2014. [5] M. Beuthe, B. Jourquin, N. Urbain, I. Lingemann and B. Ubbles, "Climate change impacts on transport
on the Rhine and Danube: A multimodal approach," Transportation Reasearch Part D: Transport and Environment, vol. 27, pp. 6-11, 2014.
[6] H. Nouasse, K. Horvàth, L. Rajaoarisoa, A. Doniec, E. Duviella and K. Chuquet, "Study of global change impacts on the inland navigation management: Application on the Nord-Pas de Calais network," Transportation Research Procedia, vol. 14, pp. 4-13, 2016.
[7] G. Desquesnes, G. Lozenguez, A. Doniec and E. Duviella, "Planning large systems with MDPs: case
study of inland waterways supervision," Advances in Distributed Computing and Artificial Intelligence Journal, vol. 5, no. 4, pp. 71-84, 2016.
[8] C. Brand, M. Tran and J. Anable, "The UK transport carbon model: An integrated life cycle approach to explore low carbon futures," Energy Policy, vol. 41, pp. 107-124, 2012.
[9] R. Bellman, "A Markovian Decision Process," Journal of Mathematics and Mechanics, vol. 6, no. 4, pp. 679-684, 1957.
[10] M. L. Putterman, Markov Decision Processes: Discrete Stochastic Dynamic Programming, John Wiley & Sons, Inc, 1994.