Université de Montréal
Using Electroencephalograms to Interpret and Monitor the
Emotions
Par Amin Shahab
Département d’informatique et des recherches opérationnelle Faculté des arts et des sciences
Mémoire présenté
en vue de l’obtention du grade de Maîtrise en informatique
July, 2017
Résumé
Le long voyage de la technologie a totalement changé la vie des gens : les humains ont marché sur la lune, les rovers1 découvrent Mars, les ordinateurs sont une partie inséparable de nos vies et dans le domaine de la santé, il y a des traitements pour beaucoup de maladies et l’espérance de vie a été significativement accrue. En plus, les scientifiques ont étudié les émotions humaines et ont essayé de les détecter en se basant sur differents paramètres tels que l'expression faciale, la parole et l'intonation, la réponse électrique et la communication verbale. Ces méthodes fonctionnent sur la base de l'effet des émotions humaines sur le corps et le comportement, mais l'émotion n'est pas le seul paramètre qui affecte le corps et les attitudes des gens. De plus, les personnes pourraient faire semblant, cacher leurs émotions et contrôler leurs réactions. En plus, les personnes ayant une limitation physique réduiront la précision de la reconnaissance correcte des émotions. Les chercheurs ont trouvé une relation directe entre les émotions et les activités cérébrales, les gens ou les limitations physiques ne pourront pas réduire la certitude de l'émotion détectée.
Nous avons utilisé les EEG (électroencéphalogramme) pour créer un outil appelé Emotimap, qui détecte les émotions actuelles, surveille l'évolution émotionnelle en temps réel, et détecte également l'émotion générale. L'émotion actuelle est ressentie de façon brève et forte par rapport à des facteurs émotionnels et l’émotion générale est celle qui engage les gens pendant une longue période. Emotimap utilise des formules pour calculer l'Arousal et la Valence des personnes, puis ignore les sensations non stabilisées et cartographie le résultat sur les deux dimensions du diagramme de Circumplex de Russel pour détecter les émotions.
Nous avons demandé à 20 personnes de participer à une expérimentation dans laquelle ils sont confrontés à différents facteurs émotionnels dans une réalité virtuelle (RV) isolée pour observer et sauvegarder l'information du facteur émotionnel et de leurs réactions. Les résultats montrent que les participants ont ressenti exactement ce qui était attendu avec le taux de 37,73% lorsque la distance métrique est seulement 1,55%, la distance métrique étant la proximité du
ressenti et de l’émotion attendue (un plus petit nombre montre la plus grande similitude). La comparaison des différentes formules montre que les équations les plus similaires sont des formules avec le même nombre de capteurs utilisant 𝛽𝛽 et 𝛽𝛽𝑙𝑙𝑙𝑙𝑙𝑙 avec le taux de 40% de similarité, avec une distance métrique entre 20% à 60%. La raison est que certaines équations détectent les émotions plus tôt et d'autres forment des pics d’amplitude plus grands. En détail, les relations mathématiques avec 𝛽𝛽ℎ𝑖𝑖𝑖𝑖ℎ détectent une émotion un peu plus tôt que les équations avec 𝛽𝛽𝑙𝑙𝑙𝑙𝑙𝑙. De plus, les formules avec douze capteurs suivent les changements très faibles d’amplitude des EEG, les formules avec quatre capteurs sont plus sensibles dans les pics, et les formules avec deux capteurs sont les plus sensibles. La comparaison de la similarité des réactions des participants avec la similarité des caractéristiques basées sur le test Big 5 montre que l'effet de la mémoire est plus fort que l'effet de leur caractéristiques. En analysant les résultats, Emotionap a pu détecter avec succès l'émotion générale du participant avec un taux de 95%.
Abstract
The long journey of technology has totally changed human’s life: human stepped on the moon, Mars rovers2 are discovering the Mars, computers are one inseparable part of our lives and in the health section, people live longer, there are treatments for lots of sicknesses. Also, scientists have studied human’s emotion and tried to detect their emotions based on different parameters such as facial expression, speech and intonation, electrical response, verbal communication. These methods work based on the effect of human emotions on body and behavior, but the emotion is not the only parameter that effect on body and attitudes of people. Additionally, people could pretend, hide their emotions and control their body and reactions, also, people with a limit on their body movement will reduce the accuracy of correct recognition of emotion. Researchers found a direct relation between emotions and brain activities, people or limit in body movement could not reduce the certainty of detected emotion.
We used EEG (Electroencephalogram) to create a tool called Emotimap that detects current emotion, monitor emotional evolution in real-time, also detects the general emotion. Current emotion is brief and strong, emotions that people feel again any emotional factor and general emotion is the emotion that engages people for a long time. Emotimap uses formulas to calculate the Arousal and Valence of people then ignore unstabled feels and maps the result on the two dimensions Russel’s Circumplex diagram to detect the emotions.
We asked 20 people to participate in an experimentation in which they faced up with different emotional factors in an isolated Virtual Reality (VR) to observe and save the information of emotional factor and their reactions. The results show participants have felt exactly what was expected with the rate of 37.73% when the metric distance is just 1.55%, metric distance is the proximity of felt and expected emotions (smaller number shows the more similarity). Comparing different formulas shows the most similar equations goes to formulas with the same number of sensors using 𝛽𝛽 and 𝛽𝛽𝑙𝑙𝑙𝑙𝑙𝑙 with the rate of 40% of similarity, with metric distance in range of 20% to 60%. This is because some equations detect emotions sooner and some others are more strong in picks amplitude. In detaile, equation with 𝛽𝛽ℎ𝑖𝑖𝑖𝑖ℎ detects an
emotion a little bit sooner then a equation with 𝛽𝛽𝑙𝑙𝑙𝑙𝑙𝑙, also, formulas with twelve sensors chase the EEG amplitude changes very weak when equation with four sensors are more sensible in picks, and the formulas with two sensors are the most sensible. Comparing the similarity of the participant reactions with their similarity of charactristics based on Big 5 test shows that the effect of memories is more stronger than the effect of their charactristic. Analysing the result shows Emotionap could successfully detect general emotion of participant with the rate of 95%.
Table of content
Résumé ... i
Abstract ... iii
Table of content ... v
Table of figures ... vii
Table of tables ... ix Table of abbreviations... x Acknowledgement ... xii 1 Introduction ... 13 1.1 General context ... 13 1.2 Research objective ... 15 1.3 Thesis organization ... 15
2 Importance of recognition and regulation of emotions ... 17
2.1 Emotional recognition systems ... 18
2.1.1 Introduction ... 18
2.1.2 Methodology and problematic ... 18
2.1.3 Conclusion ... 20
2.2 Emotion Reduction Systems ... 20
2.2.1 Introduction ... 20
2.2.2 Methodology ... 21
3 Measuring the emotions ... 24
3.1 Introduction ... 24
3.2 Methodology ... 26
3.2.1 Arousal and valence ... 27
3.2.2 Hardware ... 27
3.3 Emotimap ... 32
3.3.1 Methodology ... 32
3.3.2 Raw data problematic ... 35
3.3.3 Filters ... 36
3.4 Experiment ... 37
3.4.1 Software ... 39
3.4.2 Pre-experiment forms... 40
3.4.3 Post-experiment form... 41
3.4.4 After experiment conversation ... 41
4 Results ... 43
4.1 Method of assigning emotions to emotional factors ... 43
4.2 Effect of emotional factor ... 45
4.3 Formula comparison ... 47
4.4 Big Five ... 51
4.5 General emotions ... 52
5 Conclusion ... 55
Bibliography ... i
Appendix one: consent form ... v
Appendix two: Big 5 form ... viii
Appendix three: protocol of the experiment ... x
Appendix four: post experiment form ... xii
Table of figures
Figure 1. The brain parts - Cortex of the brain [27] ... 25
Figure 2. Two-dimension Circumplex space model [26,28-30]. ... 26
Figure 3. Emotimap EPOC ... 28
Figure 4. The position of sensors on Emotiv Epoc, Based on international EEG position ... 28
Figure 5. Google Cardboard VR headset ... 29
Figure 6. Limitation mapping ... 33
Figure 7. Emotimap shows emotional evolution off-line ... 34
Figure 8. Effect of the memory on the emotional state of person [35] ... 35
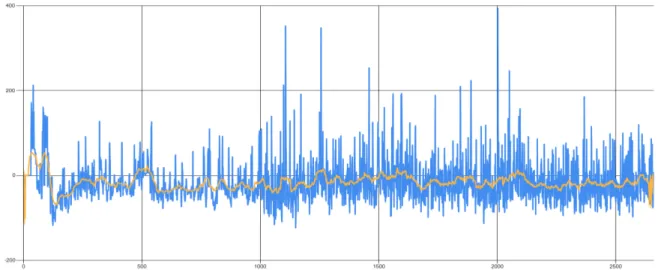
Figure 9. The effect of smoother on raw data, in the value-time diagram. Blue line is raw data, and orange line shows smoothed values ... 36
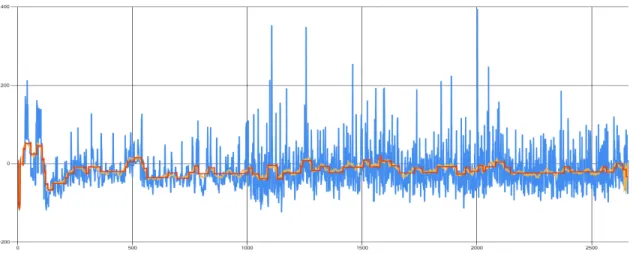
Figure 10. The effect of jump-remover on smoothed data, in the value-time diagram. Blue line is raw data, orange line shows smoothed values, and red line shows the final value ... 37
Figure 11. A scene of pre training 360 degrees movie ... 38
Figure 12. Steps of experiment ... 39
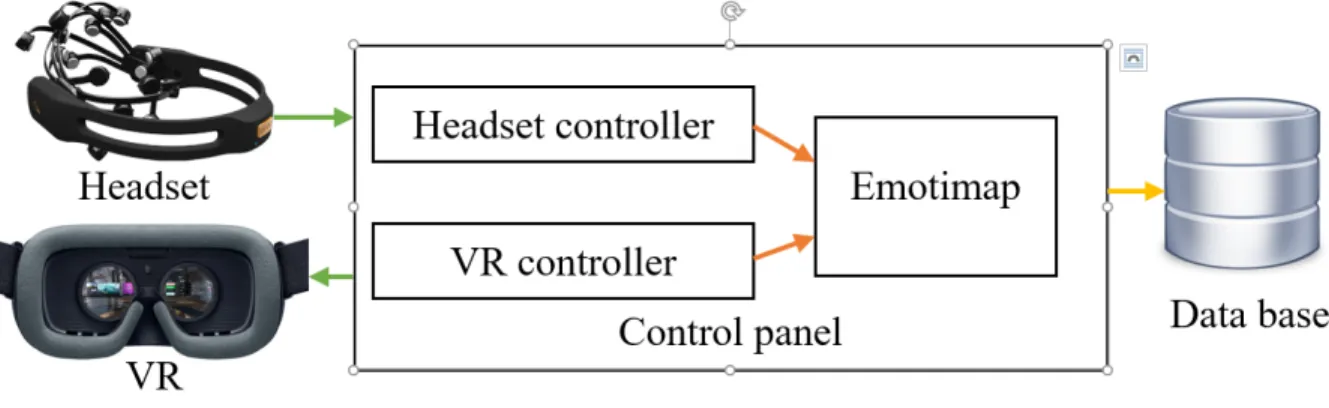
Figure 13. Relation and correlation between the software and hardware of experiment ... 39
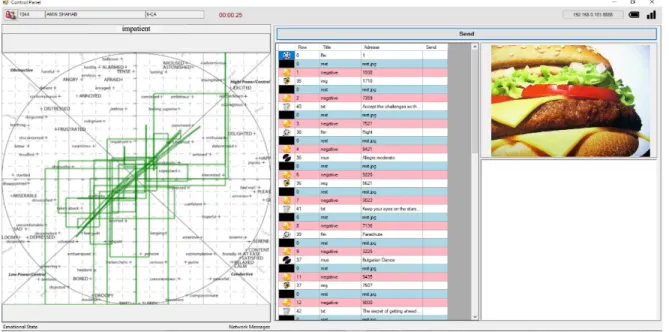
Figure 14. Control panel ... 40
Figure 15. positive emotional factor (image) ... 42
Figure 16. Steps of finding the most powerful emotions created by one emotional factor ... 43
Figure 17. The emotions created by one emotional factor and its accumulative repetition of emotions with their percentage ... 45
Figure 18. Error rate between emotions that emotional factor created and what participant felt ... 46
Figure 19. Similarity between the formulas depending on the number of sensors ... 47
Figure 20. Position of emotion - Comparing the different emotions depends on position ... 48
Figure 21. Average of metric distance between the formulas depends on arousal and valence on 2D diagram... 49
Figure 22. Comparing the formula using 𝛽𝛽, 𝛽𝛽𝛽𝛽𝛽𝛽𝛽𝛽 and 𝛽𝛽ℎ𝑖𝑖𝑖𝑖ℎ... 50
Figure 24. Comparing the characteristic state of participant with similarity of their reaction to the emotional factors ... 51 Figure 25. Rate of general emotion recognition with no error depends on the cut of most repeated emotion (%) ... 54
Table of tables
Table 1. List of emotions created by an emotional factor and emotions assigned to emotional factor ... 44 Table 2. Table of error rate between emotions of participant and emotions normally tagged by emotional factor and its metric distance ... 46 Table 3. Error rate of detected general emotion ... 53
Table of abbreviations
RV : Réalité Virtuelle VR: Virtual Reality
IA: Intelligence Artificielle AI: Artificial Intelligence EEG: Electroencephalograms BCI: Brain-Computer Interface DNA: Deoxyribonucleic acid
IADS: International Affective Digitized Sound system IAPS: International Affective Picture System
Acknowledgement
I would like to thank professor Claude Frasson, my research director for his trust when he accepted me as a member of HERON and all his support and advice that helped me so much in the research.
I would like to give my appreciation to my mother who always trusted and supported me, I could not continue my education without her support.
Also, I would like to thank my professor, Philippe Langlais, for his help and advice. Likewise, I would like to thank my colleagues, Asana Neishabouri, Hamdi Ben Abdessalem, Maxime Isabelle and Guoxin Gu Gabrielle for their help and especially I want to thank René Lancine Doumbouya for all his help and collaborations.
1 Introduction
1.1 General context
The development of science and its effect on human life is immense. Technology advancement has a variety of benefits to humans life, such as safety and ease in travel by creating secure vehicles and airplanes, health by developing new methods of surgical procedures and new medications. These days people live longer, babies die less than any time registered in history, but it does not mean that they are living better[1]. But these are one side of the coin, technology development has brought some complexity to human’s life, airplanes crash, vehicles make sound noise and pollution, and drugs have side effects. Technology could also affect human emotions, technology development changes life style of people, that make them to adapt themselves to a new and unfamiliar situation. For example, in modern life, the count of people who live far from their family is much more than before, the number of people who keep their privacy again their family and share their private life on social media for the strangers is growing. All these new habits could lead people to be alone, with no real emotional attach that could end with emotional problems[2].
All these problems are a big objective for a scientist to find a way to keep human health emotionally. At first, we need to find a way to recognize the emotional state of people and to reduce their negative emotion. Obviously, the first method to recognize emotions is their assertion which is not reliable, because
• they could pretend to feel a fake emotion,
• their emotional state could be very complex and not easy to recognize, • sometimes they could not be capable to explain their feels (babies, retarded).
Scientists have tried different methods to retrieve the emotion of state of a human such as facial expression [2-4], behavior [3], speech and intonation[2,4], electrodermal response [2], verbal communication [3] and head movement [4]. Although these methods could retrieve the emotion, the result is not very reliable because people can pretend know their emotion, or sometimes one emotional factor could affect people differently. For example, in a situation when
people should get moderately angry3, one person who is aggressive will get angry when a calm person will stay calm. On the other hand, if the action of people is not standard, we could not expect a clear result. For example, a facial expression system could not recognize the emotion of a person who has knitted eyebrows, or a person with disorder on his/her face [5,6].
For another example, speech and intonation system would not return good results [5], for the person who has tongue tie problem or a person with blood pressure problems, he/she could be recognized as a nervous person when we use electrodermal response system to find her/his emotion. there are some cultures in which people try to hide and do not show their emotions4, their face is normal when they feel bad or good, if they were trying to hide their emotion for a long time, this could affect even their heart rate, their face or body reaction. There is another group of people in society who have an handicap, some of them could not talk, some of them could not control his/her face or body movement, etc.
The research shows a relation between the emotional state and brain signal [2,5,7-18] but it is not very easy because brain structure is very complex and we do not access to all the brain parts [12]. We used Emotiv headset as a low-cost headset to retrieve raw EEG data from the brain [7], then We developed an EEG interpreter and monitor called Emotimap which receives raw data, filters them and recognizes the current and general emotion of a human. In this method, we easily avoid the participants pretending, side effect of sickness on participants’ face, heart rate, etc.
Emotimap could be used in a wide variety of purposes and systems. Everywhere we need to be aware of emotional state such as medical application [3], Video game [3,4,19,20], Marketing [3,13], Learning environment [4], Health care system [4,13], Brain-computer interface (BCI) [19,21-23,20], Transport [13] and Commerce [7].
3 later we will explain that the reaction of people is based on lots of thing like memory and personal life of person
and of course emotional situation around person that is why we could be witness of totally different reaction to one single emotional factor. The memory of everybody has more powerful effect on his/her current emotion.
4 In our experiment, we found that some people show their emotion in their face or body action and the others did
not show any emotion when they felt good or bad, interesting part is similar behavior follows the similar cultures, we will explain it in detail in the experiment chapter.
1.2 Research objective
Emotion has a positive or negative impact on human life in personal and societal aspect. One person with positive emotion has a healthy mental life and when a person lives with negative emotion such as being nervous, stress full, etc. he/she has problem in his/her personal life, in family life and in professional life. The person carries a heavy problem with his/her self, usually in private, which makes his/her partner and kids under emotional pressure, that make them potentially future mentally sick person. It could be worse if he/she holds an important job position, for example, a pilot or a surgeon who has people’s life in their hand.
There is a mutual relationship between healthy people and healthy society. As much as the number of healthy people in a society goes up, the society is healthier and in a healthy society, the risk of people’s mental illness is less and less. That is why we wanted to create a method and a tool to help people live healthier by detecting and controlling emotion. The goal of owning a tool that could recognize how we are emotionally is the base of this research. We can use this tool to make sure if the pilot is mentally ready for the fly, the surgeon is prepared for a hard surgery today. The tool which can help a psychologist to monitor the patients’ emotional state to cure them faster.
The goal of this study is to find a fast and reliable method to recognize the emotion of people and monitor the evolution of their emotion in a way that the user could follow easily his emotional reactions. This tool will be able to connect to any kind of EEG headset5, and to interpret and monitor the emotions in real time, or offline, also it could be used in other software.
1.3 Thesis organization
In the present work, we explain the importance and technique of recognizing the emotion of a human, and we detail our method and system called Emotimap. The structure of the report is the following
• In Section 2 we discuss the importance of recognition and regulation of emotion.
• In Section 3 we describe how we measure the emotion and what methodology is used. We detail the Emotimap system that we developed and the experiments done for assessing the system.
• In Section 4 we present the results obtained and discuss the advantages of our approach.
• Section 5 concludes our work.
We attach in annex the paper accepted at the international conference on Brain Function Assessment in Learning (BFAL) 2017, Patras Sept 23-25, 2017 Springer–Verlag–LNAI. Using Electroencephalograms to Interpret and Monitor the Emotions, Amin Shahab and Claude Frasson, September 2017.
2 Importance of recognition and regulation of emotions
Developing science gives the humanity the abilities that no one could imagine before. For example, in health domain, in the past, lots of people could die prematurely because of illness, but technology brings us now a cure for them and no more person die because of such diseases. Today doctors could use x-ray images, different chemical test, biopsy and lately intelligent systems which can assist the doctors to find cancer tumor in x-ray images and in real time endoscopy. Doctors can find an enormous amount of information from deoxyribonucleic acid (DNA) of people, that help them to know lot more about our body individually. Now, they can prevent, recognize and cure lots of physical sickness that we could not imagine before. Majority of these improvement is related to body and technology development in mental side is not as advanced as in physical side.
Handicaps: sometimes the soldier who has defended his country remains with a handicap, sometimes some babies born with a problem, some people lost parts of the body or their abilities in an accident. They need help to do a primary activity, and they have right to live just like the other people, and if they do not society should take care of them. If we could bring them back their abilities, it is a great help to them, to their family and society. Reading their mind and send a command to a robot that talks or a robot that works like hand or foot or a robot who could call the emergency when it is necessary could help them live independently, so emotion recognition is very important and keeps their hope and confidence.
Gold age: people lose they abilities when their age goes up. They will need help in some cases and it is hard for an independent person to see he/she could not live without his/her children help. It happens when elder people have an enormous amount of experience and society will lose him/her because of age. On the other hand, when they need help, they will believe that they are bothering people around them, then they hide their need and their emotions, and in a loop, they hide more what they need and their need more and so on, and in this case it would be beneficial to recognize their emotion.
If we could recognize people emotion we could also use this ability in other cases such as:
• When a baby does not stop crying, and we do not know what is wrong, an emotion recognition could help us.
• When an unconscious person arrives at the hospital, we could get lots of information from his/her mind.
• Help the handicap play music by their mind.
• Read the mind or recognize the emotion of person in court with permission of the judge, or maybe when a baby is kidnaped, and police have one suspect.
• Identify the emotion state of people with important jobs, to find if their mind is ready and stable, for example, pilots, surgeon, etc.
The ability of being aware of what is going on in someone’s mind could be a threat again personal privacy. In fact, almost everything human invented could be used in a good way or bad one, but the reason of creation is need. Then continue living without technology is not going to be easy and we need to use new technologies, inventions and methods. To limit the loss of privacy we must find a way or make the rules to respect the privacy and be aware that there is always a group of people who can abuse the technology for their benefits.
2.1 Emotional recognition systems
2.1.1 Introduction
Many researchers have tried different methods to detect people’s emotions. Some of these methods return better results and some of them need special situations to work. For example, some methods need to have a visible sight of eyes or face of a participant, some others need to receive the voice of a participant. Any of these prerequisites is a limit in our work when universal and functional method should work for anybody and with minimum of the prerequisites. In this section we will explain some emotion detection methods.
2.1.2 Methodology and problematic
In this part, we will present some emotion detection methods and explain how these methods work and what is their weaknesses.
The first method we explain uses heart rate [13] to recognize the emotion. This method is based on the effect of emotions on heart rate using trained labeled heartbeats to find received heartbeat belong to which emotional category. The weakness of this method is that other things could affect heartbeat, for example sickness like high or low blood pressure, heart arrhythmia and overweight problem. Therefore, we could not expect this method to detect the emotions of sick people correctly.
Another method is facial expression [2,3] which is trying to detect emotion from the situation of face element. Humans could understand or at least predict people emotions from their face. The sense of eyebrows, the situation of eyes and lips, the front and some time the color of the face (is it red or pale) could give us clue about emotions of people. This method uses the same parameters to detect the emotion. Face expression has some limitations, participant’s face should be visible means participant should be in a bright room, always in front of a camera and should not use instrument like Virtual Reality (VR) on the head. Another problem is that the participant could mimic and hide his/her real emotion, then facial expression method would detect a totally wrong emotion. The other limits of the method is that it could not work properly if the face has a problem such as a paralysis.
Verbal communication [3], speech and intonation[2] is used to recognize the emotions too. The problem is that some people who cannot talk, or talk with tongue tie. Also, some people hide their emotions in talking, and the number of emotions that this method could recognize is limited.
Another method that could recognize emotion more or less with the same problems are based on behavior [3], electrodermal response [2], skin conduction [13]. Another modern method is using the brain signal [2,12,13] to recognize the emotions. The problem of this method is that we need an instrument which must be connected to the head of people. However, this method has good benefits. At first, this method retrieves the emotion directly from the head so people could not hide their emotion, we do not need to see them or hear them, they could be even sleeping or in a comma and the emotions we could recognize are not limited. In our research, we have used this method which will be explained in the following chapter.
2.1.3 Conclusion
Recognizing human emotions gives us great ability to cure their emotional and mental disease researchers have examined different methods to recognize the emotions of a human, they tried to retrieve the emotion from heart, skin, face and brain signal. Every method has some advantages and disadvantages, but the method that could directly extract the emotion from brain signals6 is the most precise.
2.2 Emotion Reduction Systems
2.2.1 Introduction
Scientists and researchers have worked on the evaluation of human health in different ways. But a human has two aspects, the body and the mind. The body is accessible and even the most interior part is more accessible than mind. On the other hand, physical health problem, usually has visible effect or pain, but the effect of mental problem is hidden inside the behavior of people, and the sick person will carry the problem till it gets worse. These two reasons explain why we do not have tools and methods for observing, imaging and testing the mind as much as the method and technologies that we use to diagnosed physical health problems.
One of the most common mental problems in city life is being nervous. The complexity of life, thinking about bills, sickness, kids, failure in marriage and lots of other things to be worry about is on the mind of people who live in middle of traffic, noise, and pollution and etc. put stress on a lot of poeple. Then we need to do different things to get back our calm. Then the researcher should observe the people lives, and find the element and parameters which are common in more healthy people. Then we could use these parameters and measure the power of every element based on the different emotional states of people to help them to be calm and live more happy.
6 Some people believe that source of emotions is the heart and some other believe emotions are created inside and
by the brain. Researchers have found direct relation between brain activities and the emotions of human, then if even brain is not source of emotions but is nearest known part of body to the source of emotions.
2.2.2 Methodology
The brain does not understand if a person is doing something or just thinking about it. In fact, we could use the memory in the brain to create emotions inside the brain [3]. The brain will simulate the real situation through the senses such as visual, odor, taste, audio and tactile sensors. The idea is to extract the visual, odor, taste, audio and tactile elements from the situation that people find themselves calm, and use the parameters in a calming sequence such as video game, music, etc.
From now on, we call these parameters that could change the emotional state of people,
emotional factor and they are two types; positive emotional factors are supposed to make people
feel good and negative emotional factor are supposed to make people feels bad7. In this research, we have introduced one negative emotional factor composed by images and four positive emotional factors which are images, texts, films 360 degrees and music. In the experiment, we put the participant in a virtual reality ambiance where he sees a sequence of images that make him feel bad, then after every negative image, he can see one image, film 360 degrees, text or hear the music. All the time his emotion is registered, and then we can study his emotion and the effect of different types of emotional factors. In following sections, we detail the emotional factor.
2.2.2.1 Music
One of the most effective and strong elements that make people feel positive or negative is music. Music is one unrepeatable part of human life. From very long time ago and in every point of earth, we could find a very simple instrument or a complex one that people used to make a harmonic sound. The effect of music on a human is so strong that sometimes people show their emotions by smiling, crying and even dancing. Dance is following the harmony and rhythms with the body. Then, of course, the music is one of our chosen emotional factors.
7 These emotional factors are supposed to make people feels positive or negative, but in experiment I saw people
do not feel what is expected. The reason is the emotion created is based on the memory of people and people have totally different memories. This topic will be more explain in section three.
Music has lots of different aspect such as genre, rhythm, tempo, melody, and orchestration. There are the researchers who study the effect of music on human emotion, and it is not the goal of this research, then we simplified it, by choosing just instrumental music with simple orchestration but a variety of rhythms, tempos, and genres. Three music tracks are natural sound taken from IADS (International Affective Digitized Sound system). IADS8 is a collection of images to simulate and study the emotions [3,24].
2.2.2.2 Text
In a hard time of life, one phrase of a great or successful person could bring us the motivation, helps us to feel better or may be make the person sad or angry, because they think they are under presser of the problem and just talking is easy. That is why we wanted to test it and find out for how the rate of people who get calm or upset according to the type of text. We created a robot that extracted some phrases in English from great politics, artists, and scientists from the internet, then we translated them in French and Farsi. The purpose of this translation was that the participants do not waste any second to translate the phrase and eventually reduce that emotional reaction.
2.2.2.3 Movie 360 degree
The most similar situation to the reality is virtual reality. New technology brings us the ability of using films 360 degrees or virtual reality to put the participant in the middle of a scene where he can turn around and look up and down to watch and hear. This technology engages the audible sense and eyesight of human; we used the film 360 degrees in the experiment. The films are chosen on the color, place and calmness and excitement of films. We used some films that contain scenes such as under the sea, sea side, sky diving, etc.
8 IADS is a collection of sound that is developed and distributed by NIMH center of emotion and attention (CSEA)
2.2.2.4 Image
Image with colors, scene and elements in it is one strong emotion creator. Then we used the image as one of the emotional factors, and we chose the labeled images of IAPS9 (International Affective Picture System) used as one of the most used and popular labeled image dataset to study the emotions[3,24,25].
As we explained, we show the participant the images that make them feel bad, sad, nervous, etc. To do that, we used the images of IAPS as a negative emotional factor and then one positive image, text, music or film 360 degrees as a positive emotional factor to measure and observe their emotional reaction. To classify the emotions, we used the arousal and valence of the images, arousal and valence exist in IAPS. Then we mapped the images to Russel diagram [26] and used K-nearest neighbor method to assign the emotion and distance from symbol of emotion on the diagram to every image. Then we chose the nearest image to emotion as symbol of that emotion and used them as negative emotional factor or positive emotional factor.
9 IAPS is a collection of pictures that is developed and distributed by NIMH center of emotion and attention (CSEA)
3 Measuring the emotions
3.1 Introduction
The ability to extract the exact emotion of a human would be a very useful tool that is demanded for a variety of different purposes [17,26], from entertainment to health [3,13,19]. There are people who hold a very important job, people who have human life in their hands, like a pilot or a surgeon, their job is so important that they do not work alone. The problem is that the team members trust them so much, that they would not stop them or warn them until it is too late. If we had a headset that could measure the mental preparation of them before surgery operation or flight, lots of human error could not happen, and lots of lives could be saved. For another example, this tool could be a very helpful assistant for a physiologist who needs to spend a long time to get into the patient’s mind (and the mind is very complex), a big deal for juniors. This problem increases when there is patient with a real problem that needs more help than the others, but this tool could easily show the real emotion of the people. Sometimes small kids cannot explain themselfs, and their parents do not take them serious attention. Also, for elder people, it is very hard to accept that they are losing some of their abilities, or fear that they could need help from their children, with the possibility of not explaining exactly how they feel or what they need. A tool that can read their emotion from deep side of their mind could help the humanity to save lots of lives, and also help the people help to be more happy.
The researchers have worked on different methods such as heart rate, skin conductance [13], facial expression, speech and intonation and electrodermal response [2] to retrieve the emotion of a human. All these methods are trying to recognize the emotion from the effect of the emotion on the body, for example, facial expression tries to extract the emotion from the expression of the face, or heart rate wants to retrieve the emotion from changes of heart beats. Of course, the emotion could effect on our body, a human could understand the emotional state of people by looking to their face, observing their body language or their talking speed and their intonation but the problem is that the emotion is not the only thing that effect on our body. Sometimes sickness like, blood presser or high heart beat could effect on the heart rate. A system based on speech and intonation system could not recognize the emotion of people who have asthma or person who has tongue tie problem. Another problem of these systems is there are not
very precise; they could not separate the similar emotions such as Bored and Hesitant or Astonished and Aroused. But maybe the bigger problem is that people could hide or pretend their emotion by practice, and there are some cultures that teach to their people not to show their happiness or sadness very clear.
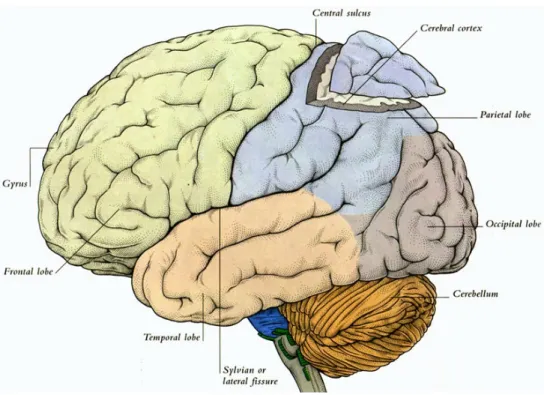
The recent research shows that the emotion could be retrieved from brain signal [2,13]. But the problem of extracting the emotion from the brain is that the brain has a very complex biological system [12]. We do not have access to all the parts of the brain; we can just retrieve the signal of the cortex of the brain, that means we do not have access to major parts of the brain. Figure 1 shows the cortex with a cut on the brain.
Figure 1. The brain parts - Cortex of the brain [27]
Another difficulty of retrieving data from brain signals is that the brain is controlling all the parts of body non-stop. What human can see, hear, sense, dream, the hormones and anything that we could imagine is governed by the brain. If we assume that there is no noise or failure in signals, there is still a huge amount of data that we do not need to extract.
3.2 Methodology
In this research, we chose the signal brain to extract the emotion, because of its accuracy. The purpose is to recognize the emotion and monitor it, then we use the two dimensions circumplex space model (fig. 2), to extract and monitor the emotions [3]. In this diagram, we could map the emotions to one 2D diagram with the axis of Arousal and Valence. By retrieving the arousal and valence from brain signals, we can find a precise emotion of the human.
Figure 2. Two-dimension Circumplex space model [26,28-30].
Also, we can see the emotional evolution on the diagram which could help us to study the changes of emotion of people in a time series that shows the reaction of a person to an emotional factor around him/her.
3.2.1 Arousal and valence
The valence shows the quality of the emotion in a range from unpleasant to pleasant, while the arousal shows the quantitative activation in a range from not aroused to excited [3]. We could calculate the arousal and valence by comparing the brain activities in different parts. The high activation of 𝛼𝛼 waves in frontal part of brain and high activation of 𝛽𝛽 waves in right part of brain is correlated to positive emotion. High 𝛽𝛽 waves activity in partial lob when 𝛼𝛼 waves activities is low while the influence of 𝛽𝛽/ 𝛼𝛼 in frontal lobe is increasing at the same time when 𝛽𝛽 waves activities in partial lop is increasing is related to higher arousal [31-33]. Then we use this pattern to calculate the amount of arousal and the value of the valence.
3.2.2 Hardware
Emotion recognition is based on brain signal which is still a new method in research. We organized an experiment where we could gather labeled data with the element that we needed (the experiment will be explained in detail in the following). In the experiment, we have used Emotiv EPOC as a low-cost EEG headset and Google card board Virtual Reality (VR).
3.2.2.1 Emotiv
Emotiv EPOC is a low-cost commercial EEG device [7] with 14 channel wireless EEG. It is not heavy and easily installable. This device returns the value of five principal frequency bands which are
• Delta (0 – 4 Hz) • Theta (3 – 7 Hz) • Alpha (8 – 12 Hz) • Beta (13 – 30 Hz) • Gamma (30 – 40 Hz)
Figure 3. Emotimap EPOC
The sensors of the device need to be wet and then it should be put on the head in appropriate place, and the dongle of the device that should be connected to the computer. Figure 4 shows the place of the sensors based on international EEG positions.
Figure 4. The position of sensors on Emotiv Epoc, Based on international EEG position
3.2.2.2 VR
In the experiment, we isolated the participant and put him in a calm situation. We controlled what he sees by VR (when he wears a VR he could not see but what is shown is the VR and we controlled it) and controlled what he hears by a hand free (he was in a calm room
and hands free was under control). For the VR, we used one Google cardboard virtual reality which is a cheap, light and easy to use the device. This device uses a cell phone to show the ambiance and has no limitation for the model of the cell phone. Figure 5 shows the image of the VR headset.
Figure 5. Google Cardboard VR headset
3.2.3 Formulas
Researches use different formulas and one of our goals was to find the best formulas which make us independent of the hardware. We chose some of the formulas depending on a variety of place of the sensors on the head, and kept the result of all of them to compare them at the end. The headset that we used (Emotiv, explained in section 3.2.2.1) has ability to return the ℎ𝑖𝑖𝑖𝑖ℎ β as well as the 𝛽𝛽𝛽𝛽𝛽𝛽 𝛽𝛽 then we calculated all the formulas with 𝛽𝛽, 𝛽𝛽ℎ𝑖𝑖𝑖𝑖ℎ and 𝛽𝛽𝑙𝑙𝑙𝑙𝑙𝑙. The 𝛽𝛽 wave could be divided into three sub waves including 𝛽𝛽𝑙𝑙𝑙𝑙𝑙𝑙, 𝛽𝛽 and 𝛽𝛽ℎ𝑖𝑖𝑖𝑖ℎ. The formulas are named based on the number of sensors which are engaged for calculating the result. For example, arousal 2𝑆𝑆𝑙𝑙𝑙𝑙𝑙𝑙 refer to the formula which calculates arousal using data of two sensors (𝐹𝐹3 and 𝐹𝐹4) and using waves 𝛼𝛼 and 𝜷𝜷𝑳𝑳𝑳𝑳𝑳𝑳.
Researchers used different formulas to measure the arousal and valence and published their researches in papers [31,34]. We gathered the formulas that have good results, and we used a formula that used all the sensors all over the head. The reason was that the hardware and the method we used was not the same as them, so we wanted to observe the formulas with our method.
3.2.3.1 Formulas using two sensors
In this formula, we used the data extracted from the 𝐹𝐹3 and 𝐹𝐹4 to calculate the arousal and valence, from now we mention the formulas with two sensors with 2S (formula 1 to formula 6). The standard and place of the sensors is explained in section 3.2.2. on Emotiv [31,34] and particularly in figure 4. 𝐴𝐴𝐴𝐴𝛽𝛽𝐴𝐴𝐴𝐴𝐴𝐴𝛽𝛽2𝑠𝑠= 𝛽𝛽𝐹𝐹𝛼𝛼𝐹𝐹3+ 𝛽𝛽𝐹𝐹4 3+ 𝛼𝛼𝐹𝐹4 (1) 𝐴𝐴𝐴𝐴𝛽𝛽𝐴𝐴𝐴𝐴𝐴𝐴𝛽𝛽2𝑠𝑠−𝐻𝐻= 𝛽𝛽𝛼𝛼𝐹𝐹ℎ𝐹𝐹3+ 𝛽𝛽ℎ𝐹𝐹4 3+ 𝛼𝛼𝐹𝐹4 (2) 𝐴𝐴𝐴𝐴𝛽𝛽𝐴𝐴𝐴𝐴𝐴𝐴𝛽𝛽2𝑠𝑠−𝐿𝐿 = 𝛽𝛽𝛼𝛼𝐹𝐹𝑙𝑙𝐹𝐹3+ 𝛽𝛽𝑙𝑙𝐹𝐹4 3+ 𝛼𝛼𝐹𝐹4 (3) 𝑉𝑉𝐴𝐴𝛽𝛽𝑉𝑉𝑉𝑉𝑉𝑉𝑉𝑉2𝑠𝑠 =𝛽𝛽𝐹𝐹𝛼𝛼𝐹𝐹4 4− 𝛽𝛽𝐹𝐹3 𝛼𝛼𝐹𝐹3 (4) 𝑉𝑉𝐴𝐴𝛽𝛽𝑉𝑉𝑉𝑉𝑉𝑉𝑉𝑉2𝑠𝑠−𝐻𝐻 =𝛽𝛽𝛼𝛼𝐹𝐹ℎ𝐹𝐹4 4 − 𝛽𝛽ℎ𝐹𝐹3 𝛼𝛼𝐹𝐹3 (5) 𝑉𝑉𝐴𝐴𝛽𝛽𝑉𝑉𝑉𝑉𝑉𝑉𝑉𝑉2𝑠𝑠−𝐿𝐿 =𝛽𝛽𝛼𝛼𝐹𝐹𝑙𝑙𝐹𝐹4 4 − 𝛽𝛽𝑙𝑙𝐹𝐹3 𝛼𝛼𝐹𝐹3 (6)
3.2.3.2 Formulas using four sensors
In this formula, we used the data extracted from 𝐹𝐹3, 𝐹𝐹4, 𝐴𝐴𝐹𝐹3 and 𝐴𝐴𝐹𝐹4 to calculate the arousal and valence (formula 7 to formula 12), these formulas use the frontal part of the brain to calculate the arousal and valence. The formulas with four sensors will be mentioned by 4S [31,34].
𝐴𝐴𝐴𝐴𝛽𝛽𝐴𝐴𝐴𝐴𝐴𝐴𝛽𝛽4𝑠𝑠 =𝛽𝛽𝐹𝐹𝛼𝛼𝐹𝐹3 + 𝛽𝛽𝐹𝐹4+ 𝛽𝛽𝐴𝐴𝐹𝐹3+ 𝛽𝛽𝐴𝐴𝐹𝐹4
3+ 𝛼𝛼𝐹𝐹4+ 𝛼𝛼𝐴𝐴𝐹𝐹3+ 𝛼𝛼𝐴𝐴𝐹𝐹4 (7) 𝐴𝐴𝐴𝐴𝛽𝛽𝐴𝐴𝐴𝐴𝐴𝐴𝛽𝛽4𝑠𝑠−𝐻𝐻 =𝛽𝛽ℎ𝛼𝛼𝐹𝐹𝐹𝐹3+ 𝛽𝛽ℎ𝐹𝐹4 + 𝛽𝛽ℎ𝐴𝐴𝐹𝐹3+ 𝛽𝛽ℎ𝐴𝐴𝐹𝐹4
𝐴𝐴𝐴𝐴𝛽𝛽𝐴𝐴𝐴𝐴𝐴𝐴𝛽𝛽4𝑠𝑠−𝐿𝐿 =𝛽𝛽𝛼𝛼𝐹𝐹𝑙𝑙𝐹𝐹3+ 𝛽𝛽𝑙𝑙𝐹𝐹4+ 𝛽𝛽𝑙𝑙𝐴𝐴𝐹𝐹3+ 𝛽𝛽𝑙𝑙𝐴𝐴𝐹𝐹4 3+ 𝛼𝛼𝐹𝐹4+ 𝛼𝛼𝐴𝐴𝐹𝐹3+ 𝛼𝛼𝐴𝐴𝐹𝐹4 (9) 𝑉𝑉𝐴𝐴𝛽𝛽𝑉𝑉𝑉𝑉𝑉𝑉𝑉𝑉4𝑠𝑠= 𝛽𝛽𝐹𝐹𝛼𝛼𝐹𝐹4+ 𝛽𝛽𝐴𝐴𝐹𝐹4 4+ 𝛼𝛼𝐴𝐴𝐹𝐹4− 𝛽𝛽𝐹𝐹3+ 𝛽𝛽𝐴𝐴𝐹𝐹3 𝛼𝛼𝐹𝐹3+ 𝛼𝛼𝐴𝐴𝐹𝐹3 (10) 𝑉𝑉𝐴𝐴𝛽𝛽𝑉𝑉𝑉𝑉𝑉𝑉𝑉𝑉4𝑠𝑠−𝐻𝐻 = 𝛽𝛽𝛼𝛼𝐹𝐹ℎ𝐹𝐹4+ 𝛽𝛽ℎ𝐴𝐴𝐹𝐹4 4+ 𝛼𝛼𝐴𝐴𝐹𝐹4 − 𝛽𝛽ℎ𝐹𝐹3+ 𝛽𝛽ℎ𝐴𝐴𝐹𝐹3 𝛼𝛼𝐹𝐹3+ 𝛼𝛼𝐴𝐴𝐹𝐹3 (11) 𝑉𝑉𝐴𝐴𝛽𝛽𝑉𝑉𝑉𝑉𝑉𝑉𝑉𝑉4𝑠𝑠−𝐿𝐿 =𝛽𝛽𝑙𝑙𝑙𝑙𝑙𝑙𝛼𝛼𝐹𝐹𝐹𝐹4+ 𝛽𝛽𝑙𝑙𝑙𝑙𝑙𝑙𝐴𝐴𝐹𝐹4 4+ 𝛼𝛼𝐴𝐴𝐹𝐹4 − 𝛽𝛽𝑙𝑙𝑙𝑙𝑙𝑙𝐹𝐹3+ 𝛽𝛽𝑙𝑙𝑙𝑙𝑙𝑙𝐴𝐴𝐹𝐹3 𝛼𝛼𝐹𝐹3+ 𝛼𝛼𝐴𝐴𝐹𝐹3 (12)
3.2.3.3 Formulas using twelve sensors
In this formula, we used the data from 𝐹𝐹3, 𝐹𝐹4, 𝐴𝐴𝐹𝐹3, 𝐴𝐴𝐹𝐹4, 𝐹𝐹7, 𝐹𝐹8, 𝑇𝑇7, 𝑇𝑇8, 𝑃𝑃7, 𝑃𝑃8, 𝑂𝑂1 and 𝑂𝑂2 to calculate the formulas (formula 13 to formula 18) which cover the entire head. The formulas that used twelve sensors were mentioned by 12S [31,34].
𝐴𝐴𝐴𝐴𝛽𝛽𝐴𝐴𝐴𝐴𝐴𝐴𝛽𝛽12𝑠𝑠 = (𝛽𝛽𝐹𝐹3+ 𝛽𝛽𝐹𝐹4+ 𝛽𝛽𝐴𝐴𝐹𝐹3 + 𝛽𝛽𝐴𝐴𝐹𝐹4+ 𝛽𝛽𝐹𝐹7+ 𝛽𝛽𝐹𝐹8+ 𝛽𝛽𝑇𝑇7+ 𝛽𝛽𝑇𝑇8 + 𝛽𝛽𝑃𝑃7 + 𝛽𝛽𝑃𝑃8+ 𝛽𝛽𝑂𝑂1+ 𝛽𝛽𝑂𝑂2)/(𝛼𝛼𝐹𝐹3 + 𝛼𝛼𝐹𝐹4+ 𝛼𝛼𝐴𝐴𝐹𝐹3+ 𝛼𝛼𝐴𝐴𝐹𝐹4+ 𝛼𝛼𝐹𝐹7+ 𝛼𝛼𝐹𝐹8 + 𝛼𝛼𝑇𝑇7+ 𝛼𝛼𝑇𝑇8+ 𝛼𝛼𝑃𝑃7+ 𝛼𝛼𝑃𝑃8+ 𝛼𝛼𝑂𝑂1+ 𝛼𝛼𝑂𝑂2) (13) 𝐴𝐴𝐴𝐴𝛽𝛽𝐴𝐴𝐴𝐴𝐴𝐴𝛽𝛽12𝑠𝑠−𝐻𝐻 = (𝛽𝛽ℎ𝐹𝐹3+ 𝛽𝛽ℎ𝐹𝐹4+ 𝛽𝛽ℎ𝐴𝐴𝐹𝐹3+ 𝛽𝛽ℎ𝐴𝐴𝐹𝐹4 + 𝛽𝛽ℎ𝐹𝐹7+ 𝛽𝛽ℎ𝐹𝐹8+ 𝛽𝛽ℎ𝑇𝑇7+ 𝛽𝛽ℎ𝑇𝑇8 + 𝛽𝛽ℎ𝑃𝑃7 + 𝛽𝛽ℎ𝑃𝑃8+ 𝛽𝛽ℎ𝑂𝑂1+ 𝛽𝛽ℎ𝑂𝑂2)/(𝛼𝛼𝐹𝐹3+ 𝛼𝛼𝐹𝐹4 + 𝛼𝛼𝐴𝐴𝐹𝐹3+ 𝛼𝛼𝐴𝐴𝐹𝐹4+ 𝛼𝛼𝐹𝐹7 + 𝛼𝛼𝐹𝐹8+ 𝛼𝛼𝑇𝑇7+ 𝛼𝛼𝑇𝑇8+ 𝛼𝛼𝑃𝑃7+ 𝛼𝛼𝑃𝑃8 + 𝛼𝛼𝑂𝑂1+ 𝛼𝛼𝑂𝑂2) (14) 𝐴𝐴𝐴𝐴𝛽𝛽𝐴𝐴𝐴𝐴𝐴𝐴𝛽𝛽12𝑠𝑠−𝐿𝐿 = (𝛽𝛽𝑙𝑙𝐹𝐹3+ 𝛽𝛽𝑙𝑙𝐹𝐹4+ 𝛽𝛽𝑙𝑙𝐴𝐴𝐹𝐹3+ 𝛽𝛽𝑙𝑙𝐴𝐴𝐹𝐹4+ 𝛽𝛽𝑙𝑙𝐹𝐹7+ 𝛽𝛽𝑙𝑙𝐹𝐹8+ 𝛽𝛽𝑙𝑙𝑇𝑇7+ 𝛽𝛽𝑙𝑙𝑇𝑇8 + 𝛽𝛽𝑙𝑙𝑃𝑃7+ 𝛽𝛽𝑙𝑙𝑃𝑃8+ 𝛽𝛽𝑙𝑙𝑂𝑂1+ 𝛽𝛽𝑙𝑙𝑂𝑂2)/(𝛼𝛼𝐹𝐹3+ 𝛼𝛼𝐹𝐹4+ 𝛼𝛼𝐴𝐴𝐹𝐹3+ 𝛼𝛼𝐴𝐴𝐹𝐹4+ 𝛼𝛼𝐹𝐹7 + 𝛼𝛼𝐹𝐹8 + 𝛼𝛼𝑇𝑇7+ 𝛼𝛼𝑇𝑇8+ 𝛼𝛼𝑃𝑃7+ 𝛼𝛼𝑃𝑃8+ 𝛼𝛼𝑂𝑂1+ 𝛼𝛼𝑂𝑂2) (15) 𝑉𝑉𝐴𝐴𝛽𝛽𝑉𝑉𝑉𝑉𝑉𝑉𝑉𝑉12𝑠𝑠 = (𝛽𝛽𝐹𝐹4+ 𝛽𝛽𝐴𝐴𝐹𝐹4+ 𝛽𝛽𝐹𝐹8+ 𝛽𝛽𝑇𝑇8+ 𝛽𝛽𝑃𝑃8+ 𝛽𝛽𝑂𝑂2)/(𝛼𝛼𝐹𝐹4+ 𝛼𝛼𝐴𝐴𝐹𝐹4 + 𝛼𝛼𝐹𝐹8 + 𝛼𝛼𝑇𝑇8+ 𝛼𝛼𝑃𝑃8+ 𝛼𝛼𝑂𝑂2) − (𝛽𝛽𝐹𝐹3+ 𝛽𝛽𝐴𝐴𝐹𝐹3+ 𝛽𝛽𝐹𝐹7+ 𝛽𝛽𝑇𝑇7+ 𝛽𝛽𝑃𝑃7 + 𝛽𝛽𝑂𝑂1)/(𝛼𝛼𝐹𝐹3+ 𝛼𝛼𝐴𝐴𝐹𝐹3+ 𝛼𝛼𝐹𝐹7+ 𝛼𝛼𝑇𝑇7+ 𝛼𝛼𝑃𝑃7+ 𝛼𝛼𝑂𝑂1 ) (16) 𝑉𝑉𝐴𝐴𝛽𝛽𝑉𝑉𝑉𝑉𝑉𝑉𝑉𝑉12𝑠𝑠−𝐻𝐻 = (𝛽𝛽ℎ𝐹𝐹4+ 𝛽𝛽ℎ𝐴𝐴𝐹𝐹4+ 𝛽𝛽ℎ𝐹𝐹8+ 𝛽𝛽ℎ𝑇𝑇8+ 𝛽𝛽ℎ𝑃𝑃8+ 𝛽𝛽ℎ𝑂𝑂2)/(𝛼𝛼𝐹𝐹4+ 𝛼𝛼𝐴𝐴𝐹𝐹4 + 𝛼𝛼𝐹𝐹8+ 𝛼𝛼𝑇𝑇8+ 𝛼𝛼𝑃𝑃8+ 𝛼𝛼𝑂𝑂2) − (𝛽𝛽ℎ𝐹𝐹3+ 𝛽𝛽ℎ𝐴𝐴𝐹𝐹3+ 𝛽𝛽ℎ𝐹𝐹7+ 𝛽𝛽ℎ𝑇𝑇7 + 𝛽𝛽ℎ𝑃𝑃7+ 𝛽𝛽ℎ𝑂𝑂1)/(𝛼𝛼𝐹𝐹3 + 𝛼𝛼𝐴𝐴𝐹𝐹3+ 𝛼𝛼𝐹𝐹7+ 𝛼𝛼𝑇𝑇7+ 𝛼𝛼𝑃𝑃7+ 𝛼𝛼𝑂𝑂1 ) (17)
𝑉𝑉𝐴𝐴𝛽𝛽𝑉𝑉𝑉𝑉𝑉𝑉𝑉𝑉12𝑠𝑠−𝐿𝐿 = (𝛽𝛽𝑙𝑙𝐹𝐹4+ 𝛽𝛽𝑙𝑙𝐴𝐴𝐹𝐹4+ 𝛽𝛽𝑙𝑙𝐹𝐹8+ 𝛽𝛽𝑙𝑙𝑇𝑇8+ 𝛽𝛽𝑙𝑙𝑃𝑃8+ 𝛽𝛽𝑙𝑙𝑂𝑂2)/(𝛼𝛼𝐹𝐹4+ 𝛼𝛼𝐴𝐴𝐹𝐹4+ 𝛼𝛼𝐹𝐹8 + 𝛼𝛼𝑇𝑇8+ 𝛼𝛼𝑃𝑃8 + 𝛼𝛼𝑂𝑂2) − (𝛽𝛽𝑙𝑙𝐹𝐹3+ 𝛽𝛽𝑙𝑙𝐴𝐴𝐹𝐹3+ 𝛽𝛽𝑙𝑙𝐹𝐹7+ 𝛽𝛽𝑙𝑙𝑇𝑇7+ 𝛽𝛽𝑙𝑙𝑃𝑃7
+ 𝛽𝛽𝑙𝑙𝑂𝑂1)/(𝛼𝛼𝐹𝐹3+ 𝛼𝛼𝐴𝐴𝐹𝐹3+ 𝛼𝛼𝐹𝐹7+ 𝛼𝛼𝑇𝑇7 + 𝛼𝛼𝑃𝑃7 + 𝛼𝛼𝑂𝑂1 )
(18)
3.3 Emotimap
For this research, we created a method that uses the brain EEG data as input and retrieves the emotions by comparing the power of the activities of different waves in different parts of the brain. Then we created a tool that shows the retrieved results of the method. This tool is called Emotimap. In summary, Emotimap is a tool that gets EEG data and
1- extracts the current emotion at the time, 2- extracts the general emotion,
3- monitors the emotional evolution of a person on two dimensions: arousal-valence diagram,
Emotimap works online when connected to the headset and receives the EEG data, Also, it can show the results multiple times as they are saved, to help the users to be able to restudy and precise in details of result, after experiment.
3.3.1 Methodology
Emotimap connects to the headset, receives the raw data and extracts the arousal and valence (the formulas explained in 3.2.3 formulas, calculate the arousal and valence). Raw data is the value of 𝛼𝛼, 𝛽𝛽, 𝛾𝛾 and 𝜃𝜃 at the time. In the experiment, one goal was to find the best and the most functional formula, so Emotimap calculates and keeps all the formulas.
The reaction of different people to one single emotional factor is different, and we see it in normal life every day. One love story movie makes some people cry, some others just sad and they are some people who makes jokes of that movie, and for people with similar emotion the amount of the emotion (arousal and valence) is totally different. That is why we needed to train our system for everybody separately; I call it pre-training. After pre-training, Emotimap
found minimum and maximum of the values and based on that limitation, Emotimap calculates the percentage of the arousal and valence. The values of minimum and maximum is based on the power of brain activities of person which is different person by person. To resume, Emotimap maps the values of the arousal and valence into a new limitation between -100 and 100 (figure 6).
Figure 6. Limitation mapping
For pre-training, we need to put the participant in a situation that makes him/her very emotional, positively and negatively. But as we explained, people get emotional in a different way, and we could not guaranty that we could find the exact minimum and maximum of arousal and valence of people in pre-training. Emotimap is capable to update the range of minimum and maximum and with no interruption continues the operation with new minimum and maximum, if occasionally Emotimap receives data out of range.
We are using a hardware that uses low voltage of electricity then it is possible sometimes to have some noise effect on our values. Emotimap calculates a very big or very small value for arousal or valence that do not repeat very much, Emotimap will take it as noise and removes it from the result. As Emotimap is learning all the time after a while, the result of Emotimap are more precise.
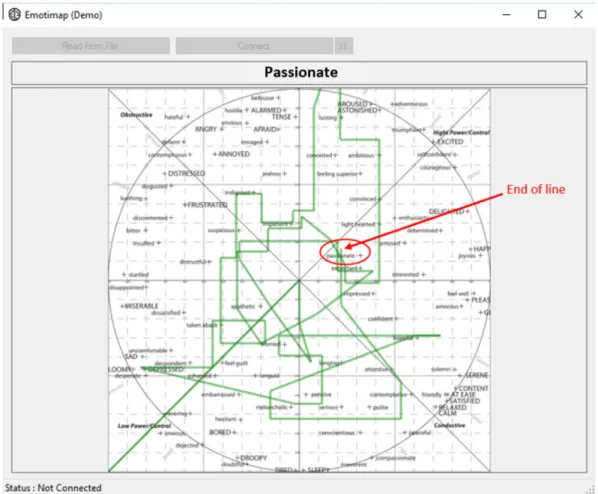
Emotimap shows the emotional evolution, of the participant. This diagram helps us to study the reaction of people to the different emotional factors multiple times. Figure 7 illustrates Emotimap tool which is showing the emotional reactions of one participant off-line.
It allows two options. Firstly, we can connect to the headset and show the emotional reaction of participant online (and save the data in a file) and secondly, we can choose the saved data file to observe the emotional reactions multiple times. Inside the status bar we can see if Emotimap is connected to the headset. Top side of the diagram shows the current emotion as well as the body of the diagram shows the emotional evolution of participant.
Figure 7. Emotimap shows emotional evolution off-line
Emotimap also recognizes the emotion of participant on real time; this emotion is the nearest emotion on diagram around the end of the line in the diagram, for example, in figure 7, the end of the green line is around passionant which is the last emotion detected in emotional evolution and this emotion is mentioned on top of diagram. Everybody could feel multiple emotion in facing with an emotional factor, so the emotion shown in the diagram is the most powerful emotion felt by the participant. For example, when friends panic somebody, the person is scared and excited and happy (as soon as he/she understand it is a joke), there is no border between these emotions, sometimes human experiment different emotions, possibly in the opposite of each other, at the same time. Some of these emotions are stronger than others, Emotimap takes the strongest emotion.
Two emotionally similar people at the same time, facing with similar emotional factor could have different numbers of 𝛼𝛼, 𝛽𝛽, 𝛾𝛾 and 𝜃𝜃 waves. One important point is that our emotion is
the result of the emotional factor we are faced, with all our memories even what we do not remember, culture and personal experiences of people. The personal part is very strong part of the parameters (figure 8), even one person could feel different, in different time again faced to the same emotional factor.
Figure 8. Effect of the memory on the emotional state of person [35]
On the other hand, every person has a feeling that engages him for a longer time; it could be a couple of hours or maybe some months, we called it “general emotion”. For example, one person who is depressed feels depressed generally, but he/she could smile, get angry or scare and these feelings are a current emotion, but behind these emotions, he/she is depressed. Technically it is the most stable recognized emotions when he/she is not in the emotional pick. Emotimap could recognize the general emotion too.
3.3.2 Raw data problematic
Raw data of the EEG headset are the value of the waves 𝛼𝛼, 𝛽𝛽, 𝛾𝛾 and 𝜃𝜃 which are a decimal number. The brain is controlling any organ inside the body, hearth rate, any movement of hands and feet, mind, thought, imagination and the emotions. The data we extracted from EEG waves is a mix of some parts of these data and probably some noises. Then the result is one series of numbers that change very fast and do not follow any pattern. Some of these changes are very sharp and, some others are very small, like a small shaking of value. But what we need is a stable series of numbers that shows the sharp changes and shows the smoothness diagram, when the feeling of participant is stable.
To do that, in every level we created a list of values and the number of repetitions of every value; then we ignored the values with less than 10 percent of repeatation and our method will use the rest of values to find the minimum and maximum. At the beginning, Emotimap waits until gathering enough data to calculate the minimum and maximum, that request 100
rows of values in this case. Another important point is emotimap does not delete anything, then as Emotimap takes more data some of them that was ignored could be considered again or the opposite.
After then the diagram shows small shakes and sharp changes that are not stable, to ignore that unnecessary changes we filtered data, two times.
3.3.3 Filters
3.3.3.1 Smoother
To avoid the small shakes that do not change the extracted feeling, but make the diagram noisy and unreadable, we ignored theses shaking, and every two points next to each other that are very near will get the value of the first point, the value of this hyper parameter in the experiment is 40 (figure 9). This filter will show the real changes in small scale.
Figure 9. The effect of smoother on raw data, in the value-time diagram. Blue line is raw data, and orange line shows smoothed values
3.3.3.2 Jump Remover
To avoid the feels that passed very fast, which is probably noise, we reduced the data that show very fast and sharp changes that are not stable. It is necessary to pay attention that small changes in values of arousal and valence do not make a change to the recognized emotion. The reason is simple, we used the nearest neighbor method to find emotions and in this method
all points go to the group of the nearest labeled point which means that the points inside the area around labeled point are in the same group, then small changes in arousal and valence do not make any change to the recognized emotion.
At first step, we needed to know when changes in values of arousal and valence will make a change in recognized emotion, then we defined a hyperparameter that kept the minimum distance between every two values (every change more than that could change the recognized emotion). If two sequenced values have a distance more than this hyperparameter we call this part of sequence break point and we will go to the next step.
In second step, we wanted to know if the change that just happened is stable, on the other hand, does it continue for a while? We defined a minimum of times of repetition that shows the stability as second hyperparameter. If the changes could not reach the minimum of repetition the change is not stable and all the values after the last break point will change to the last value before break point. In the experiment, the hyperparameters are valued 5 and 10 in order (figure 10).
Figure 10. The effect of jump-remover on smoothed data, in the value-time diagram. Blue line is raw data, orange line shows smoothed values, and red line shows the final value
3.4 Experiment
The goal of the experiment is to put the participants in a series of emotional states and extract their emotion using EEG. Emotional states are created in a virtual reality environment by four different emotional factors (Music, 360 degrees films, Images, and text) as explained
above. We had 20 participants, half male and half female in a range of age between 22 and 39 (mean = 30.95 and SD = 5.01), all of them were resident of Montreal with university education degree and from four different origins.
The experiment was situated in an isolated and calm room. Participants worn the VR head set and hands-free. At first, they watched 2 minutes and 16 seconds 360 degrees film, in three parts. The first part is an horror movie, the second part is the view of a firefighters in middle of a house on fire, and finally the last part is a view of passenger of a roller coaster and all these scenes are full of scare and excitatons. One scene of a building in fire is showed in figure 11. In this part, Emotimap is gathering enough data to pre-train the participant data. You can find the protocol of the experiment in appendix 3.
Figure 11. A scene of pre training 360 degrees movie
After that, in a loop, they saw one image that makes them feel negative, and after that, they saw the positive image, 360 degrees film, text or hear music until the end. Between every positive and negative emotional factor, there is a 6th-second rest which is a black scene in silence. The experiment took almost 40 minutes for every participant including filling pre-experiment form and post pre-experiment form. The steps of the pre-experiment are illustrated in figure 12.
Figure 12. Steps of experiment
3.4.1 Software
For this experiment, we have designed and developed two software. One virtual reality application that we created in Unity, able to show the images, 360 degrees film, text and play music. Another software is a control panel, created in C#, connected via a network to the VR and controlling what to show or play, and showing the examiner the participant’s emotional state and emotional evolution and emotional factor. The control panel connects to the EEG headset, gathers and saves the data in a file format database (figure 13).
Figure 13. Relation and correlation between the software and hardware of experiment
Inside the control panel, on the top side, we could see the information on the participant and his chosen language, connectivity status and battery level of headset.
The body of the control panel is divided into three parts. Left part is the diagram of Emotimap, where we can see the emotional evolution of participant that is shown in a two dimensions diagram of arousal and valence. Also, we can see the emotional state of participant in the diagram, but to make it easy for user to follow the emotional state we show it on top side
fill the pre-experiment
form
participate in experiment
fill the post experiment
form
talk about their emotion
of the diagram for example impatient on figure 14. In the middle, there is a list of emotional factors that is sent or is going to be sent to the VR, this list lets the user know how many emotional factors is sent to the participant and how long it will take to end of the experiment.
On the right side, the examiner can see the image and text that participants see, also, in the list, the examiner can see the last emotional factor sent to the participant (figure 14).
3.4.2 Pre-experiment forms
Before the experiment, we explained the steps of the experiment to the participant and they were aware that they are going to see unpleasant images and anytime they could quit the experiment, but if they finish the experiment they will be paid 20$. Then they read and sign a consent form; you can find this form in appendix one.
Then they filled up the personality test of the big 5; this test determines the characteristics of people into five categories [36]. These categories are
• Extraversion • Agreeableness
Figure 14. Control panel
• Conscientiousness • Neuroticism • Openness
In Big 5, one question is asked more than one time in using different words or sometime in positive structure and negative structure, then the result of the test is reliable.
We used this test to be able to compare the reaction of the participants when they have similar characteristics. You can find this form in appendix two.
3.4.3 Post-experiment form
After the experiment, participant fills another form where they were asked which emotional factor engaged them more and if they scare of any environment that they have found themselves in the 360 degrees films, to find the reason of the reaction. You can find this form in appendix four.
3.4.4 After experiment conversation
When we were examining the participant, we observed they face and body reaction to the emotional factor that was in the control panel and their emotion detected by Emotimap. When we saw a strange reaction to an emotional factor, we kept it, and after the experiment, we talked to them about their emotion. First, we asked them why they felt like that, and always they had a logic explanation. For example, when one participant was sad as she was watching a very nice and lovely view (illustrated in figure 15), she explained that she knew it is an outstanding landscape, but she had bad memory in a very similar place.
In the middle of the experiment, we saw one or two emotions very repeatedly. When the participant was not on the emotional pick, he/she felt the same emotion. After the experiment we asked them, why they felt like that? They were surprised and certified that we efficiently recognized their mood. We called this general emotion. General emotion is the emotion everybody has in the background of his/her mind, the feeling of a person when he/she is not in the emotional pick. When a person is engaged very hard to a general emotion, he/she does not react to the emotional factor, like a sad person in a party who stay in the corner and does not
participate in the party, or the period that he/she gives attention to the emotional factor is very short, and he/she start feeling like before very fast. We could see clearly these emotions in the Emotimap.
4 Results
In the experiment, we have used two groups of emotional factors: negative emotional factor and positive emotional factor in order to make the participant feels bad and good. The emotional factors are four types, images, text, 360 degrees film and music. All the negative emotional factors are based on an image, and positive emotional factor could be any of four different emotional factor types.
We tried to respect the variety of parameters in choosing different emotional factors. For example the 360 degrees films are in different scenes, the color of the scene is different (when two films are from the sea, one of them is under water and is blue, another one is in sea side, and color is khaki).
4.1 Method of assigning emotions to emotional factors
After the experiment, we had the emotional factor and the emotions that participants felt when they were under effect of that emotional factor. All the participants did not exactly felt the same emotions, some part of emotion is common but there were different emotions from person to person. This difference could be because of the noise or it is a real emotion that one person had. We tried to limit the emotions of every emotional factor to the strongest emotions that participant felt as the emotions expected to be created by the special emotional factor.
To do this, in step one, we made a list of all the emotions felt by all the participant for every emotional factor. Then in step two, we created a list of emotions and the number of repetition of emotions in the list sorted by descending order. In step three, we calculated the accumulative sum and the percentage of repetitions (figure 16).
Finally, all the emotions with the value of accumulative repetitions, less than 80%, (or if there were no emotion with that value then the first emotion in the list) are assigned to the emotional factor as the emotions expected to be created by that emotional factor. Table 1 illustrates a real example, the repetition of tired and sleepy in order with 9 and 5 counts in comparing with apathetic with 888 number of repetitions is not valuable. Column assigned shows the emotions that are assigned to the emotional factor with a tick sign, and the other emotions are shown with cross sign.
Table 1. List of emotions created by an emotional factor and emotions assigned to emotional factor
Accumulative
Repetition Accumulative repetition Percentage of assigned
apathetic 888 13.04% ✓ worried 634 22.35% ✓ embarrassed 555 30.50% ✓ distrustful 508 37.96% ✓ longing 406 43.92% ✓ discontent 294 48.24% ✓ pensive 253 51.95% ✓ ⋮ ⋮ ⋮ ⋮ happy 33 99.38% ✗ relaxed 15 99.60% ✗ satisfied 13 99.79% ✗ tired 9 99.93% ✗ sleepy 5 100% ✗
In the following diagram (figure 17), we can see the rate of repetitions of emotions created by one emotional factor. The separator (green dotted line) shows the emotions which are assigned to the emtional factor when the percentage of accumulative repetition is less than 80%. Blue bars show the repetition of emotions in the list and orange curve shows the accumulative repetition of emotions in the list.
Figure 17. The emotions created by one emotional factor and its accumulative repetition of emotions with their percentage
4.2 Effect of emotional factor
At first, we wanted to know if there are common behavior in reactions to one single emotional factor. So, we extracted the emotion that every participant felt when there were under the effect of the emotional factor and the effective emotion of the participant (with the same method that we assigned the effective emotions to emotional factor, that is making a list of emotions and the number of repetitions of emotions, then creating a list of emotions and percentage of accumulative sum of repetitions of emotions and taking the emotions with percentage less than 80%). We compared these emotions with the emotions assigned to emotional factor to calculate the error rate. We calculated the error rate according three ways.
The first method represents the percentage of emotions assigned to emotional factor that the participant did not feel. In figure 18, we colored it in blue and called it B series. The second method illustrates the percentage of emotions of the participant when he was under the effect of the emotional factor, but these emotions were not assigned to emotional factor, which is shown in orange and called O series. The last method counts the top 80 percent of emotions of the participant when he/she was under the effect of the emotional factor, when these emotions were
not in the list of emotions of emotional factor. This method is just like O series, but we calculate the top 80 percent of the emotions of participant. This method is shown in green and called G series.
According to figure 18, rate error when we count all emotions of the participant is high (blue and orange), the reason is that always people have different emotions, but in the emotional picks, they feel somehow similar emotions.
Figure 18. Error rate between emotions that emotional factor created and what participant felt Table 2 shows the average of error and metric distance of these three methods, as it is mentioned in comparing B, O and G series, an average of error from 46.49% felt down to 19.93 % and then to the 6.32 % which is a good result. The last column shows the metric distance of G series; this parameter shows the distance between the arousal and valence of emotion expected by the emotional factor and what the participant felt. Measuring this distance helps us to know even when the emotions are not the same if the participant emotion was similar, or how near is it to the arousal and valence on the 2D diagram. The result shows that the average of metric distance is 8.63 % and SD is 8.11, these numbers say that normally, emotion expected from emotion felt, is not at all far, participant felt some emotion near to the expected emotion on the 2D diagram.
Table 2. Table of error rate between emotions of participant and emotions normally tagged by emotional factor and its metric distance
Error B Series O Series G Series Metric distance (G)
Average 46.49 % 19.93 % 6.32 % 8.63 %
SD 17.01 % 13.55 % 6.41 % 8.11 %
![Figure 2. Two-dimension Circumplex space model [26,28-30].](https://thumb-eu.123doks.com/thumbv2/123doknet/12531907.342649/28.918.180.733.379.890/figure-two-dimension-circumplex-space-model.webp)

![Figure 8. Effect of the memory on the emotional state of person [35]](https://thumb-eu.123doks.com/thumbv2/123doknet/12531907.342649/37.918.196.728.253.388/figure-effect-memory-emotional-state-person.webp)