HAL Id: hal-01221567
https://hal.archives-ouvertes.fr/hal-01221567
Submitted on 25 May 2021
HAL is a multi-disciplinary open access
archive for the deposit and dissemination of
sci-entific research documents, whether they are
pub-lished or not. The documents may come from
teaching and research institutions in France or
abroad, or from public or private research centers.
L’archive ouverte pluridisciplinaire HAL, est
destinée au dépôt et à la diffusion de documents
scientifiques de niveau recherche, publiés ou non,
émanant des établissements d’enseignement et de
recherche français ou étrangers, des laboratoires
publics ou privés.
Influence of the grafting topology of hydrophobic silica
surfaces on the mechanical properties of silicone high
consistency rubbers
David Mariot, A. S. Caro-Bretelle, Patrick Ienny, Francois Ganachaud
To cite this version:
David Mariot, A. S. Caro-Bretelle, Patrick Ienny, Francois Ganachaud. Influence of the grafting
topol-ogy of hydrophobic silica surfaces on the mechanical properties of silicone high consistency rubbers.
Polymer International, Wiley, 2015, 64, pp.1128-1134. �10.1002/pi.4876�. �hal-01221567�
Influence of the grafting topology of
hydrophobic silica surfaces on the mechanical
properties of silicone high consistency rubbers
David Mariot,
a
Anne-Sophie Caro-Bretelle,
b*
Patrick Ienny
b
and François
Ganachaud
c
Abstract
Silica-filled rubber materials exhibit stress softening and hysteresis under cyclic loadings. These phenomena are usually associ-ated with both the Payne and Mullins effects. To better characterize these properties, five model silicas were produced and used in industrial-like high consistency rubber (HCR) formulations: the native (hydrophilic) silica and four chemically modified silicas for which both the content of surface silanols and the nature of the grafted silicone chains differ. Silica − polydimethylsiloxane HCR elastomer with constant silica content and optimal dispersion was tested via static (uniaxial tensile tests, cyclic and mono-tonic) and dynamic tests. The Payne and Mullins effects as well as the ultimate properties were evaluated as a function of particle surface treatment. It was found that the Payne amplitude decreases with the content of grafted chains, whereas the Mullins effect and ultimate strain decrease with an increase in molar mass between crosslinks. Finally, the ultimate strength is optimal as long as silica is surface treated, albeit independent of surface grafting topology.
Keywords: elastomers; coating; mechanical testing; mechanical properties
INTRODUCTION
Nano-reinforcement of rubbers is widely performed to enhance the mechanical properties of these materials, such as tensile stress and tensile strength, elongation at break, tear resistance etc. In particular, silicone materials are usually reinforced by nanoparti-cles of silica or carbon black,1which offer a high specific surface
area. The reinforcement of polydimethylsiloxane (PDMS) based elastomers is governed by particle − particle (aggregate structure) or particle − polymer interactions. In these composites, the poly-mer − particle bonds are clearly identified as hydrogen bonding between an OH group of the silica surface and an oxygen atom of the skeleton of the silicone chain. The particle − particle bonds (including hydrogen bonding) lead to an increase in the tensile strength (by a factor of 10)2until reaching an optimum fraction
of filler incorporation (the so-called percolation threshold). It is well known that these connections lead to the formation of a layer of linked elastomer with a thickness between 1 and 5 nm which acts as an interphase between the filler and the matrix3and which
depends on the molar mass of the polymer chains.4These
interac-tions obviously determine the reinforcement of the final material.5
Unfortunately the strong interactions between the particles and the matrix lead to both a very poor level of dispersion and a high viscosity that is detrimental to the mechanical properties. To solve these problems, and also to avoid latent crepe hardening (see for example DeGroot and Macosko6), silica nanoparticles are
function-alized (e.g. via organosilane grafting) before their incorporation in the matrix.
Under mechanical tests (monotonic and cyclic at low and large elongations), filled polymers exhibit nonlinear behaviour: after a few percent of deformation the stiffness drops (which appears
simultaneously with a peak in viscosity). For higher deformations, unloading and loading produce an irreversible softening. These phenomena are commonly named the Mullins and the Payne effects. Although modelizations have been studied for a long time,7,8the link between phenomenology and microstructure is
still a matter of discussion. The present report aims at study-ing these ill-understood mechanisms usstudy-ing real industrial mate-rials, namely high consistency rubber (HCR) (to our knowledge, only one group has thoroughly studied the mechanical proper-ties of a room temperature vulcanized silicone material).9In
addi-tion, the mechanical properties (Payne, Mullins ultimate strain and strength) are derived as a function of silica surface treatment, where grafting density and topology have been precisely tailored as described below. The adopted procedure was (i) preparation and characterization of the nanofillers (pristine silica + four differ-ent surface treated silicas), (ii) preparation of the elastomers and characterization of their dispersion, (iii) evaluation of the mechan-ical properties and (iv) interpretation of the results using a simple damage model.
∗ Correspondence to: Anne-Sophie Caro-Bretelle, C2MA, Ecole des Mines d’Alès, 6
Avenue de Clavières, 30319 Alès, France. E-mail: Anne-Sophie.Caro@mines-ales.fr
a Bluestar Silicones France S.A.S., 55 Avenue des Frères Perret, 69192 Saint-Fons Cedex, France
b C2MA, Ecole des Mines d’Alès, 6 Avenue de Clavières, 30319 Alès, France c Ingénierie des Matériaux Polymères, UMR CNRS 5223, Bâtiment Jules Verne, 17
EXPERIMENTAL
Silica preparation and characterization
A highly dispersible bare silica was first chosen, namely Aerosil®200 from Evonik Industries AG, Hanau-Wolfgang, Ger-many with a specific surface BET area of 200 m2g−1and a median
diameter d50= 12 nm (denoted as REF in the following). The
sur-face modification steps consisted in grafting cyclosiloxanes either as is (D4 homopolymerization, treatments denoted t1, t2, t3) or
by introducing vinyl coupling groups (D4/D4Vcopolymerization,
denoted t4). The processes used for surface treatments are
dis-closed in a patent application10 and will not be detailed in this
paper. The final grafting state of these silica surfaces, obtained from various characterization techniques [29Si solid NMR,
ethoxy-lation/gas chromatography (GC) technique], is given in Scheme 1 and their main features are summarized in Table 1. All treatments allowed (i) an easier filler dispersion in the matrix, (ii) a better control of surface − charge interaction by introducing a variety of grafting and surface silanol densities and (iii) the possibility of promoting chemical bonding with the surface coupling agent (for t4silica).
Silicone material
An HCR base supplied by Bluestar Silicones (Saint Fons, France) was systematically used in this study. The gum is a vinyl-terminated linear copolymer of dimethylsiloxane and methylvinyl-siloxane (0.075 mol%), of average molar mass Mw= 500
000 g mol−1, mixed with a dihydroxy-terminated siloxane oil
(used as a plasticizer) and silicas (45 phr) in a Z-arm shaped mill for 1 h (5 h for the REF silica). The peroxide curing agent (2,5-dimethyl-2,5-di(tert-butylperoxy)hexane in a 50 wt% silicone paste from Akzo Nobel) was then added in a two-roll mill, and silicone sheets (150 × 150 × 2 mm3) were cured for 10 min at 170 ∘C under 30 bars.
Composite microstructure
PDMS nanocomposite morphologies were studied using an opti-cal microscope (Leika, Solms, Germany) with a 100 sopti-cale factor to study the macroscopic dispersion. The smallest visible mesh is composed of 9 pixels, which corresponds to a quantifying limit of silica aggregates of 12 μm or more. A Quanta SEM 200 instru-ment (FEI, USA) with a 30 000 scale factor was used for a more thorough microscopic analysis. Strips of material 2 mm thick were cryo-fractured and observed under an accelerating voltage of 5 kV. Image analyses (AphelionTM3.2, ADCIS, France) were done for each
scale of observation using several micrographs (at least five) in order to cover the whole specimen surface area. Micrographs were first converted into black and white images; silica aggregates were then identified, numbered and filtered by their surface area values (A) at each scale of observation.
Molar mass between crosslinking points
Swelling measurements were carried out to get an indirect esti-mation of the average chain length Mcbetween two crosslinking
points. These experiments were performed in methylcyclo-hexane to determine the overall crosslinking density. The mean molar mass can be calculated from the Flory − Rehner equation:11
Mc= −
Msol∗𝜌sil∕𝜌sol∗
( VrT1∕3− VrT∕2 ) ln(1 − VrT ) + VrT+𝜒 ∗ VrT2 (1)
where 𝜒, Msol, 𝜌sol and 𝜌sil are the Flory − Huggins interaction
parameter, the molar mass of solvent, and the solvent and silicone densities, respectively. VrTexpresses the polymer fraction in the
swollen polymer that is composed of polymer, silica (not swollen) and solvent. The determination of VrTis performed as follows. A
disc of 13 mm diameter and 2 mm thickness was first weighed to determine the initial weight (Wi) and then immersed in 100 mL of
cyclohexane in a sealed bottle. After 48 h at room temperature, the equilibrium was considered to be reached as soon as the swollen silicone disc showed a constant weight. After a quick surface drying with an absorbing paper to remove the solvent that did not participate in the swelling, the silicone disc was weighed a second time (Ws). The swollen disc was then dried in a ventilated oven to
obtain the final weight (Wf). This value Wfis strictly inferior to Wi
since a small part of uncrosslinked PDMS is extracted during the swelling step. VrTis deduced from the equation
VrT= Wf− ( Wi∗ c ) Wf− ( Wi∗ c ) +(Ws− Wf ) ∗ 𝜌sil 𝜌solv (2)
where c represents the silica weight fraction, which was taken to be constant in all these tests.
Tensile, cyclic quasi-static and dynamic tests
The linear and nonlinear viscoelastic behaviours were character-ized at low strain (dynamic mechanical analysis) and large strain (cyclic and monotonic loadings). Dynamic mechanical analyses were carried out with a Metravib viscoanalyser which is a dynamic shear rheometer. The tests were conducted on cylindrical sam-ples (diameter 25 mm, height 1 mm). Isothermal dynamic sweep measurements were performed at ambient temperature. The sam-ples were sinusoidally stretched under various strain magnitudes at a frequency of 0.314 rad s−1. The stress–strain responses were
recorded automatically and used for evaluation of the storage modulus G′, the loss modulus G′′and tan𝛿 which is the ratio of
G′′and G′.
Uniaxial tensile tests were conducted on a Zwick proline Z005 testing machine according to the ASTM-D412 standard. Tested specimens are plane dogbones (H2 type: length L = 75 mm, height l = 4 mm, width h = 2 mm). The crosshead speed was taken as 500 mm min−1 and the software TestXpert® allowed
us to record time, load (F) and elongation (ΔL) from which strain was calculated (𝜀 = ΔL/L). The nominal stress is defined as𝜎 = F/lh. The tensile tests were conducted up to rupture of the specimen (to characterize the ultimate properties tensile strength 𝜎u, ultimate elongation 𝜀u) and were achieved first
with five loadings − unloadings up to a strain level of about 200% (𝜀 = 2) and then successively up to about 400% (𝜀 = 4) and 600% (𝜀 = 6) to specifically characterize the Mullins effect. All presented values are mean curves of at least five tensile test experiments.
RESULTS AND DISCUSSION
Elastomer preparations and characterizations
HCR elastomers were prepared using conventional industrial for-mulation and mixing techniques (see Experimental for details). Starting from the same bare silica, exhibiting a high surface area, we polymerized different cyclosiloxanes (D4or a
combina-tion of D4/D4
V) onto the silica surface to create different
Scheme 1. Grafting topology of the various silicas used in this work (the reference, not shown, is fully hydroxylated): (a) t1, ‘long’ chains of PDMS at low
surface density; (b) t2, short chains with large surface covering; (c) t3, short silicone loops; (d) t4, the same as t2but with 0.51% of vinyl groups in the chains
(in the graph, much fewer vinyl groups are available on the surface: this schematic view is given to show that the grafted chains first incorporate DVunits
and then D units).
Table 1. Main features of silicas, swelling results and modelling of the mechanical properties
REF t1 t2 t3 t4
Silica properties nSiOHa(nm−2) 4.60 3.60 2.50 2.65 2.25
nDb(nm−2) 0 3.80 3.10 3.00 3.65d
DPgraftc(g mol−1) 0 3.80 1.50 1.55 1.55
Swelling measurements Mc(g mol−1) 9850 19850 18450 18650 8500
Mechanical properties at break 𝜀u(%) 500 880 820 850 460
𝜎u(MPa) 9.4 10.0 10.5 10.7 10.2
Model fitting d∞ 0.66 0.45 0.52 0.52 0.68
𝜂 0.7 0.62 2.03 1.20 0.77
aDensity of SiOH groups at the silica surface, obtained from29Si solid NMR by integrating and comparing the Q
2, Q3and Q4areas.
bDensity of grafted D units obtained by measuring the content of each unit (M, D, T and Q) by a digestion technique and Gas Chromatography (GC)
analysis, and normalizing the D unit contents by each silica specific surface obtained by BET.
cAverage graft degree of polymerization obtained from n SiOH/nD. dIncluding 0.17 vinyl functions per square nanometre.
characterization techniques and swelling measurements, we were able to describe each surface treatment by the densities of surface silanol and siloxane units, from which average degrees of polymer-ization were deduced (see Table 1).
Silica grafting topology
As a reference, the surface of bare silica was first fully hydroxylated for 3 days in an acidic water solution heated at 60 ∘C. After drying, the29Si NMR spectrum of this silica was deconvoluted to extract
a reference spectrum. We used here the surface silanol density
of fully hydrated fumed silica at about 4.6 SiOH nm−2as detailed
in the work of Zhuravlev.12After treatment, the modified silicas
were analysed under the same conditions to obtain the density of surface silanols nSiOH. As expected, the surface treatment impacts
the number of surface silanols significantly, showing a global decrease in comparison with native silica. Note, however, that in the best case more than 60% silanol still remains accessible for physical interactions. The lengths of the grafted oligomers are on average quite short, even though some differences are traceable between silica t1and the others (see Table 1).
Crosslinking densities
The results of swelling experiments performed on crosslinked elas-tomers are presented in Table 1. From these, we determine Mc,
the mean molar mass between two crosslinking points, the lat-ter including reversible knots (from silica/PDMS physical inlat-terac- interac-tions) and irreversible chemical links. These Mcvalues highlight the
impact of the silica grafting content on the network density. Elas-tomers reinforced with D-modified silicas have a mean molar mass between crosslinking points of 18 500–20 000 g mol−1,
indepen-dent of the silica surface grafting topology. The presence of vinyl grafted at the silica surface (t4treatment) induces a decrease of Mc,
indicating that these chemical groups react during the curing step and create chemical bonds between the silica filler and the silicone matrix. The low Mcvalue found with the REF sample is ascribed to
the hydrogen bonding that the silicone chains share with the silica surface through silanol functions.
Silica dispersions
Silica dispersion in the silicone material point is very important since a strong relation between microstructure and mechanical behaviour has already been observed.13For all the formulations,
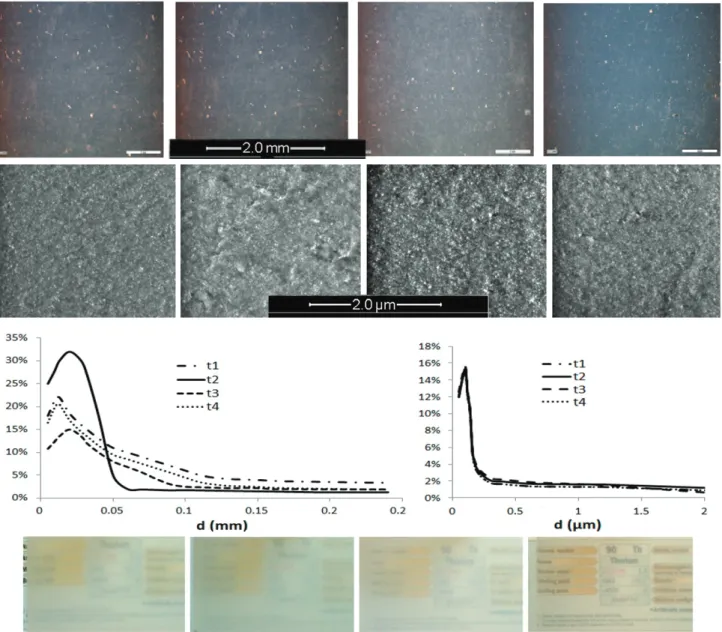
many of the elementary particles cluster together to form sil-ica aggregates. The dispersion and distribution of the reference sample, initially bad, were optimized by mixing during a longer time prior to vulcanization (see Experimental). For the formula-tions making use of treated silicas, both scales of observation (opti-cal microscopy and SEM) show that, whatever the functionaliza-tion, a good dispersion is obtained. No big agglomerates (particle size over 150 μm) were detected by optical microscopy. Small dif-ferences between elastomers could be observed, however, when looking at agglomerates of 50 μm size, explaining the slight differ-ences in the translucency of thin elastomer strips (Fig. 1).
Image analysis from SEM and optical micrographs enable a quan-titative characterization of particle dispersion and distribution. By collecting data from each magnitude analysis, the percentage of particle diameters can be obtained from d = 0.1 μm to d = 0.25 mm (the aggregates are assumed to be circular, d = (4A/𝜋)0.5). At × 2 k
zoom, some white dots can be observed on almost all pictures, characteristic of slightly agglomerated particles. At × 50 k zoom, no differences are revealed by the microscopy; the morphology of the dispersed silica seems to be the same, independently of the surface treatment. This is shown by the median diameters that are quite insensitive to surface treatment (between 0.015 and 0.02 mm for the macroscopic scale and under 0.15 μm for the microscopic scale) (Fig. 1).
All these formulations are thus equivalent from a microstruc-tural point of view. Deviation in the mechanical properties can therefore be correlated to the particle surface treatment. One ref-eree suggested that we carry out SAXS or (nano)tomography to better argue on this point. The statement on the microstructure based on both experience of these materials and a careful optical microscopy image analysis was deemed sufficient in this industri-ally related study. (Note that the material filled with the REF silica, contaminated during the image analysis, is not presented in Fig. 1.)
Mechanical properties
The Payne effect on non-vulcanized elastomers
The Payne effect is observed under cyclic loading conditions at small deformations (under 100% strain when the matrix shows a linear mechanical behaviour); it is known, for the filled rubber,
as the decrease in storage modulus (and a maximum in loss modulus) when the strain amplitude increases. This phenomenol-ogy is often associated with a breakdown process occurring in the agglomerates14and was shown to be fully recoverable.9
Nev-ertheless some researchers have reported that this nonlinear effect strongly depends on the filler surface treatment.15–17 In
fact the mechanisms responsible for the Payne effect still remain controversial.
Figure 2(a) shows the storage modulus versus strain amplitude for the different mixtures before vulcanization. First, these curves, independent of the surface treatment, reproduce the classical viscoelastic behaviour of filled polymer. The effect of surface treatment is also clearly demonstrated: a non-modified surface leads to higher storage modulus. Nevertheless the maximum loss modulus is reached for the same level of strain for all the formulations and approximately corresponds to the break point in the storage modulus. The Payne effect, evaluated by G′0(the storage modulus for small strain amplitude), is found to vary with the silica surface silanol content (Fig. 2(b)): higher concentrations of silanol induce a larger Payne effect. This trend seems to confirm that filler surface treatment should be responsible for the Payne effect.18 In the case of filled organic rubber, some researchers
made the same observation: the Payne effect is closely related to the amount of bound rubber; a linear evolution is observed when ΔG’(G’
∞− G’0) is plotted versus the amount of bound rubber
(grams per gram of silica).3The dissipation of the deformation also
seemed to depend strongly on Mc(not shown).
Monotonic tensile tests
Strain–stress tensile test curves of reinforced silicone elastomers filled with the different modified silicas show similar trends (Fig. 3). Their deformation is spatially uniform without any necking phe-nomena (as a consequence of a silica surface area lower than 300 m2g−1).19 At low stress (<50%), a small modulus drop is
observed, followed by a slight modulus increase when increasing elongation (between 50% and 300%). Regarding ultimate proper-ties (tensile strength and elongation at break), all tested reinforced elastomers have a tensile strength between 10 and 11 MPa (within the error of the test, see Fig. 3(a)). Tensile strength is not a priori cor-related to Mc. It is widely reported in the literature that𝜎udepends
mainly on the specific surface area and microstructural state of the silica particles, independent of their surface chemistry.17The
constant value observed here reflects the maximum load that the chains, stuck heavily on the surface, can physically bear before they break. In contrast, ultimate elongation is clearly sensitive to surface treatment. In Fig. 3(b) we see that the ultimate strain𝜀u
improves when increasing Mc, at least in the range Mc∈ [8000;
20 000 g mol−1]. Recent studies showed that above this threshold
value of 20 000 g mol−1the material is weakened again because of
the lower crosslinking density.20
Cyclic tensile tests
Typical cyclic nominal stress–strain curves are shown in Fig. 4 for all samples. They reveal the Mullins effect as well as the material dissipative effect as viscoelasticity. Each loading sequence (three strain levels: 200%, 400% and 600%) is followed by unloading until 20% of the maximum load achieved during loading (such a shortcut allows some time to be saved in the lengthy tensile tests). In practice, this cyclic loading consists of five cycles for each given level of stretch. For the reference formulation an additional sequence is performed at a lower strain level (strain level 100%)
Figure 1. PDMS/treated-silica elastomers as imaged by optical microscopy (top row, the length bar is 2 mm) and SEM (second row, the length bar is 2 μm).
Elastomer cuts shown from left to right are filled with t1, t2, t3and t4silicas. Third row: aggregate size distribution as revealed by image analysis of optical
(left) and SEM (right) micrographs (plotted as the content of particles versus their size, REF omitted). Last row: translucency of the different elastomers (the REF sample was more transparent but yellowy, not shown).
due to its poor tensile resistance. For all the formulations, loading and unloading paths following the first cycle do not rigorously coincide. The five cycles finally led to material stabilization, thus removing the viscoelastic response from the different materials.
The significant hysteresis observed during the first loading cycle compared to the fifth sequence increases strongly with the applied maximum deformation. The materials present a stress softening that depends quite strongly on surface treatment. This phenomenon is widely known as the Mullins effect3and is
associ-ated with the breakage of links inside the material (filler − matrix links and chain interaction links).5,7,8The Mullins effect is usually
attributed to bond rupture, molecules slipping, filler rupture, disentanglement21–23 (including disentanglement density).24
Some researchers have reported a complete recovery of the stress softening at room temperature, usually observed after heating of solvent exposure.25
Some models combined damage, viscoelasticity and vis-coplasticity of particle-reinforced rubbers26,27 to mechanically
describe this effect. For easier interpretation of the microstruc-ture/mechanics relationships, we chose to represent the damage of a material (d) as a function of strain. The damage function can be estimated for each level of cyclic loading (𝜀 = 2, 4, 6) by taking the ratio between the loading and unloading curve areas (see Fig. 5(a)).
For each material, we have extrapolated the fifth unloading curve to zero strain and calculated the area under the curve accordingly. The error made by doing so was estimated by a different calculus method at less than 10% (see the error bars in Fig. 5(a)). Note that for the REF sample 100% and 200% strains were used to calculate the two parameters, from which the values obtained compare well with other materials. The damage function can be fitted using a two-parameter model:7
d (𝜀) = d∞
{
1– exp[− (s + 1) ∕𝜂]} (3) d, d∞𝜀 [0, 1] 𝜂 ≥ 0
0 1 2 3 4 5 0,0 0,5 1,0 1,5 (b) (a) ref t1 t3 t2 G'0 (MPa) nSiOH (nm -2 ) t4
Figure 2. (a) Storage modulus versus strain amplitude of non-vulcanized formulations. (b) Initial storage modulus versus silanol density on treated silicas
(line is just a guide for the eye).
5000 10000 15000 20000 25000 0 2 4 6 8 10 (b) (a) 12 u
(MPa)
M
c(g/mol)
0 200 400 600 800 1000 u(MP
a
)
Figure 3. Tensile tests: (a) stress versus strain for the different elastomers; (b) evolution of ultimate mechanical properties against surface treatment.
Figure 4. Cyclic loading tests showing the effect of functionalization on the
Mullins effect for all materials.
with d∞the global damage done to the material (1 means a fully
damaged material) and𝜂 the damage accumulation.
The two d∞and𝜂 parameters determined for each formulation
are quoted in Table 1 (for details, a more thorough presentation of this procedure can be found in Caro-Bretelle et al.28). First, the
silica covered with vinyl groups follows the trend of the reference (a highly reinforcing silica), whereas other silica-filled materials are less damaged. For all the surface treatments (including those bearing functional vinyl groups), the d∞parameter decreases with
Mc, meaning that a denser silica network stands the load applied
to the test sample better. On the other hand, the parameter𝜂 was
found to decrease with increasing surface silanols except for the silica t4(Fig. 5(b)). This last result means that the Mullins effect
cannot be explained by considering independently the content of physical crosslinking occurring with silica or the silicone network density. Such results agree with the theory involving both chain sliding (in the case of physical crosslinking) and chain breaking (chemical crosslinking).
CONCLUSION
The aim of this paper was to give some hints about the influence of silica’s surface treatments on the mechanical properties of indus-trially viable HCR. Silicone elastomers were filled with a defined weight fraction of functionalized silica, produced by different pro-cesses and for which the grafting topology was perfectly mastered. Silica dispersions being comparable between samples, mechanical properties were found to be a direct consequence of particle sur-face treatment. Both non-functional and vinyl treated silicas were tested. Most parameters could be related to the crosslink den-sity and/or the quantity of remaining silanols on the silica surface, bearing in mind that these two parameters are not independent.
The main conclusions can be summarized as follows:
(i) The Payne effect depends on silanol surface concentration and thus seems to be governed mainly by particle − polymer interactions.
(ii) The damage associated with the Mullins effect decreases with an increasing average chain length between crosslinking points and is thus related to the physical and chemical crosslink densities.
Figure 5. (a) Global damage versus Mc. (b) Damage accumulation versus silica treatment (as given by the remaining silanol contents on silica surfaces).
(iii) The ultimate strain increases with the average chain length between crosslinks, which is a consequence of the crosslink-ing density evolution.
ACKNOWLEDGEMENTS
We are grateful to Bluestar Silicones for providing all the materials that were necessary to carry out this study.
REFERENCES
1 Leblanc JL, Prog Polym Sci 27:627–687 (2002).
2 Polmanteer KE and Lentz CW, Rubber Chem Technol 48:795–809 (1975). 3 Ramier J, Gauthier C, Chazeau L, Stelandre L and Guy L, J Polym Sci B
Polym Phys 45:286–298 (2007).
4 Mullins LJ, Rubber Chem Technol 21:281–300 (1948). 5 Bueche F, J Appl Polym Sci 5:271–281 (1961).
6 DeGroot JV and Macosko CW, J Colloid Interface Sci 217:86–93 (1999). 7 Chagnon G, Verron E, Gornet L, Marckmann G and Charrier P, J Mech
Phys Solids 52:1627–1650 (2004).
8 Chagnon G, Verron E, Marckmann G and Gornet L, Int J Solids Struct
43:6817–6831 (2006).
9 Chazeau L, Brown JD, Yanyo LC and Sternstein S, Polym Compos
21:202–222 (2000).
10 Mariot D and Ganachaud F, Method for preparing a silica grafted with an organosilicon compound. WO2013024137, France (2012).
11 Flory PJ and Rehner J, J Chem Phys 43:6817–6831 (1943). 12 Zhuravlev LT, Colloids Surf A Physicochem Eng Asp 173:1–38 (2000). 13 Bokobza L, Rubber Chem Technol 86:423–448 (2013).
14 Kraus G, J Appl Polym Sci Appl Polym Symp 39:75–92 (1984). 15 Maier PG and Gritz D, Kautschuk Gummi Kunststoffe 49:18–21 (1996). 16 Cassagnau P and Mélis F, Polymer 44:6607–6615 (2003).
17 Omnès B, Thuillier S, Pilvin P, Grohens Y and Gillet S, Compos Part A Appl Sci Manuf 39:1141–1149 (2008).
18 Paquien JN, Galy J, Gérard JF and Pouchelon A, Colloids Surf A Physic-ochem Eng Asp 260:165–172 (2005).
19 Ogebule O, Medvedev GA and Caruthers JM, Polymer 54:1190–1196 (2013).
20 Delebecq E, Hermeline N, Flers A and Ganachaud F, ACS Appl Mater Interfaces 4:3353–3363 (2012).
21 Diani J, Fayolle B and Gilormini P, Eur Polym J 45:601–612 (2009). 22 Clément F, Bokobza L and Monnerie L, Rubber Chem Technol
78:211–231 (2005).
23 Clément F, Bokobza L and Monnerie L, Rubber Chem Technol
78:232–244 (2005).
24 Hanson DE, Hawley M, Houlton R, Chitanvis K, Rae P, Orler BE et al, Polymer 46:10989–10995 (2005).
25 Yan L, Dillard DA, West RL, Lower LD and Gordon GV, J Polym Sci B Polym Phys 48:2207–2214 (2010).
26 De Tommasi D, Puglisi G and Saccomandi G, J Rheol 50:495–512 (2006). 27 Diani J, Brieu M and Vacherand JM, Eur J Mech A Solids 25:483–496
(2006).