Enhancing intra-regional grain trade in Eastern Africa
through market information systems:
The case of the Regional Agricultural Trade
Intelligence Network (RATIN)
Abstract
The Eastern Africa Grain Council (EAGC) focuses on promoting intra-regional trade in Africa in order to expand access to markets by the small holder farmers and traders. However, the lack of market information still remains a challenge, not only to farmers, but to all stakeholders in the value chain, as well as governments. Therefore, market information is largely considered a public good and its impact in facilitating and promoting regional trade can lead to increased earning for farmers, reduced transaction costs, increased regional trade, price stabilization, and improved food security. The provision of the market information system by the EAGC, the Regional Agricultural Trade Intelligence Network (RATIN), is discussed in this paper. A description of RATIN is provided with a discussion of the structure, conduct, and performance, as well as an examination of how RATIN has contributed to increased regional trade for grain in the Eastern Africa region, including a discussion regarding the challenges, lessons learned, and some conclusions. Key words: food policies; food security; information and communication technologies (ICTs); market information services (MIS).
Subjects: economy and rural development; food processing, marketing; tools and methods.
Résumé
Améliorer le commerce intrarégional des céréales en Afrique de l'Est par les systèmes d'information de marché : le cas du réseau RATIN (Regional Agricultural Trade Intelligence Network)
Le Conseil ce´re´alier est-africain (EAGC) s’emploie a` promouvoir le commerce intrare´gional en Afrique, en vue d’e´largir l’acce`s aux marche´s pour les petits exploitants agricoles et les commerc¸ants. Cependant, le manque d’informations de marche´ reste un de´fi non seulement pour les agriculteurs, mais pour tous les intervenants dans la chaıˆne de valeur et pour les gouvernements. Aussi les informations de marche´ sont-elles conside´re´es comme un bien public, dont l’impact sur le de´veloppement et la promotion du commerce re´gional peut augmenter les revenus des agriculteurs, re´duire les couˆts de transaction, accroıˆtre le commerce re´gional, stabiliser les prix et ame´liorer la se´curite´ alimentaire. Cet article pre´sente le syste`me d’information de marche´ RATIN (Regional Agricultural Trade Intelligence Network) fourni par EAGC. Il donne une description de RATIN, pre´sente sa structure, son comportement et ses performances. Il examine e´galement comment RATIN a contribue´ a` accroıˆtre le commerce re´gional de ce´re´ales en Afrique de l’Est et aborde les de´fis, les lec¸ons apprises et les conclusions tire´es.
Mots cle´s : politiques alimentaires ; se´curite´ alimentaire ; service d’information marche´s (SIM) ; technologies de l’information et de la communication (TIC).
The`mes : e´conomie et de´veloppement rural ; me´thodes et outils ; transformation, commercialisation.
Janet Ngombalu Gerald Masila
Eastern African Grain Council Maple Court Westlands Close Off Westlands Rd P.O. Box 218 00606 Sari Centre Nairobi Kenya <[email protected]> <[email protected]> doi:10.1684/agr.2014.0711 Reprints: J. Ngombalu
To cite this article: Ngombalu J, Massila G, 2014. Enhancing intra-regional grain trade in Eastern Africa through market information systems: The case of the Regional Agricultural Trade Intelligence Network (RATIN). Cah Agric 23: 270-81. doi :10.1684/agr.2014.0711
Introduction
Agriculture in Africa is the main source of livelihood for the rural economy and has a powerful though indirect influence on traditions, structural orientation, lifestyles, and rural land use. In general, about two thirds of Africa’s poor people live in rural areas and depend on agriculture for their survival, with low and often declining farm level productivity being major causes of persistent low incomes and hunger (AATF, 2004). The same pat-tern is reflected in the East Africa Community (EAC) where about 80% population live in the rural areas and derive their livelihood largely from agriculture.
Therefore, since the majority of the population in Africa is dependent on agriculture, selling their agricultural produce is their primary source of income, which is used to meet various household needs including education,
health, and complementing their
nutritional needs by buying foods that they do not produce. However, agri-culture in Africa is predominantly small holder-based and is characte-rized by many challenges which include small and uneconomical par-cels of land, low mechanization, and usage of farm inputs including use of certified seeds. As a result, agricultural productivity in Africa still lags behind the other regions of the world and has continued to decline over the years. In addition, access to market by the rural small holder farmers also remains a challenge as they often have to part with their produce at the farm gate, soon after harvest. Lack of market information, such as the prevailing market prices, trends, and the market demand and supply, means that the small holder farmer cannot effectively negotiate a price for his/her produce. Consequently, the farmers end up with low returns for their produce and this perpetuates the vicious circle of poverty.
The marketing and trade of agricul-tural products plays a critical role in the spatial distribution of produce from production areas to markets. However, trade of most agricultural products, more so staple foods, is generally not well organized and is often subjected to many state regula-tions when it comes to intra-regional
cross-border trade. Policy responses include: import tariffs for the objective of protecting local producers and export tariffs or even bans for the objective of ensuring food security for the local population. These policy instruments are generally not predict-able and sometimes are applied with-out any notice to the stakeholders. As a result, most stakeholders employ a ‘‘wait and see’’ strategy and decisions taken both on the supply and demand side of the equation are short-term.
The short-term approach further
exacerbates the price volatility phe-nomenon with the overall trend being a general increase in food prices owing to the low levels of investments in the sector as a result of the high risks associated with the sector.
Intra-regional trade
in agricultural products
The need to promote and facilitate intra-regional trade has been cited by many stakeholders, including govern-ments. One of the driving forces and objectives of the various regional economic blocs is to promote intra-regional trade by opening up the borders and availing larger markets for producers for economies of scale which benefits both producers and consumers.
Africa is on the right path of intra-regional trade, but lags behind other global regions. Exports from Africa have continuously increased signifi-cantly, especially in the last eight years. However, Africa has not kept pace with trade flows in the rest of the world which roughly tripled between 1990 and 2006. During this same period, intra-regional trade within emerging Asia increased eight fold.
By 2007, intra-regional trade
accounted for more than 50% of total trade in East Asia. However, intra-regional trade in Africa remains low and accounts for less than 10% of total trade. Between 1999 and 2006, for example, intra-African trade increased by an average of just 14% per year, while trade with the United States and China expanded by 26 and 61%; respectively (EAC, 2011). Despite the low level of intra-African trade at the regional level, in some African coun-tries intra-regional trade is significant.
Intra-regional trade in Africa has remained low over the years as cross-border barriers to trade are the order of the day in a continent that has the highest number of borders in the world. However, the EAC recently reported that the intra-regional trade in EAC had grown by 49% in the last five years with an increased interest to liberalize and promote cross-border trade among member states of the regional bloc; Tanzania, Uganda, Kenya, Burundi, and Rwanda. The lack of market information is a challenge, not only to farmers, but to all stakeholders in the value chain, as well as governments. Often, govern-ments institute policy responses with-out sufficient information to back up their decisions. Therefore, the need and demand for market information is largely a public good and its impact in facilitating and promoting regional trade can lead to increased earning by farmers, reduced transaction costs, increased regional trade, price stabili-zation, and improved food security. Many organisations have attempted to establish and operate market informa-tion services. Government ministries also expend considerable efforts to collect and disseminate market infor-mation with varying degree of success. However, stakeholder confidence in the market information provided by governments has generally been low and they ultimately do not rely much on this information.
The market
information system
by the Eastern Africa
Grain Council
The Eastern Africa Grain Council (EAGC) is a regional, non-profit, membership council of firms and organizations in the grain value chain established in 2006, with a mandate covering 10 countries in the Eastern Africa region. The membership of the EAGC is comprised of key stake-holders in the grain value chain, including grain producers/farmers, traders, processors, and other
providers, such as input suppliers, financial institutions, among others. The vision is ‘‘to be a leading voice of the private sector in the grain industry in Africa’’ so as to positively influence policy and practice in market devel-opment and trade facilitation in the Eastern Africa region. The key objec-tive of the EAGC is to develop, influence, and promote frameworks for structured grain trading as a means to better integrated national and regional grain markets, resulting in increased intra- and inter-regional grain trade governed by defined and harmonized predictable policies, rules of trade, regulations, standards, and a transparent price discovery mechanism.
The EAGC business model focuses on provision of services to facilitate: investment in development of market infrastructure and institutions at national and regional level, business and financial linkages, access to market information, improved capa-city to comply with regionally and internationally accepted standards, regulations and practices, and policy and regulatory processes that lead to
better integrated markets and
expanded grain trade in the region. By focusing on regional grain trade, the EAGC aims to improve market access for value chain actors, espe-cially small holder farmers and small scale traders, and by so doing con-tribute to increased production, increased incomes, poverty reduction, and improved food security in Eastern Africa. The EAGC provides a regional institutional private sector framework to address issues affecting the grain industry in a holistic manner.
To achieve the above objectives, the EAGC has developed and
implemen-ted four key approaches which
include:
1) an electronic regional grain trading platform, the Electronic Grain Trade Africa (EGTAfrica), under which the EAGC is developing and promoting the Structure Trading System;
2) provision of market information through the Regional Agricultural Trade Intelligence Network (RATIN); 3) training and capacity building of stakeholders through the Eastern Africa Grain Institute (EAGI); and 4) policy advocacy and dialogue to create an enabling policy environment through the Agricultural Trade Policy
Advisory Forum for Eastern and
Southern Africa (ATPAF-ESA). This paper discusses the provision of the market information system by the EAGC’s RATIN. A description of RATIN is provided with a discussion of structure, conduct, and perfor-mance, as well as an examination of
how RATIN has contributed to
increased regional trade in grains in the Eastern Africa region, with a discussion of the challenges, lessons learned, and some conclusions.
EAGC RATIN market
information system
RATIN structure, conduct, and performanceThe EAGC RATIN market information system was initially developed by the USAID RATES program and later taken over by the EAGC when the EAGC was formed in 2006. It was recently re-designed, upgraded, and re-launched in 2012 in response to recommenda-tions and user needs. The upgrade also took advantage of, and benefited from, recent developments in techno-logy, including mobile applications, among others.
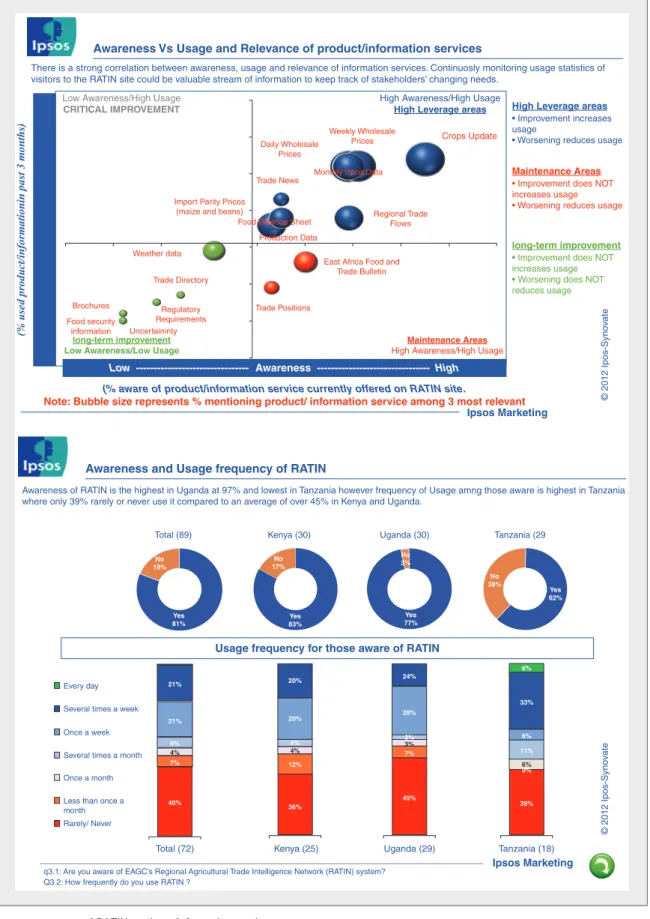
The upgrade process started with a detailed user survey conducted on behalf of the EAGC by Ipso Synovate, a leading market and opinion research agency in East Africa. The survey, which was commissioned in Decem-ber 2011 and reported in February 2012, rated the level of RATIN usage and satisfaction by stakeholders. The survey which sampled 89 individuals, 60 of whom were EAGC members, revealed that there was a high aware-ness of RATIN across Kenya, Uganda, and Tanzania; the three countries targeted for the study. The awareness levels were highest in Uganda at 97%, followed by Kenya at 83%, and Tanzania at 62%. With regards to satisfaction levels, 69% reported that they were satisfied with delivery of MIS-related services (i.e. they rated quality of service as high).
In summary, the findings of the RATIN usage and satisfaction survey indicate high awareness and usage of RATIN products and services, including com-modity prices, trade flow data, pro-duction data, and the food balance sheet data. Figure 1 summarizes the
findings of the study in terms of awareness and usage of RATIN pro-ducts.
A project team comprising of officers from the EAGC Secretariat, EAGC members, and the USAID COMPETE project held several planning and development sessions. A project initia-tion document (PID) was developed providing complete details of how the team envisioned the look, feel, and functions of the new RATIN system. The aim of the survey was to deter-mine the usability of RATIN among its main key audience. The survey tar-geted 40 stakeholders from each of the countries: Kenya, Uganda and Tanza-nia. The target included the private sector, some of whom were EAGC members and non-EAGC members.
The respondents sampled also
included policy makers, other MIS service providers, financial institu-tions, farmer groups, and apex farmer organisations.
The selection of the 40 respondents per country was guided by the master list developed by the EAGC through its country offices, on the main stake-holders in the region. The methodol-ogy was purposive sampling, since it targeted key stakeholders in the grain industry. The sampling was not based on those who had used RATIN before, but based on their participation in the grain sector.
From the findings, several respon-dents were aware of, and had used, RATIN, while a number were not aware of RATIN at all.
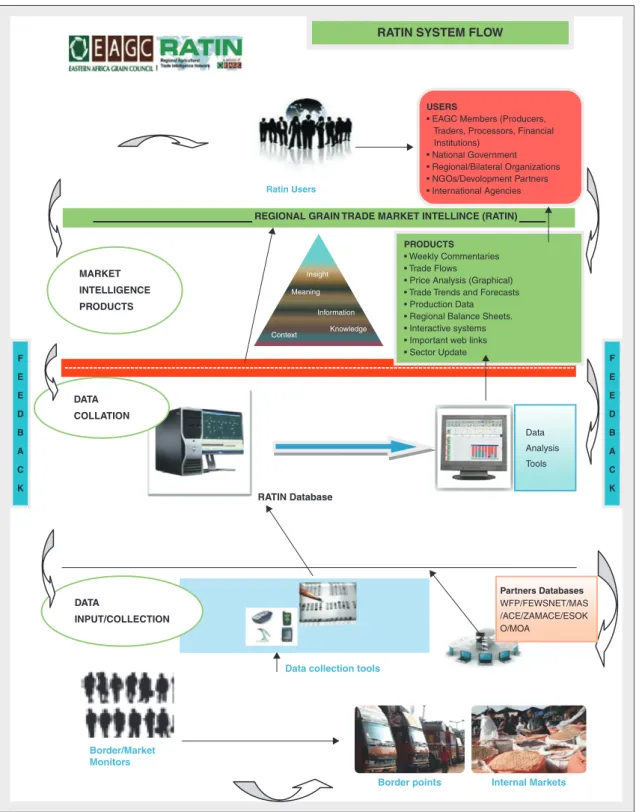
RATIN System, infrastructure, and market data collection
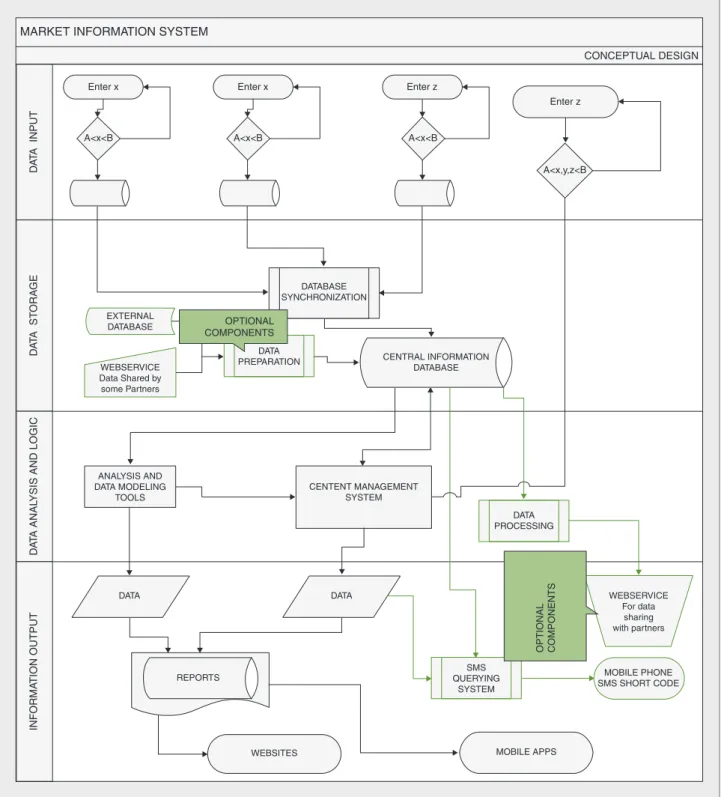
The structure of the RATIN system has several components. First, there is the system itself consisting of an internet-based database with data input, storage, processing, analysis, reporting, and interactivity functionalities (figures 2 and 3).
Second, is the field data collection which is undertaken by a network of border and market monitors who are provided with a smart mobile tele-phone, set up with a special applica-tion and GPS enabled. The first step of data collection and transmission is to log into the application. To log in, the telephone with the mobile application confirms the GPS coordinates that
Awareness Vs Usage and Relevance of product/information services
There is a strong correlation between awareness, usage and relevance of information services. Continuosly monitoring usage statistics of visitors to the RATIN site could be valuable stream of information to keep track of stakeholders’ changing needs.
Low Awareness/High Usage CRITICAL IMPROVEMENT
High Awareness/High Usage
High Leverage areas
Ipsos Marketing
(% aware of product/information service currently offered on RATIN site.
Note: Bubble size represents % mentioning product/ information service among 3 most relevant
• Improvement increases usage
• Worsening reduces usage
long-term improvement Low Awareness/Low Usage
High Leverage areas
• Improvement does NOT increases usage • Worsening reduces usage Crops Update Regional Trade Flows Trade News Trade Directory Regulatory Requirements Weather data Brochures Food security information Uncertaininty
Import Parity Prices (maize and beans)
Trade Positions
East Africa Food and Trade Bulletin Food Balance Sheet
Production Data
Monthly Price Data Daily Wholesale Prices Weekly Wholesale Prices Maintenance Areas Maintenance Areas High Awareness/High Usage
• Improvement does NOT increases usage • Worsening does NOT reduces usage long-term improvement
Low --- Awareness --- High
Awareness and Usage frequency of RATIN
Awareness of RATIN is the highest in Uganda at 97% and lowest in Tanzania however frequency of Usage amng those aware is highest in Tanzania where only 39% rarely or never use it compared to an average of over 45% in Kenya and Uganda.
Total (89) No 19% No 17% No 3% No 38% Yes 62% Yes 77% Yes 83% Yes 81% 21% Every day
Several times a week
Several times a month Once a week
Once a month
q3.1: Are you aware of EAGC’s Regional Agricultural Trade Intelligence Network (RATIN) system? Q3.2: How frequently do you use RATIN ?
Less than once a month Rarely/ Never
Total (72) Kenya (25) Uganda (29)
© 2012 Ipos-Syno v a te © 2012 Ipos-Syno v ate Tanzania (18) 20% 24% 6% 6% 33% 11% 28% 20% 21% 6% 4% 4% 3%3% 7% 45% 4% 12% 36% 40% 7%
Usage frequency for those aware of RATIN
Kenya (30) Uganda (30) Tanzania (29
0%
39% 6%
Ipsos Marketing
(% used product/informationin past 3 months)
Figure 1. Awareness vs usage of RATIN products/information services.
Figure 1. Sensibilisation des usagers et utilisation des produits de RATIN et des services d'information. EAGC RATIN. Survey by Ipsos Synovate, 2012.
have been previously set to the specific location from where the monitor has been assigned to collect the data. The system confirms the location and then allows the monitor to log in and proceed to key in the observed market
prices of the day for the listed com-modities, and then submits the data directly to the system.
The EAGC RATIN enumerators are employed and compensated by the EAGC. They are also trained by the
EAGC using a very detailed training manual on standardized methodologies for data collection and entry that was developed with support of, and in partnership with, other international donor organizations. The manual has
RATIN SYSTEM FLOW
Ratin Users
Data collection tools
Border/Market Monitors
Border points Internal Markets REGIONAL GRAIN TRADE MARKET INTELLINCE (RATIN)
MARKET INTELLIGENCE PRODUCTS DATA COLLATION RATIN Database DATA INPUT/COLLECTION PRODUCTS • Weekly Commentaries • Trade Flows
• Price Analysis (Graphical) • Trade Trends and Forecasts • Production Data • Regional Balance Sheets. • Interactive systems • Important web links • Sector Update
USERS
• EAGC Members (Producers, Traders, Processors, Financial Institutions) • National Government • Regional/Bilateral Organizations • NGOs/Devolopment Partners • International Agencies Data Analysis Tools Insight Meaning Information Knowledge Context Partners Databases WFP/FEWSNET/MAS /ACE/ZAMACE/ESOK O/MOA F E E D B A C K F E E D B A C K
Figure 2. RATIN system flow chart. Figure 2. Organigramme du système RATIN.
been used to train monitors including those from partner organizations. This has tremendously improved quality and efficiency of data collection, as reflected in the findings of the end-term review.
The enumerators are male and female, most with college degrees. Prices are collected by enumerators speaking the local dialect and the price data disseminated in English, French,
Kinyarwanda, and Kiswahili. To
ensure consistency, market prices are collected daily at between 06.00 and 09.00 a.m. Border prices are collected continuously during the day. Enter x
MARKET INFORMATION SYSTEM
A<x<B EXTERNAL DATABASE DATA DATA INFORMA TION OUTPUT D A T A ANAL
YSIS AND LOGIC
D A T A ST ORA GE D A T A INPUT ANALYSIS AND DATA MODELING TOOLS REPORTS WEBSITES DATABASE SYNCHRONIZATION CENTRAL INFORMATION DATABASE CENTENT MANAGEMENT SYSTEM DATA PREPARATION DATA PROCESSING WEBSERVICE Data Shared by some Partners WEBSERVICE For data sharing with partners MOBILE PHONE SMS SHORT CODE SMS QUERYING SYSTEM MOBILE APPS Enter x A<x<B Enter z A<x<B Enter z CONCEPTUAL DESIGN A<x,y,z<B OPTIONAL COMPONENTS OPTIONAL COMPONENTS
Figure 3. RATIN system conceptual process flow chart.
Figure 3. Organigramme du processus conceptuel du système RATIN. EAGC, 2011.
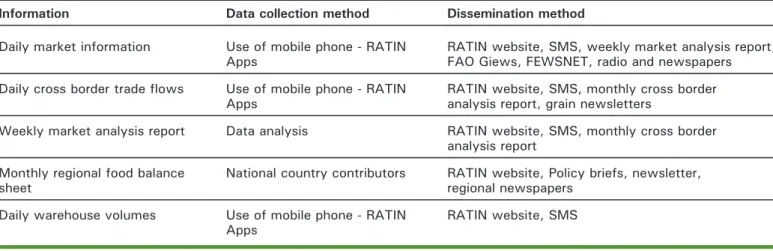
RATIN products and service The data submitted from the markets and border points into the system server is further cross checked by the RATIN desk officer who checks for outliers, consistency, completeness, and accuracy of the data. Once satis-fied, the data is then allowed into the main database from where it is avail-able for users to view on the RATIN website on www.ratin.netor through the RATIN SMS Dissemination System by keying in the commodity and market, and sending the text to the RATIN SMS, e.g. maize, Kitale, and sent to +254 705 606666 for Kenya. Upon receipt of the SMS, the system responds with an SMS back to the sender, providing the data requested. On a weekly basis, the RATIN editorial team prepares a market analysis report and circulates it to the EAGC members and stakeholders in the mailing list. RATIN has over 16 products which include daily market prices, daily cross-border trade flows, real-time warehouse stocks, regional food-balance sheets, parity prices, grain trade news updates, weekly market analysis reports, monthly cross-border reports, daily news updates, interactive maps and historical datasets, social media (Facebook and Twitter), Short Message Services (SMS), a telephone-based service, website dis-play, and advertorial space (table 1). The daily market price information for the selected commodities in selected key markets in the Eastern Africa region is usually available on the
RATIN website by 09.00, Monday to Friday. At the end of each week, the data is analysed for trends and com-parisons and a report showing the market analysis is prepared by the editorial team and disseminated to members and stakeholders.
The Regional Food Balance Sheet (RFBS) is another product also hosted on the RATIN website. The RFBS is a joint partnership between the EAGC and several other partners, including: the EAC, the USAID, the Association for Strengthening Agricultural Research in Eastern and Central Africa (ASARECA), National Governments Ministries of Agriculture, and Strategic Grain Reserve Agencies, among others. The data in the RFBS is sourced from three key contributors; the private sector grain traders, warehouse operators, and grain millers/processors who pro-vide their periodic closing and opening stocks and import/export projections, coordinated by the EAGC, the Minis-tries of Agriculture who provide data of production estimates, post-harvest losses, and stocks held in the National Strategic Grain Reserve Agencies, and finally the Relief Agencies. The RFBS provides data of food stock balances and estimations for imports, exports, consumption, and gives an indication as to whether the region faces a food deficit or surplus, and an appropriate policy response can be taken in good time to avert any food security crisis. The collection and compilation of production data in the region has been one of the challenges the EAGC
has faced in developing the regional food balance sheet. The accuracy and reliability of the data was a challenge in the beginning. However, given the institutional framework on the regio-nal food balance sheet, the quality assurance on the data provided is verified by the food balance sheet data national committees. This has mini-mised the margin of error which makes the RFBS very useful in the EAC region. Nonetheless, there is still room for improvement in the collec-tion of produccollec-tion estimates data if appropriate systems can be put in place by the respective governments. The daily warehouse volume tracking is another service offered by the EAGC under RATIN. This is run through the system known as the ‘‘EAGC Real Time Volume Tracking’’ (RTVT) and is a mobile telephone-based application which is installed at the warehouses, registered under the EAGC. The ware-house operators feed in the data of stocks delivered, as well as stocks received in the warehouse, stocks by partners, and the sum of balance of stock that is available for sale. The data is transmitted to RATIN and stakeholders have access; they can see where stocks are available for sale and can also contact a particular ware-house to initiate discussions on trans-actions.
RATIN users
The RATIN system is used by a
cross-section of market actors, from
Table 1.
Summary of information offered by RATIN.
Tableau 1. Résumé des informations offertes par RATIN.Information Data collection method Dissemination method
Daily market information Use of mobile phone - RATIN
Apps
RATIN website, SMS, weekly market analysis report, FAO Giews, FEWSNET, radio and newspapers Daily cross border tradeflows Use of mobile phone - RATIN
Apps
RATIN website, SMS, monthly cross border analysis report, grain newsletters
Weekly market analysis report Data analysis RATIN website, SMS, monthly cross border
analysis report Monthly regional food balance
sheet
National country contributors RATIN website, Policy briefs, newsletter, regional newspapers
Daily warehouse volumes Use of mobile phone - RATIN
Apps
RATIN website, SMS
producers to traders, processors, financial institutions/banks, research-ers, and NGOs to national govern-ments. RATIN is used by stakeholders for different uses.
Grain producers, traders, and proces-sors/millers refer to RATIN in order to obtain the prevailing market prices and trends and locations with the highest and lowest prices, so as to make their buying or selling decisions. Research-ers and policy analysts in the region use RATIN data for their research purposes including analysis, interpretation, and to obtain insights for study recommen-dations and policy briefs to various stakeholders. Policy makers use the historical price data collected in RATIN to analyse price trends and compute projections in order to make decisions of policy responses.
RATIN and Warehouse Receipt Systems
The Warehouse Receipt System (WRS) allows a grain producer or trader to deposit their grain produce in a
certi-fied warehouse upon confirmation of the quality and quantity, and is issued with a warehouse receipt as proof of title of the warehoused commodity (figure 4). The depositor can then take the warehouse receipt to a bank or financial institution and can borrow up to 60% of the prevailing value of the warehoused commodity. While it may be possible for the holder of the receipt to sell the commodity forward and thereby ‘‘lock in’’ a price, the operation is normally of a speculative nature. The depositor waits and keeps monitoring market prices, and eventually decides to sell when the price meets his/her objective. On selling, the depositor transfers the warehouse receipt to the buyer and the money is paid through the bank that had advanced credit to the farmer. The bank deducts the principal loan and interest, the warehouse operator deducts the warehouse sto-rage and grain handling charges, and the balance is paid out to the depositor (box 1).
RATIN has been the central point of reference to all WRS actors including the depositors (farmers or traders),
buyers (traders or millers), and financial institutions who refer to the prevailing prices for the purposes of valuation of the stock to determine the amount of credit to advance to the borrower. The financial institutions also refer to RATIN to monitor the price trends and take action to avoid losses, e.g. calling for the sale of the produce, in the event that the pro-duce price falls to a level that is near the price at which a loan was advanced, thus causing a risk to the recovery of the loan. This price level is called a ‘‘trigger price’’. Table 2
shows some warehouse volumes of various EAGC-certified warehouses in Kenya.
RATIN and intra-EAC regional trade
This section aims to provide evidence of the impact of RATIN on EAC regional trade.
As RATIN monitors the informal cross-border trade (ICBT) in grain in key selected borders in East Africa, it is
vsta
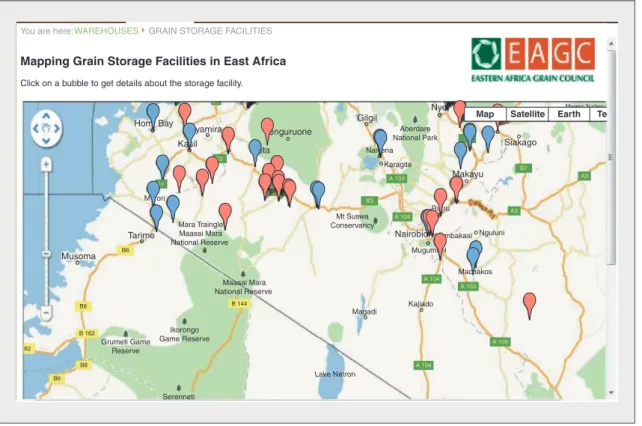
Mapping Grain Storage Facilities in East Africa
Click on a bubble to get details about the storage facility.
Hom Bay Nyamira Kasil Tarime Mara Traingle Maasai Mara National Reserve lenguruone Gilgil Maasai Mara National Reserve Magadi Nairobio Mugumohl Kambakasi Nguluni Rutru Karagite Naivena Makayu Siakago Nyel Mt Suswa Conservancy Aberdare National Park Kajiado Machakos Lake Natron Ikorongo Game Reserve Grumeti Game Reserve Serenneti Myrori Musoma
You are here:WAREHOUSES GRAIN STORAGE FACILITIES
A 104 A3 A3 B7 A 104 A1 B3 B3 A 104 A 104 A 103 A 109 B6 B6 B6 B8 B 162 B 144 62
Map Satellite Earth Te
Figure 4. Mapping grain storage facilities in East Africa.
Figure 4. Cartographie des dispositifs de stockage de céréales en Afrique de l'Est. EAGC RATIN.
possible to use RATIN data to see if this trade has increased over time. The evidence indicates that EAC intra-regional trade in grains has been increasing over the years, although still at a low level (figures 5, 6, and 7). The regional grain trade flow indicates a continuous movement of grain across the borders, with Kenya being the main destination market serviced by Uganda and Tanzania, albeit through informal trade.
However, the quantities traded are highly unstable, suggesting that this trade mainly reflects the dynamics of produc-tion and consumpproduc-tion in the different countries (their trends and the instability of harvest levels in the different coun-tries). Therefore, the growth of inter-regional trade recorded by RATIN moni-tors should be interpreted cautiously and does not provide any proof of RATIN’s effect on regional trade.
The correct way to proceed is to consider the causality chains by which RATIN may have affected regional
trade and to check if we can find evidence confirming that these caus-ality chains have actually been acti-vated.
Basically, RATIN can affect regional trade through two channels: i) advocacy leading to more stable and open regional trade policy regimes; and ii) better information of traders and other market players leading to more arbitrage and more trade across borders.
Regarding the first channel, govern-ment officials have reported making reference to RATIN while making policy decisions, such as import and export of grains. In the last two years, the region has enjoyed a continuous trade flow without import or export ban restrictions. RATIN and its services have been cited as one of the key reasons why there have been stable regional trade policy regimes. A tem-porary export ban placed by the Government of Tanzania in 2011 was later lifted following intense lobbying by stakeholders who made
continuous reference to the EAGC RATIN information, thereby contribut-ing to increased regional trade. In addition to data on prices and cross-border trade, the RFBS is likely to have played an important role in this area. Regarding the second channel, it should be emphasized that traders play a critical role in regional trade as they source produce by determining where supplies are in surplus areas and then moving them to the markets to meet demand in the deficit areas, thus providing a crucial link between
farm producers and the market,
millers/processors, and eventually to the consumers. However, the trade process of buying, transportation, drying, cleaning grading, packaging, and storage encapsulates the transac-tion costs which also include the resources spent to seek information on where to buy or sell a particular produce. Access to accurate, timely, and relevant market information is therefore a critical factor, the absence of which can hinder trade. However, stakeholders in agribusiness, farmers, traders, and millers have always cited the lack of market information, espe-cially for agricultural produce, as one of the cardinal challenges they have to contend with, a factor that also increases their risk profile.
The EAGC RATIN provides different types of market information to support decision-making for trade purposes: daily market prices, price trends of various grains and cereals produced in the region, and cross-border trade volumes; imports, exports and ware-house volumes generated from the EAGC RATIN system, the information of which is available for reference by
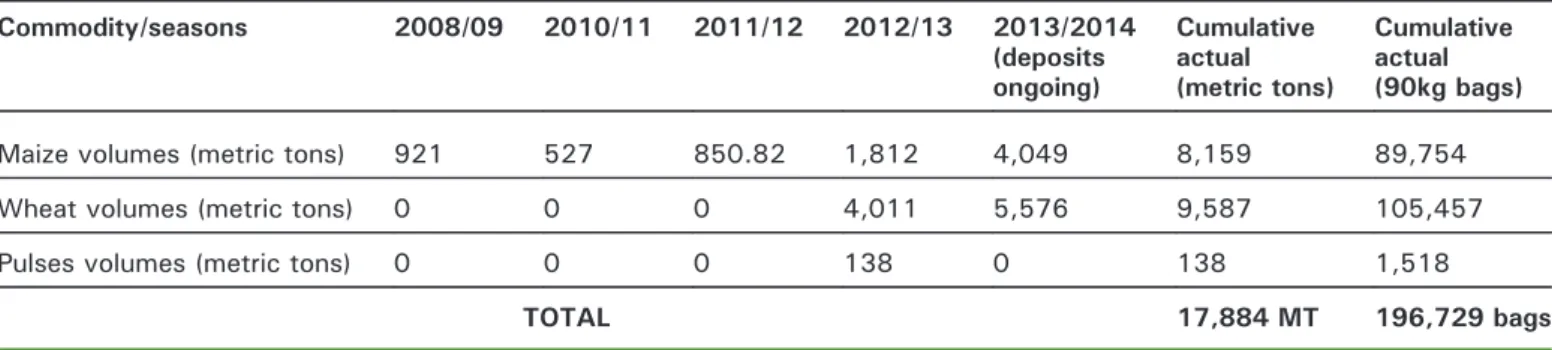
Table 2.
Volumes of commodities deposited in various EAGC-certified warehouses in Kenya.
Tableau 2. Volumes de produits de base déposés dans divers entrepôts certifiés d'EAGC au Kenya.Commodity/seasons 2008/09 2010/11 2011/12 2012/13 2013/2014 (deposits ongoing) Cumulative actual (metric tons) Cumulative actual (90kg bags)
Maize volumes (metric tons) 921 527 850.82 1,812 4,049 8,159 89,754
Wheat volumes (metric tons) 0 0 0 4,011 5,576 9,587 105,457
Pulses volumes (metric tons) 0 0 0 138 0 138 1,518
TOTAL 17,884 MT 196,729 bags
Source : EAGC.
Box 1
Testimony from a RATIN user
Ms. Maria Kioko is a member of Kasikeu Multipurpose Warehouse (located in Makueni Country, Kenya and supported by EAGC). Maria narrates: "Before WRS was introduced to us, we used to sell our produce to middlemen direct from the farm and never got any profit; we even ended up without food in our stores. However, after WRS was introduced, many of us decided to deposit our grains to wait for better prices. The price of grain has increased from Kes. 30, at harvest time to Kes. 72 by end of December, 2012. We are very excited about the stores and the fact that we can now borrow money easily. I harvestedfive bags of mbaazi (pigeon peas), three bags of cowpeas, and one bag of ndengu (green grams). With that safely stored in the warehouse and with the receipt I was given, I borrowed a loan from Kasikeu Financial Services Association (FSA), which I used to pay school fees and other necessities." Source: EAGC
stakeholders through the EAGC web-site and via mobile telephone SMS
application. Through the EAGC
RATIN, stakeholders in the region can obtain quick and real-time infor-mation about price trends and
ware-house stock volumes in order to decide whether to buy, sell, or store. Since the establishment of the EAGC RATIN, and specifically the recent upgrade and re-launch, the market information system has increased a
notch with respect to provision and availability of information, and EAGC members have repeatedly reported that one of the major attractions to them signing up membership to the EAGC is the provision of market information.
Consequently, we can consider that the
EAGC RATIN (which is now a
respected credible and authoritative source of relevant, timely, and accurate market information) is likely to have contributed to regional trade facilita-tion by two channels: by strengthening advocacy in favour of more stable and open regional trade policy regimes, and by improving traders’ information on the situation and dynamics of the regional grain market.
RATIN business model
and sustainability
RATIN is owned by the EAGC and is primarily a service to EAGC members and other interested stakeholders. The basic information provided by RATIN, including price data, cross-border trade data, reports, and analysis, can generally be classified as a public good and is currently available to the public. The RATIN system upgrade and continued operations have been possible through financial support from development partners, including USAID and the Swedish International Development Agency (SIDA), ASAR-ECA, and ICRISAT, among others. The donor support from the partners is used to pay the market monitors, system hosting, and staff and mana-gement of the System.
A business model for the sustainability of RATIN is under development. The sustainability drivers identified include various RATIN products and services that can be sold to members and other stakeholders, as well as some revenue-generating services. These include data sales through subscription, data analy-sis and reporting, SMS data bundle sales, SMS info push services to regis-tered users, and web advertising on the RATIN website. A detailed business plan with system marketing and pub-licity inputs, cost estimates, and
projec-tions of sales revenue is under
preparation for review and implemen-tation.
2009 2010 2011 2012 2009 2010 2011 2012 2009 2010 2011 2012 Busia (Uganda Kenya) Gatana (Uganda Rwanda) Mutukula (Tanzania Uganda) 0 20,000 40,000 60,000 80,000 100,000 120,000 140,000 160,000 180,000
Figure 6. Bean trade flow at various border points (in metric tons).
Figure 6. Flux commerciaux de haricots à différents points de passage frontaliers (en tonnes). EAGC RATIN (www.ratin.net).
350,000 0 50,000 100,000 150,000 200,000 250,000 300,000 2009 2010 2011 2012 2009 2010 2011 2012 2009 2010 2011 2012 Busia (Uganda Kenya) Gatana (Uganda Rwanda) Mutukula (Tanzania Uganda)
Figure 5. Maize trade flow at various border points (in metric tons).
Figure 5. Flux commerciaux de maïs à différents points de passage frontaliers (en tonnes). EAGC RATIN (www.ratin.net)
RATIN achievements,
challenges, lessons
learnt, and
recommendations
RATIN achievements
Since the EAGC completed the RATIN system upgrade and re launch in April 2012, the system has recorded several significant achievements. A number of lessons have been learnt through the process and these lessons continue to provide critical feedback for continued improvements of the Systems, products, services, and developing a sustainability strategy.
Some of the achievements of RATIN include: an increase in the number of commodities to 12 and markets monitored, improved efficiency, accu-racy, and timeliness of the data
submission through GPS-enabled
smart telephones, improved data ana-lysis and reporting, an increased user-friendly and interactive system where users query the data and perform same basic trending and statistical analysis online, and an efficient dissemination process through the new SMS system. RATIN has recorded an increased number of users since its re-launch
in April 2012. New users have also continued to log into the system. Between January 2013 and December 2013, the RATIN website received a total of 72,774 visits from 44,017 different visitors, generating a total of 8,001,083 hits on the different pages of the website (note this number of hits has increased since mid-2013, see
figure 8). Meanwhile, the RATIN SMS
facility cumulatively received 1,649 queries.
RATIN challenges
Designing, developing, and imple-menting a market information system that meets stakeholder needs is an onerous task. Firstly, establishing and balancing the needs among a diverse spectrum of users has been a challenge. Secondly, to attach a monetary value to a public good and find users who are willing to pay for the information is a challenge.
The costs of establishing and operat-ing a market information system are substantial and so far have been financed by development partners who pick and choose specific ele-ments and activities of the system that they find fashionable and interesting to fund. This has made it difficult for the EAGC to comprehensively address the sustainability process of the system and even invest in activities that contribute to the sustainability of the system, such as marketing and pro-moting the system to increase aware-ness and the user base for revenue generation.
Lessons learnt
and recommendations
The best lesson learnt by the EAGC in this process is that it is indeed possible
EAGC RATIN HITS 2013
Jan-13 Feb-13 Mar-13 Apr-13 May-13 Jun-13
Hits 1,400,000 1,200,000 1,000,000 800,000 600,000 400,000 200,000 0 Jul-1 3
Aug-13 Sep-13 Oct-13 Nov-13 Dec-13
Figure 8. Number of hits on EAGC RATIN website from January to December 2013 (www.ratin.net). Figure 8. Nombre de visites sur le site web EAGC RATIN de janvier à décembre 2013 (www.ratin.net). EAGC RATIN. 350,000 0 50,000 100,000 150,000 200,000 250,000 300,000 2009 2010 2011 2012 2009 2010 2011 2012 2009 2010 2011 2012 Busia (Uganda Kenya) Gatana (Uganda Rwanda) Mutukula (Tanzania Uganda)
Figure 7. Rice trade flow at various border points (in metric tons).
Figure 7. Flux commerciaux de riz à différents points de passage frontaliers (en tonnes). EAGC RATIN (www.ratin.net).
to develop and implement a modern, user-friendly, reliable, accessible, and low-cost system that is appreciated and used by the stakeholders. We have also learned that partnership and collaboration is paramount in making the process work. Critical to the success of the system have been stakeholder consultations to ascertain their needs for market information and designing a system that meets those needs.
A holistic approach and figuring out a sustainable business model for provi-sion of market information is extremely important. A piecemeal approach and a
pick-and-choose process in the fund-ing of a market information system can be detrimental to the overall success and sustainability of the system. Crowdsourcing, pooling of resources, partnerships and collaboration among organizations and institutions with an interest, and a mandate in market information is a potential strategy that can greatly boost the viability, success, and sustainability of a market informa-tion. It eliminates or reduces duplica-tion, enables sharing of services, and avails more resources which are neces-sary for market information, both as a public good and a private good,
contributing to enhancing regional trade, providing evidence for policy responses, and supporting business and policy decision-making.&
References
AATF, 2004. A New Bridge to Sustainable Agri-cultural Development in Africa. Nairobi (Kenya): African Agricultural Technology Foundation.http:// aatf-africa.org/userfiles/AATF_Annual_Report.pdf
EAC, 2011. 4th EAC Development Strategy
2011/12-2015/16. Arusha (Tanzania): East Africa Community. http://www.eac.int/index. php?option=com_docman&task=cat_view&gi-d=155&Itemid=163