6
EUROPEAN
ECONOMY
Economic and Financial AffairsISSN 2443-8022 (online)
EUROPEAN ECONOMY
Pension Reforms in the
EU since the Early 2000’s:
Achievements
and Challenges
Ahead
Giuseppe Carone, Per Eckefeldt, Luigi
Giamboni, Veli Laine and Stéphanie
Pamies Sumner
European Economy Discussion Papers are written by the staff of the European Commission’s
Directorate-General for Economic and Financial Affairs, or by experts working in association with them, to inform discussion on economic policy and to stimulate debate.
The views expressed in this document are solely those of the author(s) and do not necessarily represent the official views of the European Commission.
Authorised for publication by Lucio Pench, Director for Fiscal Policy and Policy Mix.
LEGAL NOTICE
Neither the European Commission nor any person acting on its behalf may be held responsible for the use which may be made of the information contained in this publication, or for any errors which, despite careful preparation and checking, may appear.
This paper exists in English only and can be downloaded from
http://ec.europa.eu/economy_finance/publications/.
Europe Direct is a service to help you find answers to your questions about the European Union.
Freephone number (*):
00 800 6 7 8 9 10 11
(*) The information given is free, as are most calls (though some operators, phone boxes or hotels may charge you).
More information on the European Union is available on http://europa.eu. Luxembourg: Publications Office of the European Union, 2016
KC-BD-16-042-EN-N (online) KC-BD-16-042-EN-C (print)
ISBN 978-92-79-59958-3 (online) ISBN 978-92-79-59959-0 (print)
doi:10.2765/620267 (online) doi:10.2765/04018 (print)
© European Union, 2016
European Commission
Directorate-General for Economic and Financial Affairs
Pension Reforms in the EU since the Early
2000's:
Achievements and Challenges Ahead
Giuseppe Carone, Per Eckefeldt, Luigi Giamboni, Veli Laine, Stéphanie
Pamies Sumner
Abstract
Most EU Member States have carried out substantial pension reforms over the last decades in order to enhance fiscal sustainability, while maintaining adequate pension income. The intensity of pension reforms has been particularly strong since 2000. These reforms have been implemented through a wide range of measures that have substantially modified the pension system rules and parameters. One of the most important elements of pension reforms, aside of whether countries engaged or not in a systemic change, has been the introduction of mechanisms aimed at automatically adjusting (indexing) the key pension parameters (pension age, benefits, financing resources) to demographic pressure (e.g. changes in life expectancy, increase in the dependency ratio). Indeed, since the mid-1990's, half of the EU Member States have adopted either automatic balancing mechanisms, sustainability factors and / or automatic links between retirement age and life expectancy. All these pension reforms are projected to have a substantial impact on containing future pension expenditure trends. According to the latest long-term projections in the 2015 Ageing Report, public pension expenditure is projected to be close to 11% of GDP over the long run in the EU, almost the same as in 2013.
However, the fiscal impact of ageing is still projected to be substantial in many EU countries, becoming apparent already over the course of the next two decades. This is also due to the very gradual phasing in of already legislated reforms, an issue that raises questions about the intergenerational fairness of the reforms and poses some doubt on the time-consistency of their implementation. Indeed, the sustainability-enhancing pension reforms legislated in a majority of EU countries will lead to a reduction of generosity of public pension schemes for future generations of retirees. But to make sure that these reforms will not have to face political and social resistance and risk of reversal in the moment they start to be implemented in full, other "flanking" policy measures are likely to be necessary: for example, reforms that boost retirement incomes by effectively extending working lives and employability of older workers (also through flexible working arrangements that allow people to keep working beyond current formal retirement age and to step down gradually from full-time to part-time to very part-time work) and provide other means of retirement incomes (e.g. private pensions) and appropriate social safety nets to avoid that people fall into poverty in old age.
JEL Classification:H55, J26, J1.
Keywords:Pensions, ageing population, public expenditure, debt, deficit, potential growth, structural
reforms, retirement age, older workers, longevity risk.
Acknowledgements: We would like to thank Etienne Sail and Pedro Arevalo for statistical
assistance, Lucio Pench (Director, DG ECFIN, European Commission) for helpful comments and suggestions and all the members of the Ageing Working Group as this paper draws heavily on their work related to the 2015 Ageing Report. The views expressed in this paper are those of the author(s) and do not necessarily represent those of the European Commission.
Contact:Unit C2 Sustainability of Public Finances, European Commission, Directorate-General for
3
CONTENTS
1. Introduction ... 5
2. Trends in pension reforms: an area of decisive policy action challenged by the 2008-09 financial crisis ... 6
2.1. (Public) pension reforms: main overall trends... 8
2.1.1. European countries substantially reformed their (public) pension system through a succession of parametric reform ... 8
2.1.2. Several European countries enacted systemic pension reforms ... 14
2.1.3. Accompanying measures to ensure lasting success of implemented reforms, preserve adequacy and further harmonise pension rules ... 18
2.2. (Public) pension reforms in the wake of the 2008-2009 financial crisis ... 19
2.3. EU pension reforms in international perspective ... 24
3. The budgetary impact of pension reforms: an overall reduction of projected spending trends ... 26
3.1. Introduction ... 26
3.2. Comparing the Projections ... 28
3.3. Short-term accuracy of pension projections ... 32
4. The impact of pension reforms on the financial balance of pension systems and the adequacy of pensions ... 35
4.1. The financial balance of pension systems after a decade of reforms ... 35
4.2. Adequacy of pension systems after a decade of reforms ... 40
5. Conclusions: policy options to address remaining challenges ... 42
5.1. Evolving policy challenges ... 42
4
ANNEX
Additional graphs and tables ... 46
5
1.
INTRODUCTION
Most EU Member States have carried out gradual and in some cases substantial pension reforms over the last decades in order to enhance fiscal sustainability, while maintaining adequate pension income. The intensity of pension reforms has been particularly strong since 2000. These reforms have been implemented through a wide-range of measures that have modified substantially the pension system rules and parameters (e. g. pension age, retirement incentives, pension calculation, indexation, social contributions). Pension reforms have generally been implemented only gradually and over long time periods. Several Member States have additionally adopted more systemic reforms, by strongly supporting the introduction of new pillars and / or radically changing the nature of their public pension schemes. Moreover, more than half of the EU Member States have now introduced automatic mechanisms, linking key pension system parameters to life expectancy.
The great recession that hit the European Union in 2008-09 prompted in many countries an acceleration of sustainability-enhancing pension reforms, through the adoption of additional measures with sometimes short-term impacts. In some cases, partial or full reversals of past systemic reforms were observed.
The projected low birth rates and expected continued increases in life expectancy will result in an almost unchanged, but much older, population by 2060. The EU is expected to move from having about four working-age people (aged 15-64) for every person aged over 65 to a ratio of only two to one. On account of the expected reduction of the working population in Europe, potential growth is likely to be much lower than experienced in previous decades, and the need for public provision of age-related transfers and services will at the same time increase.
On the one hand, it should be acknowledged that there has been considerable progress with pension reforms. The improvements are already visible, for instance with regard to employment rates that have risen on account of pension reforms, especially among older workers. Moreover, pension reforms display a substantial impact on containing future pension expenditure trends. According to the latest long-term projections in the 2015 Ageing Report, public pension expenditure is projected to be close to 11% of GDP over the long run in the EU, almost the same as in 2013.
On the other hand, the fiscal impact of ageing is still projected to be substantial in many EU countries, becoming apparent already over the course of the next decade, also because of the very gradual phasing in of already legislated reforms, an issue that raises questions about the intergenerational fairness of the reforms and poses some doubt on the time-consistency of their implementation. Indeed, the sustainability-enhancing pension reforms legislated in a majority of EU countries will lead to a reduction of generosity of public pension schemes for future generation of retirees. This has reduced the expenditure-increasing effects of demographic change in the long-term. But to make sure that these reforms will not have to face political and social resistance in the moment they start to be implemented in full, other reforms are likely to be necessary: for example, reforms that boost retirement incomes by effectively extending working lives and provide other means of retirement incomes (e.g. private pensions). Hence, more needs to be done in this respect.
This paper draws heavily on the wealth of information contained in the five vintages of the joint EC (ECFIN) and EPC (AWG) Ageing Reports (published in 2001, 2006, 2009, 2012 and 2015). The paper is organised as follows. Chapter 2 analyses the features of the pension reforms over the last decade. Chapter 3 assesses the budgetary savings resulting from the estimated impact of pension reforms, making use of the 5 vintages of long-term budgetary projections (released in 2001, 2006, 2009, 2012 and 2015), carried out jointly by the Commission services (DG ECFIN) and the group of Member States' experts on ageing (the AWG, attached to the Economic Policy Committee). Chapter four describes the impact of the reforms on the actuarial fairness, the financial sustainability and the adequacy of EU pension systems. The paper concludes by describing remaining challenges and policy options.
6
2.
TRENDS IN PENSION REFORMS: AN AREA OF DECISIVE
POLICY ACTION CHALLENGED BY THE 2008-09
FINANCIAL CRISIS
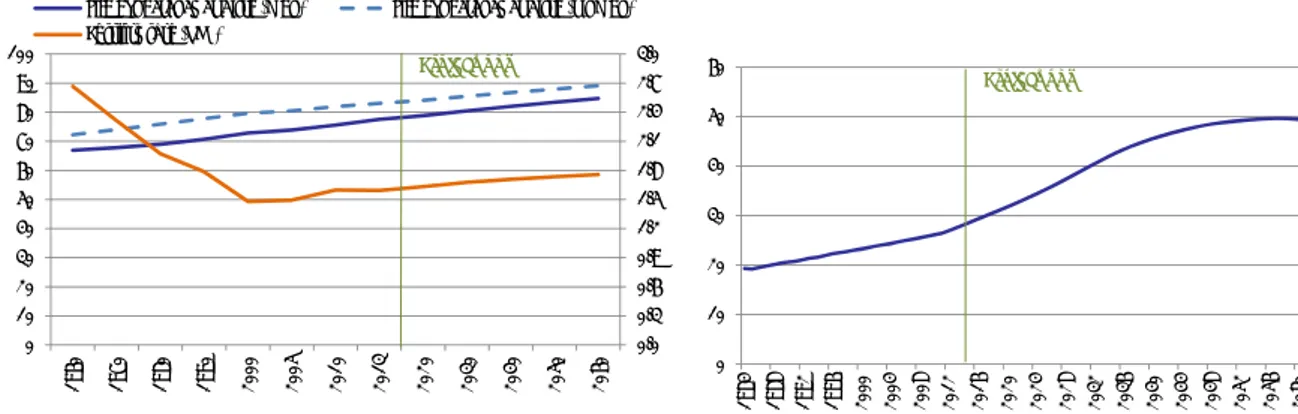
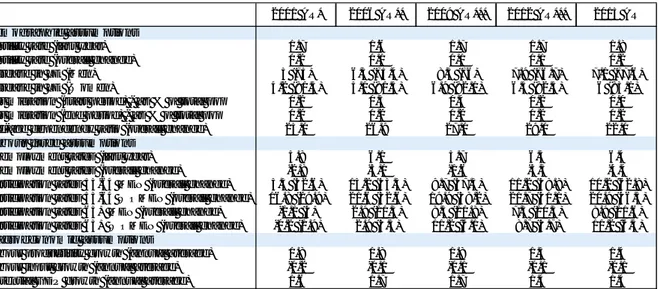
The age structure of the EU population is projected to dramatically change in the coming decades, due in particular to an increasing longevity and low fertility (see Graph 1). The demographic old-age dependency ratio (people aged 65 or above relative to those aged 15-64) is projected to increase from less than 25% in 2001 to around 50% in 2060 (according to the Ageing Report 2015 - see Graph 2). This long-term increase was even projected to be higher in the previous vintages of the Ageing Report (for example, + 25 pp. in 2001 - see Table 1). This population ageing trend poses important fiscal sustainability challenges in the medium and long term, as (all else being equal) larger cohorts of pensioners put pressures on public pension expenditures (the additional EU average spending - without taking into account other effects1 - due to the "ageing" effect has been estimated at around + 7½ pp. of GDP in the long term in the different vintages of the Ageing Reports).
Graph 1. Actual and projected life expectancy Graph 2. Actual and projected old-age
and fertility rate in the EU (2015 AR) dependency ratio in the EU (65+/ 15-64 –2015 AR)
Source: Ageing Report (2015)
Table 1. Main demographic assumptions through the different AR vintages (EU average)
* BE, DK, DE, EL, ES, FI, IE, IT, LU, NL, AT, PT, FI, SE, UK ** All MSs except EL, BG, RO & HR
*** All MSs except HR
Source: Ageing Report (2001 to 2015), Eurostat
1
This estimation corresponds to the change in public pension expenditure due to the dependency ratio component (holding constant other factors such as the coverage ratio, the benefit ratio or the labour market ratio i. e. not taking into account the impact of pension reforms, see section 3 of the paper).
0.0 0.3 0.6 0.9 1.2 1.5 1.8 2.1 2.4 2.7 3.0 0 10 20 30 40 50 60 70 80 90 100 196 0 197 0 198 0 199 0 200 0 200 5 201 0 201 3 202 0 203 0 204 0 205 0 206 0
Life expectancy at birth (men) Life expectancy at birth (women) Fertility rate (RHS) Projections 0 10 20 30 40 50 60 19 8 4 19 8 8 19 9 2 19 9 6 20 0 0 20 0 4 20 0 8 20 1 2 20 1 6 20 2 0 20 2 4 20 2 8 20 3 2 20 3 6 20 4 0 20 4 4 20 4 8 20 5 2 20 5 6 20 6 0 Projections
2001 AR* 2006 AR** 2009 AR*** 2012 AR*** 2015 AR
Fertility rate (convergence value) 1.7 1.6 1.7 1.7 1.8 Increase in LE (Men) 5.0 6.3 8.9 7.9 7.1 Increase in LE (Women) 4.2 5.1 7.2 6.5 6.0 Migration (start period) - as % of total pop 0.2 0.3 0.4 0.2 0.0 Migration (end period) - as % of total pop 0.2 0.2 0.2 0.2 0.2
7
In order to enhance fiscal sustainability, while maintaining adequate pension income, most EU Member States have carried gradual and substantial pension reforms over the last decades. 2 The intensity of pension reforms has been particularly strong since 2000 (see Graph 3). These reforms generally comprised a wide-range of measures (see Graph 4). Most European countries modified substantially their pension system rules and parameters (e. g. pension ages, retirement incentives, pension calculation, indexation, social contributions). Pension reforms are often implemented gradually over long time periods. Several Member States additionally adopted more systemic reforms, by strongly supporting the introduction of new pillars and / or radically changing the nature of their public pension schemes (see section 2.1.2). Moreover, the great recession that hit the European Union in 2008-09 prompted in many countries an acceleration of sustainability-enhancing pension reforms, through the adoption of additional measures, with sometimes short-term impacts. In some cases, partial or full reversals of past systemic reforms were also observed (see section 2.2).
Graph 3. Number of (main) pension measures Graph 4. Decomposition of (main) pension
in the EU since the 1990's measures in the EU since the mid-2000's
Source: Authors calculation based on the Ageing Report (2009, 2012, 2015), European Economy (2007), SPC 2015 Report, OECD (2012, 2014, 2015).
Notes: i) These figures are based on the main pension measures adopted by EU countries as reported in the different papers quoted (both for public and private pensions). They are not necessarily comprehensive and involve to some extent a subjective analysis. ii) Pensions measures have been decomposed in 5 broad categories: eligibility measures (e. g. pension ages, required contributory period), pension formula (e. g. definition of pensionable earnings, accrual rates, valorisation), indexation (for pensions in payment), resources (e. g. social contributions, taxes) and schemes (merge or closure of pension schemes).
Based on the rich set of information contained in the five Ageing Reports published jointly by the European Commission (DG ECFIN) and the Economic Policy Committee, this chapter describes the main reforms in the EU over the last decade. Section 2.1.1 highlights the main overall trends in terms of parametric pension reforms, while section 2.1.2 focuses on a subset of countries, which additionally adopted more systemic reforms. While these first two sections put the emphasis on sustainability-enhancing measures (that has been the main objective of pension reforms over the last decades3), section 2.1.3 provides a brief discussion of accompanying pension measures aimed at improving adequacy or further harmonising public pension schemes 4.
2
Projected increases in pension expenditure can pose significant challenges to fiscal sustainability. See Carone et al. (2014) for a coherent framework for assessing fiscal sustainability challenges.
3
This is also the focus of this paper.
4
See Table A.1 in the Annex for an overview of the main type of reforms adopted by country according to their intensity.
0 10 20 30 40 50 60 70 19 90 19 91 19 92 19 93 19 94 19 95 19 96 19 97 19 98 19 99 20 00 20 01 20 02 20 03 20 04 20 05 20 06 20 07 20 08 20 09 20 10 20 11 20 12 20 13 20 14 Creation of EPC
-AWG & SPC Financial crisis schemes7%
eligibility 32% pension formula 28% indexation 12% contributions / taxes 21%
8
2.1. (PUBLIC) PENSION REFORMS: MAIN OVERALL TRENDS
2.1.1. European countries substantially reformed their (public) pension system through a succession of parametric reform
Increasing retirement ages
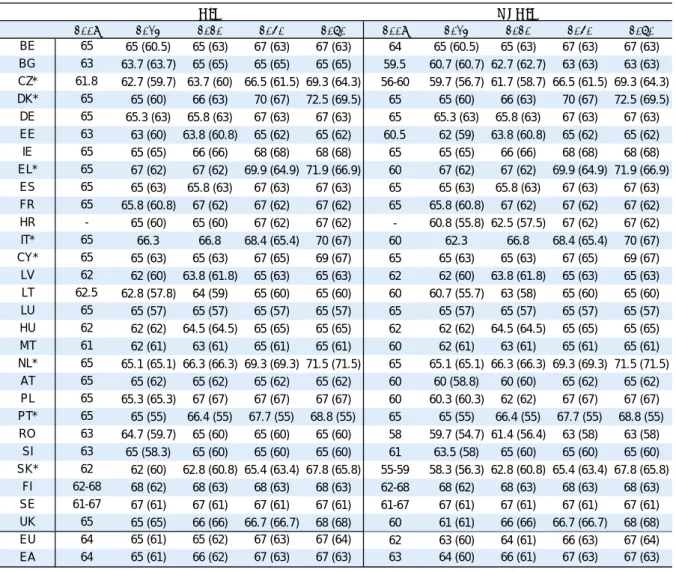
Over the last decade(s), the most common measure adopted to address pension sustainability challenges in the EU has consisted of raising pension ages. Indeed, nearly all European countries have increased the level of early and statutory retirement ages (the only exception being Luxembourg). In some cases (e.g. Greece, Sweden, France and Finland), particularly large increases have been legislated between 2008 and 2013 (see below). Looking forward, according to the Ageing Report 2015, only Luxembourg and Sweden have not legislated (further) rises of pension ages. Austria and Slovenia also project increases limited to women (in order to harmonise pension age between genders). The largest progression of statutory retirement age over the period 2008 – 2060 is projected in Denmark, the Czech Republic, Greece, Italy and Slovakia (see Table 2). However, despite this common upward trend, an important dispersion of pension ages should remain in the long run: for example, in 2060, the statutory retirement age should be as high as 72.5 in Denmark (for both men and women) against 63 for women in Bulgaria (see Graphs 5 and 6).5 At this date, the norm in terms of statutory retirement age should be around 67 against 65 for men and 63 for women currently (see Table 2). Comparing the last two vintages of the Ageing Report (2012 and 2015), a significant upward revision (by close to one year) of the projected increase of the statutory retirement age can be observed (see Table 3).
As the effective exit age from the labour market tends to be lower than the legal pension age, most Member States also introduced different measures in order to change the incentives to retire (with the effect of reducing relative pension benefits, see next sub-section):
• Pathways to early retirement, many of which were introduced in the 1970's in response to rising unemployment (e.g. specific early retirement schemes, use of unemployment or sickness insurance schemes for older workers), have been closed to new entrants or severely restricted (including disability pensions) in most of European countries (e.g. Spain, France, Netherlands, Austria, Romania, Finland, Sweden);
• Increases in the number of years of contributions required to receive a (full) pension have also been a frequent feature of pension reform packages (the average contributory period estimated at around 34 years on average at the EU level in 2014 is projected to increase by 4 years to around 38 years in 2060, according to the Ageing Report 2015);
• The introduction of bonuses / penalties paid / imposed on people retiring after / before the normal pension age is frequently observed (such incentives currently exist in 18 EU countries - see Ageing Report 2015);
• Easing of the conditions to cumulate pension and wage (e. g. Czech Republic, Spain, Romania). Some countries even abolished the notion of statutory retirement age (e.g. in Sweden, where the retirement age is flexible6, and in the UK, where the State pension age corresponds to the age after which a public pension can be received, whether or not the individual has retired).
5
The impact of the 2015 Bulgarian pension reform has not been taken into account in this paper.
6
Although laws on employment protection stipulate that an individual is entitled to stay in employment until his / her 67th birthday, but not after that.
9 Table 2. Statutory and early retirement ages (in bracket)
Source: Ageing Report (2009, 2015), updated for Belgium (November 2015)
Notes: See the 2015 Ageing Report for additional information on these figures. Countries with a * have introduced an automatic link between the retirement age and life expectancy. The EU/EA figures are simple averages.
Table 3. Projected change in the statutory retirement age in the EU: 2012 AR versus 2015 AR
Source: Ageing Report (2012, 2015), updated for Belgium (November 2015)
2008 2013 2020 2040 2060 2008 2013 2020 2040 2060 BE 65 65 (60.5) 65 (63) 67 (63) 67 (63) 64 65 (60.5) 65 (63) 67 (63) 67 (63) BG 63 63.7 (63.7) 65 (65) 65 (65) 65 (65) 59.5 60.7 (60.7) 62.7 (62.7) 63 (63) 63 (63) CZ* 61.8 62.7 (59.7) 63.7 (60) 66.5 (61.5) 69.3 (64.3) 56-60 59.7 (56.7) 61.7 (58.7) 66.5 (61.5) 69.3 (64.3) DK* 65 65 (60) 66 (63) 70 (67) 72.5 (69.5) 65 65 (60) 66 (63) 70 (67) 72.5 (69.5) DE 65 65.3 (63) 65.8 (63) 67 (63) 67 (63) 65 65.3 (63) 65.8 (63) 67 (63) 67 (63) EE 63 63 (60) 63.8 (60.8) 65 (62) 65 (62) 60.5 62 (59) 63.8 (60.8) 65 (62) 65 (62) IE 65 65 (65) 66 (66) 68 (68) 68 (68) 65 65 (65) 66 (66) 68 (68) 68 (68) EL* 65 67 (62) 67 (62) 69.9 (64.9) 71.9 (66.9) 60 67 (62) 67 (62) 69.9 (64.9) 71.9 (66.9) ES 65 65 (63) 65.8 (63) 67 (63) 67 (63) 65 65 (63) 65.8 (63) 67 (63) 67 (63) FR 65 65.8 (60.8) 67 (62) 67 (62) 67 (62) 65 65.8 (60.8) 67 (62) 67 (62) 67 (62) HR - 65 (60) 65 (60) 67 (62) 67 (62) - 60.8 (55.8) 62.5 (57.5) 67 (62) 67 (62) IT* 65 66.3 66.8 68.4 (65.4) 70 (67) 60 62.3 66.8 68.4 (65.4) 70 (67) CY* 65 65 (63) 65 (63) 67 (65) 69 (67) 65 65 (63) 65 (63) 67 (65) 69 (67) LV 62 62 (60) 63.8 (61.8) 65 (63) 65 (63) 62 62 (60) 63.8 (61.8) 65 (63) 65 (63) LT 62.5 62.8 (57.8) 64 (59) 65 (60) 65 (60) 60 60.7 (55.7) 63 (58) 65 (60) 65 (60) LU 65 65 (57) 65 (57) 65 (57) 65 (57) 65 65 (57) 65 (57) 65 (57) 65 (57) HU 62 62 (62) 64.5 (64.5) 65 (65) 65 (65) 62 62 (62) 64.5 (64.5) 65 (65) 65 (65) MT 61 62 (61) 63 (61) 65 (61) 65 (61) 60 62 (61) 63 (61) 65 (61) 65 (61) NL* 65 65.1 (65.1) 66.3 (66.3) 69.3 (69.3) 71.5 (71.5) 65 65.1 (65.1) 66.3 (66.3) 69.3 (69.3) 71.5 (71.5) AT 65 65 (62) 65 (62) 65 (62) 65 (62) 60 60 (58.8) 60 (60) 65 (62) 65 (62) PL 65 65.3 (65.3) 67 (67) 67 (67) 67 (67) 60 60.3 (60.3) 62 (62) 67 (67) 67 (67) PT* 65 65 (55) 66.4 (55) 67.7 (55) 68.8 (55) 65 65 (55) 66.4 (55) 67.7 (55) 68.8 (55) RO 63 64.7 (59.7) 65 (60) 65 (60) 65 (60) 58 59.7 (54.7) 61.4 (56.4) 63 (58) 63 (58) SI 63 65 (58.3) 65 (60) 65 (60) 65 (60) 61 63.5 (58) 65 (60) 65 (60) 65 (60) SK* 62 62 (60) 62.8 (60.8) 65.4 (63.4) 67.8 (65.8) 55-59 58.3 (56.3) 62.8 (60.8) 65.4 (63.4) 67.8 (65.8) FI 62-68 68 (62) 68 (63) 68 (63) 68 (63) 62-68 68 (62) 68 (63) 68 (63) 68 (63) SE 61-67 67 (61) 67 (61) 67 (61) 67 (61) 61-67 67 (61) 67 (61) 67 (61) 67 (61) UK 65 65 (65) 66 (66) 66.7 (66.7) 68 (68) 60 61 (61) 66 (66) 66.7 (66.7) 68 (68) EU 64 65 (61) 65 (62) 67 (63) 67 (64) 62 63 (60) 64 (61) 66 (63) 67 (64) EA 64 65 (61) 66 (62) 67 (63) 67 (63) 63 64 (60) 66 (61) 67 (63) 67 (63) MEN WOMEN 2012 AR 2015 AR 2012 AR 2015 AR Average absolute increase (2060 - base year) 1.8 2.6 3.2 4.0
Number of countries projecting an increase 15 23 17 25
10
Graph 5. Statutory retirement age, male Graph 6. Statutory retirement age, female
Source: Ageing Report (2015)
Notes: From 2040 onwards, the lowest statutory retirement age for males is 65 for most Member States, therefore countries are not reported below the average in Graph 5.
Because of the pension reforms that increase the statutory retirement age in a majority of Member States, longer working lives are projected, leading to an increase in the effective exit age from the labour market by about 2 years by 2060 in the EU (up by 1.8 years for men and by 2.3 years for women) (see Graph 7). Hence, the increase in the effective exit age is not projected to increase at the same pace as the statutory retirement age due to higher incidence of disability at higher ages and the prevalence of other pathways out of the labour force.
Graph 7. Effective exit age from the labour market, males and females
Source: Ageing Report (2015)
64.5 65.2 66.5 67.1 55 60 65 70 75 55 60 65 70 75 2013 2020 2040 2060 MALE EL* (67) IT* (66.3) FR (65.8) EL* (67) FR (67) PL (67) DK* (70) EL* (69.9) NL* (69.3) DK* (72.5) EL* (71.9) NL* (71.5) LV (62) HU (62) MT (62) SK* (62) CZ* (63.7) MT (63) SK* (62.8) 63.0 64.4 66.3 67.0 55 60 65 70 75 55 60 65 70 75 2013 2020 2040 2060 FEMALE EL* (67) FR (65.8) DE (65.3) EL* (67) FR (67) IT* (66.8) DK* (70) EL* (69.9) NL* (69.3) DK* (72.5) EL* (71.9) NL* (71.5) CZ* (59.7) RO (59.7) SK* (58.3) CZ* (61.7) RO (61.4) AT (60) BG (63) RO (63) BG (63) RO (63)
11
On average in the EU, despite the increase in both statutory retirement age and effective exit age from the labour market, the duration of retirement is expected to increase by about 3 years for men and by 1 ½ for women over the long term (see Graphs 8 and 9). The lower increase in the duration of retirement up to 2060 for females is due to the fact that some countries (Bulgaria, Czech Republic, Croatia, Italy, Lithuania, Malta, Austria, Poland, Slovakia, the United Kingdom) are equalising the statutory retirement age for men and women gradually through a more marked increase for females.
Graph 8. Duration of retirement, male Graph 9. Duration of retirement, female
Source: Ageing Report (2015)
Reducing relative pension benefits
In addition to measures adopted to curtail eligibility trough increasing retirement age and closing alternative pathways to early retirement, another set of measures (on the number of years and valorisation of pensionable earnings, indexation of pensions in payment, calculation of accruals) aimed at reducing relative public pension generosity (in terms of benefits) has also been legislated by many EU countries (see Table 4). These parametric changes concern both the calculation of the first pension in payment, as well as the way it is valued over time (indexation of pensions in payment). First, several countries have extended the period over which earnings are taken into account for the calculation of the first pension, instead of restricting pensionable earnings to a limited number of final and / or best salaries. This measure has the effect of reducing pension benefits, given the normal upward slope to the age-earnings profile for most workers7. Indeed, pensionable earnings reference have moved to a (quasi-) lifetime average earnings measures in as many as 18 Member States. Only Spain, France, Lithuania, Malta, Austria and Slovenia still define, under current legislation, pensionable earnings over a restricted career period (see Table A3 in Annex for a comparison between the pensionable earnings reference in the 2015 AR compared to the 2006 AR). As an additional measure to curtail benefits, many countries have moved to a less generous valorisation rule, used to adjust past earnings to changes in living standards, between the time pension rights are accrued and when they are claimed (see Table A4 in Annex for a comparison between the valorisation rule used in the 2015 AR compared to the 2006 AR). Only a few countries adopted a strict pure price-valorisation rule (like in France, Belgium and Portugal). Several Members states adopted instead a mix of partial nominal wage - nominal price valorisation (e. g. Greece, Croatia, Romania, and Finland), while half of the EU countries kept the more generous wage-valorisation rule. Other countries chose to reduce annual
accrual rates either directly (e. g. Greece, Italy, Luxembourg, Austria, Slovakia), or indirectly via, for
example, an increase of the contributory period to receive a full pension (e. g. Belgium, France), the use of penalties for early retirement (see previous sub-section), or the introduction of a "sustainability factor" linked to changes in life expectancy (see Table 7).
7
Of course, such measures do not concern countries, where public pension schemes mainly provide a flat-rate pension (e. g. Denmark, Ireland, Netherlands and the UK).
17.2 17.5 18.7 20.1 10 15 20 25 30 10 15 20 25 30 2013 2020 2040 2060 MALE MT (20.6) ES (18.6) LU (18.6) MT (20.4) LU (19.3) SE (19.2) LU (21.2) SE (21) MT (20.7) LU (22.9) SE (22.7) MT (22.4) HR (15) BG (14.6) RO (14.5) LV (15.4) PL (15.1) BG (15) HR (16.9) EL* (16.8) DK* (16.3) EL* (16.8) NL* (16.4) DK* (15.6) 22.0 21.5 22.1 23.4 10 15 20 25 30 10 15 20 25 30 2013 2020 2040 2060 FEMALE AT (25.5) IT* (24.6) AT (26.3) MT (23.8) PL (22.9) LU (24.4) MT (24) FI (24) LU (26.1) MT (25.7) FI (25.7) HU (20.5) DK* (20.2) EL* (19.1) BG (19.9) EL* (19.8) HU (19.1) NL* (20.2) EL* (19.1) DK* (19) NL* (19.2) EL* (19) DK* (18.2)
12
Graph 10. Average accrual rates for new pensions over the period 2010-2060 (%):2012 AR versus 2015 AR
Source: Ageing Report (2012, 2015)
Notes: See Graph A1 in the Annex for complementary data on accrual rates' projections.
Finally, another parametric reform used to reduce pension benefits progression has been the shift in several Member States towards less generous adjustment rules for pensions in payment. Indeed, many EU countries have moved from adjusting pension benefits to wages to a full or partial indexation to prices (see Graph 11 and table A.5 in the Annex). Full indexation to prices is again relatively rare however (it is the case in France, Italy, Hungary and Austria; see Table 4). A majority of Member States adopted instead a partial indexation rule to prices (for example, indexation mix of wages and prices – Swiss formula, or of wages and GDP). In addition, some countries introduced a "sustainability factor" or other "reduction coefficients" into the indexation calculation (see below). This is the case in particular in Spain with the introduction of an index for adjusting pensions in payment, projected to progress less quickly than inflation (for details see the Ageing Report 2015)8.
Graph 11. Evolution of pension indexation rules in EU Member States since the 2001 AR (% of total EU
countries whose indexation rule is based on…)
Source: Ageing Report (2001, 2015)
Notes: Indexation rules are spread between pure (or less) price-indexation rules ("prices-"), pure wage-valorisation rules ("wages+") and indexation rules based on a combination of variables (prices, wages, GDP, etc.). Moreover, in a few countries, there is no explicit indexation rule.
8
The UK, on the other hand, moved in the opposite direction, returning to earnings indexation after having adopted price linking in the early 1980's. This is linked to the low level of public pension replacement rate and benefit ratio in this country. More generally, countries with less generous public pension systems have somehow adopted less restrictive measures (see below). 1.0 1.2 1.4 1.6 1.8 2.0 2010 2014 2020 2030 2040 2050 2060 EU 2015 AR (weighted average, without SF)
EU 2012 AR (weighted average, without SF)
0% 10% 20% 30% 40% 50% 60% 70%
prices- mix wages+ no rule 2001 AR 2015 AR
13
On top of pension measures affecting the expenditure side, many Member States relied on
revenue-enhancing measures in order to balance public pension schemes. Several countries increased social
contribution rates (e.g. Denmark, France), especially after the crisis (e. g. Bulgaria, Cyprus, Poland, Portugal, Finland, UK). Some EU Member States ear-marked tax revenue for the public pension system (e.g. 1 point of VAT in Germany). Other countries raised civil servants' contributions (e. g. Ireland, France, Cyprus, Portugal, UK) and / or reduced tax reliefs / allowances on pension benefits (e.g. Ireland, France, Cyprus, Latvia, Romania). Moreover, Germany introduced a balancing mechanism whereby contributions are quasi-automatically adjusted to ensure the financial equilibrium of the public pension system. Finally, a growing number of countries (15), while maintaining the unfunded nature of their public pension system, have introduced reserve funds to be used to finance the projected increase of spending (e.g. Ireland, France, see Tables 5 and 6 below).
Table 4. Key parameters defining public pension benefits in the EU (old-age pensions)
Source: Ageing Report (2015)
Notes: A more detailed and comprehensive description of the EU Member States pension systems is in The 2015 Ageing Report – Underlying assumptions and projections methodologies, European Economy 8 – 2014.
BG Pensionable earnings reference is full career starting from 1997. 3 Best years before 1997 CZ Pensionable earnings reference is full career back to 1986. Currently 30 years to be considered. EL Pensionable earnings reference is full career starting from 2011. Best 10 years before 2011.
ES Pensionable earnings reference is last 25 years as of 2022. The maximum value of the valorisation rule is close to prices. The IPR is established annually at a level consistent with a balanced budget of the Social Security system over the medium run.
FR The pensionable earnings reference is full career in AGIRC and ARRCO. Valorisation rule and indexation rules are price - 1% in both AGIRC and ARRCO in 2014 and 2015. AGIRC: Association générale des institutions de retraite des cadres; ARRCO: Association pour le régime de retraite complémentaire des salariés; CNAVTS: Caisse nationale de l'assurance vieillesse des travailleurs salariés.
LT Pensionable earnings reference is 25 best years after 1994 and 5 best years for the period 1984-1993. LU Indexation rule is wages if sufficient financial resources available, otherwise only cost of living indexation. HU Pensionable earnings reference is full career back to 1988.
MT Pensionable earnings reference rule applies to people born as of 1962
AT Pensionable earnings reference is converging towards the best 40 years in 2028. Currently 25 best years
PT Pensionable earnings reference is full career as of 2002. 10 best years out of last 15 before 2002. Price and wage valorisation rule applies to earnings registered between 2002 and 2011.
RO Price valorisation and indexation after 2030.
SK Pensionable earnings reference is full career back to 1984.
Prices Mixed, not fixed indexation rule or not
applicable Wages
Prices BE (Full career), FR (25 best years) MT (10 best of last 40), PT (Full career)
Mixed, not fixed rule or not applicable
IE (Flat rate), EL (Full career), HR (Full career), LT* (25 best years), PL (Full career), RO (Full career), FI (Full career)
DK (Years of residence), NL (Years of residence)
Wages ES (Last 25), IT (Full career), HU (Full career), AT (40 best)
BG (Full career), CZ (Full career), EE (Full career), CY (Full career), LV (Full career), LU (Full career), SI (Best consecutive 24),
SK (Full career)
DE (Full career), SE (Full career), UK (Years of insurance contributions), NO
(Full career) General indexation variable(s)
G ene ra l v alo ri sa ti o n v aria b le (s )
14
2.1.2. Several European countries enacted systemic pension reforms 'Old' Member States
Next to parametric pension reforms, five 'old' Member States have adopted additionally systemic
reforms (as pointed out by Hering (2006); see Box 1). This is the case of Sweden, Italy, Greece, and
to some extent Germany and Austria. Sweden and Italy shifted at the end of the 1990's to an NDC (Notional Defined Contributions)9 public pension system, while gradually moving from a dominant pillar model to a multi-pillar one. Greece in 2010 introduced a basic pension and reformed the Defined benefit (DB) first pillar. In 2012, it transformed its second pillar in an NDC system, and more recently (in May 2016), legislated a new systemic pension reform (the new system, while curtailing pension benefits further, reflects most of the structural features of the 2010 and 2012 reforms).
Germany also reformed its public pension point system (1992 and 2004 reforms),10 which now presents features close to an NDC system, and encouraged private pensions. More recently, Austria introduced a new harmonised public pension scheme, more actuarially-oriented than previous schemes and based on individual pension accounts. A common feature of the ground-breaking reforms engaged by these countries is that, besides aiming at enhancing sustainability, they have tended to substitute relatively fragmented schemes with a more unified public scheme.
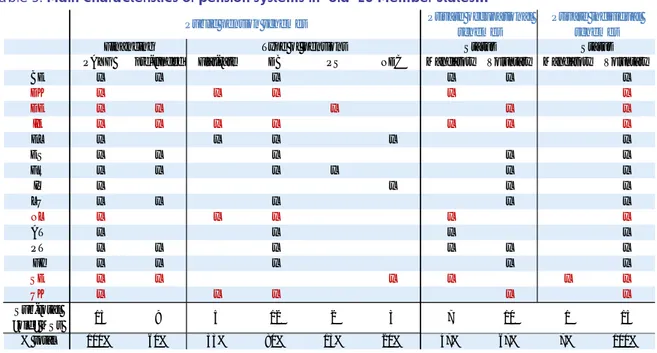
Table 5. Main characteristics of pension systems in "old" EU Member States…
Source: Ageing Report (2006, 2009, 2012, 2015)
* Legal framework for occupational schemes; however, not implemented so far.
Notes: i) in red, countries where private schemes currently provide substantial income to retired people (at least 10% of GDP), in blue, countries where they are expected to provide high share in the future (maturing schemes). ii) Pre-funding of public pension schemes refers to the existence of reserve funds in some countries set up to secure public pension schemes.
9
These schemes are designed to mimic most of the features of DC schemes. The pension depends on contributions, which are tracked in accounts earning a notional rate of return, but unlike DC plans, the rate of return is set by the government and often linked to wage or GDP growth. These schemes remain PAYG financed: no assets are accumulated.
10
In a point system, workers earn pension points based on their individual earnings for each year of contributions. At retirement, the sum of pension points is multiplied by a pension-point value to convert them into a regular pension payment.
PAYG pre-funded Flat-rate DB PS NDC Mandatory Voluntary Mandatory Voluntary
BE x x x x x x DK x x x x x DE x x x x x IE x x x x x x x EL x x x x x ES x x x x x FR x x x x x x IT x x x x LU x x x x x NL x x x x x AT x x x x PT x x x x x x FI x x x x x SE x x x x x x UK x x x x x Sub-total "old" MSs 15 9 5 12 2 3 7 10 1 15 % total 100% 60% 33% 80% 13% 20% 47% 67% 7% 100% Private occupational schemes Private individual schemes Public pension schemes
15
Box 1. SYSTEMIC PENSION REFORMS IN SELECTED "OLD" MEMBER STATES: THE CASE OF SWEDEN, ITALY,
GREECE, GERMANY AND AUSTRIA
Since the 1990's (more recently in Austria), Sweden, Italy, Germany and Austria initiated systemic reforms of their pension systems, in line (especially in Germany and Italy) with projected strong increases of their old-age dependency ratio (see Graph 12 for the levels projected in the Ageing Report 2009). Moreover, tax burdens were already relatively high at that time (especially in Sweden but also in Austria), making further increases in contribution rates untenable.
Graph 12. Old-age dependency ratio (% of population of 15-64)
Source: Ageing Report (2009)
• Sweden: in 1998, after a long process of consultation and research, Sweden enacted, with a large consensus, a radical pension reform, which was fully implemented in 2003 (Natalia and Stamati, 2013). This reform introduced new NDC rules for public pensions, as well as new (relatively small) supplementary DC pillars (the old system consisted mainly of a flat-rate pension and an earnings-related PAYG DB component). Private pensions, which represented around 20% of total pension expenditure in 2005 (according to Eurostat), should represent over a third of pension spending by 2060 (according to the Ageing Report 2015).
• Italy: with the 1992-93 and 1995 reforms, Italy adopted a NDC public pension system and moved towards a three-pillar structure. However, the phasing-in of the NDC system is very slow (as a comparison, while in Sweden the old DB system will be completely phased-out by 2020, in Italy it will be the case only by the mid-2030's, implying a full implementation of the reform over 35 years), and the coverage of supplementary pensions remains limited (thus additional measures were adopted before the crisis including higher fiscal incentives and "automatic" transfer to pension funds of severance pay for the private sector employees).
• Germany: since 1992, Germany, faced with the reunification costs as well as dramatic projected demographic changes, has substantially reformed its pension system. Through the 1992 and the 2004 reforms (introduction of contribution and sustainability factors), the German public pension point system has come close to an NDC system. Moreover, the 2001 Riester reform enacted the start of a progressive shift towards a multi-pillar system. In 2012, private pensions represented around 10% of total pension expenditure (according to Eurostat).
• Austria: in 2005, Austria introduced a new harmonised public pension system, more actuarially-oriented than prevailing schemes. Although based on individual pension accounts, the new system remains a PAYG DB system (closer to the German point system than to the Swedish NDC system, according to Knell et al, 2006). In parallel, two new private pension schemes have been introduced (the "new severance pay scheme" and the "premium-aided pension savings scheme") to encourage the expansion of second and third pillars. Even if the coverage of these schemes has increased during the last decade, private pensions remain limited in Austria.
0 10 20 30 40 50 60 70 2007 2010 2013 2016 2019 2022 2025 2028 2031 2034 2037 2040 2043 2046 2049 2052 2055 2058 DE IT AT SE EL EU27
16 'New' Member States
In response to population ageing pressures, and typically in the context of their transition to market economies, many 'new' European countries also enacted systemic pension reforms in the late
1990's – early 2000's. These reforms were largely influenced by the multi-pillar approach promoted
by the World Bank (1994), with a large role given to private individual pensions (Grech, 2010). Indeed, most of the "new" EU Member States introduced mandatory private individual schemes (e.g. Bulgaria, Estonia, Croatia, Latvia, Lithuania, Hungary11, Poland12, Romania and Slovakia13), while a smaller group of countries adopted mandatory private occupational schemes (e.g. Cyprus and Slovenia14). At the same time, some countries converted their old DB public pillar to a point system (e. g. Croatia, Cyprus, Romania and Slovakia) or an NDC system (e. g. Latvia and Poland). An important element is that the pre-funding of the new private pension schemes was often financed through the reallocation of part of the social contributions – taxes raised for the statutory PAYG public scheme.
11
These schemes were partially brought into the general government sector in 2011; the remaining schemes are now voluntary (see below).
12
In 2013, the part of assets of these schemes (OFE) held in government bonds has been shifted to the public NDC account. In 2014, the membership to these schemes became voluntary.
13
During their existence, the participation to these private individual schemes has changed several times from mandatory to voluntary for new comers.
14
In Cyprus and Slovenia, mandatory occupational schemes concern mainly public sector employees. In Lithuania, a legal framework for occupational private pensions has been adopted in 2006, but there are no occupational pensions so far. The same situation (as in Lithuania) prevails in Malta.
• Greece: In the recent years the Parliament adopted two comprehensive reforms of the main pension scheme (2010) and of the supplementary public pension scheme (2012). The first reforms aimed at simplify the highly fragmented pension system, enhance transparency and fairness, postpone the retirement age and decrease the generosity of benefits. The new rules on entitlements, contributions, valorisation and indexation of pension rights apply to all main schemes and pro rata to all current and future workers. The supplementary pension scheme has been transformed into a NDC scheme. In 2016 a new systemic pension reform has been legislated. It further curtails pension benefits by creating a closer link between contribution and benefit (by, among other things, abolishing the pro rata application of the previous reforms), while maintaining most of the structural features of the 2010 and 2012 reforms.
17
Table 6. Main characteristics of pension systems in "new" EU Member States
Source: Ageing Report (2006, 2009, 2012, 2015)
* Legal framework for occupational schemes; however, not implemented so far.
Notes: i) in red, countries where private schemes currently provide substantial income to retired people (at least 10% of GDP), in blue, countries where they are expected to provide high share in the future (maturing schemes). ii) Pre-funding of public pension schemes refers to the existence of reserve funds in some countries set up to secure public pension schemes
Addressing longevity risk through automatic mechanisms
One of the most important features of pension reforms over the last two decades, whether countries engaged or not in a systemic change, has been the introduction of mechanisms aimed at
automatically adjusting the key pension parameters (pension age, benefits, financing resources) to
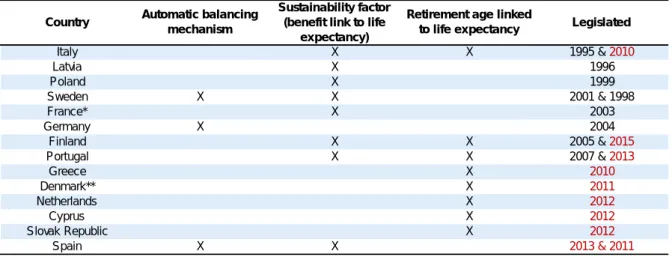
changes in life expectancy. Indeed, since the mid-1990's, half of the EU Member States have adopted either automatic balancing mechanisms, sustainability factors (i.e. a direct link between pension benefits and life expectancy) and / or automatic links between retirement age and life expectancy (see Tables 7 and 8).
At the time of the completion of the first Ageing Report (2001 AR), only four Member States (14% of EU countries) had introduced such mechanisms. Automatic balancing mechanisms ensure that the pension system will be able to remain financially sustainable by adjusting benefits' indexation and / or by social contributions when needed. Such balancing mechanisms exist only in three countries: in Sweden since 1998 (reduced indexation in case the pension system would show a deficit in the medium-term15 ), in Germany since 2004 (the contribution rate is automatically adjusted so that the statutory pension scheme is in balance, and pension indexation is reduced through a contribution rate factor and the sustainability factor) and in Spain since 2013 (reduced indexation when the pension system is in financial disequilibrium). The introduction of sustainability factors (i.e. of a factor that changes the size of the pension benefit depending on expected demographic changes, such as life expectancy at the time of retirement) has been more widespread (8 countries – although not fully automatic in France and in Denmark). Finally, several countries (8) have introduced an automatic link
between retirement ages and life expectancy, as early as in 1995 in Italy, and more recently in
15
This may be due to e.g. low returns on the pension fund assets or low wage (GDP) growth.
PAYG pre-funded Flat-rate DB PS NDC Mandatory Voluntary Mandatory Voluntary
BG x x x x x CZ x x x x EE x x x x x x HR x x x x x CY x x x x x LV x x x x x LT x x x* x x HU x x x x MT x x x x* x PL x x x x x RO x x x x SI x x x x x x SK x x x x Sub-total "new" MSs 13 6 1 7 4 2 5 6 7 12 % total 100% 46% 8% 54% 31% 15% 38% 46% 54% 92%
Public pension schemes Private occupational schemes
Private individual schemes
18
Greece, Slovakia and Finland. These countries are, not surprisingly, the ones projecting the highest increases in retirement age over the long run (especially for men; for women, harmonisation trends imply sometimes steep increases even in countries without such an automatic link). Few countries have introduced simultaneously two automatic adjustment mechanisms (e. g. Italy, Sweden, Portugal, Spain and Finland).
All in all, by 2015 half of the EU Member States (14 MSs) had introduced automatic mechanisms that enhance the sustainability of pension systems, and some of them had introduced more than one mechanism (see Table 8).
Table 7. Automatic mechanisms in public pension system in the EU
Source: Ageing Report (2015), updated for Finland Notes: in red, after 2009.
Table 8. Total number of automatic mechanisms in public pension system in the EU
Source: Ageing Report (2015), updated for Finland
2.1.3. Accompanying measures to ensure lasting success of implemented reforms, preserve adequacy and further harmonise pension rules
A key objective of (public) pension reforms enacted over the last decade(s) has been to enhance fiscal sustainability. In addition, different accompanying measures have been taken in order to preserve pension adequacy and / or increase the fairness of the pension system (and thus support the social acceptability of pension reforms), as follows:
• Attempts to harmonise different pension schemes (especially between the private and the generally more favourable public sector) have been made. Several Member States have carried reforms aimed at further aligning rules applying to the public sector (civil servants) and / or special pension schemes with the ones prevailing in the general regime (e. g. Austria, Italy,
Country Automatic balancing
mechanism
Sustainability factor (benefit link to life
expectancy)
Retirement age linked
to life expectancy Legislated
Italy X X 1995 & 2010 Latvia X 1996 Poland X 1999 Sweden X X 2001 & 1998 France* X 2003 Germany X 2004 Finland X X 2005 & 2015 Portugal X X 2007 & 2013 Greece X 2010 Denmark** X 2011 Netherlands X 2012 Cyprus X 2012 Slovak Republic X 2012 Spain X X 2013 & 2011 Total number of automatic mechanisms
% EU28 with automatic mechanisms
2001 AR 4 14%
2006 AR 8 25%
2012 AR 13 39%
19
France, Ireland, Greece, Romania). In some cases, civil servants and special pension schemes have been closed to new entrants (e. g. Cyprus, Greece, Portugal). In Greece, several reforms have tried to tackle the problem of the pension system fragmentation (2002 and 2008 reforms, which allowed merging different pension schemes; 2010 reform and, more recently, the 2016 reform, which set more unified rules across the different schemes);
• To compensate for the increase of early / statutory retirement ages, some flexibilities have often been introduced (or maintained) to take into account long careers (e.g. France, Germany) and in some cases, hazardous jobs (e.g. Greece);
• While pension ages were generally lower for women than for men in the past (average difference of 2 years in 2008 in the EU, with 5 years gaps in France, Italy, Austria, Poland, Romania and the UK for example), most countries have legislated a gradual equalisation of
pension ages between gender (by 2060, those ages should be equal in all EU countries but
Bulgaria and Romania);
• In countries characterised by low benefit and replacement ratios, especially some Eastern European countries and / or countries with flat-rate public pensions (see Graph 13), some measures have been adopted to increase public pension system adequacy (e.g. Bulgaria, which increased its accrual rate in 2014; UK, which adopted a more favourable indexation rule in 2007).
Graph 13. Gross average replacement ratio in 2013 (%, public pensions)
Source: Ageing Report (2015)
* Earnings-related public pensions (information not available on public pensions). EL figure includes the public mandatory supplementary pension. When only the main scheme is considered the RR is 64% (still the third highest value in the EU).
Notes: The gross average replacement ratio is defined as the average first public pension paid in 2013as a share of the average wage at retirement. Information not available for the UK.
2.2. (PUBLIC) PENSION REFORMS IN THE WAKE OF THE 2008-2009 FINANCIAL CRISIS
The financial and economic crisis of 2009 has had a profound impact on retirement-income systems of all different designs: private funded pension schemes first saw a strong reduction in the value of their assets (-23% during 2008); then, their financial equilibrium was challenged by very low rates of return, while the deterioration of public finances led to reducing public support (through reduced tax-incentives or direct subsidies, and – often temporary – reduction of contributions). But public pension PAYG schemes were also affected. Falling employment along with lower growth or even declines in wages hit the revenue side. Moreover, in some countries, the expenditure side was also affected, as
0 10 20 30 40 50 60 70 80 90 HR BG NL IE CZ HU LV LT* RO * SE SI* BE* DK EE DE FI* CY* MT FR AT SK PL PT * IT * EL* LU * ES EU average
20
older-workers losing their jobs were more willing to choose to retire early (Whitehouse, 2012). On top of this, the rapid rise of public debt in some European countries (due to banking bailouts and the economic crisis) called for acute fiscal consolidation.
In this context, the pace of pension system reforms has accelerated since 2008-09 in the EU Member States, often adopting a mix of temporary / short-term effects measures (see Table 9) and additional structural measures:
• In many cases, temporary measures were adopted to reduce the financial burden of public pension expenditures (e.g. freeze of indexation and even cuts in pensions in payment) and / or increase resources (e.g. increase in contribution rates, taxes or tax bases). Moreover, because of the huge impact of the crisis on public budgets, in several countries, some pension measures adopted took effect almost immediately, or very shortly after the legislation had been adopted (e.g. increase of the retirement age for women in Italy; see also Box 2). This contrasts with past pension reforms that were generally allowing for considerable transition periods;
• Moreover, additional structural measures to enhance the sustainability of public schemes were also taken, as seen above (e.g. the adoption of automatic adjustment mechanisms in 8 countries over 4 years after the crisis, while the same number of countries adopted such mechanisms over a prolonged period of 14 years before the crisis; see Table 7 above).
Table 9. Selected short-term / rapid & systemic pension measures adopted since the financial crisis
* Reduction contested through Constitutional Court decisions and / or later on reverted.
** Temporary.
*** Participation in DC private schemes changed from mandatory to voluntary. Source: Ageing Report (2015), SPC report (2015)
Notes: i) In the Czech Republic, the voluntary fully funded pillar introduced in 2013 should be abolished (possibly by the end of 2015). Ii) Countries, which benefited from financial assistance during the crisis, are in red.
Direct cuts in pensions in payment Frozen / reduced indexation Increased taxes (rate, base) / contributions Rapid rise in retirement age Immediate closure of early retirement acess Reduction in tax incentives / subsidies to private pensions Reduction of contributions to mandatory private schemes Roll-back of private pension schemes BE x BG x x x* CZ x x* DK x x EE x x** IE x (civil servants) x x EL x x x x x x ES x FR x HR x x IT x x* x x CY x x x LV x* x x x LT x* x HU x x x x x x NL x AT x x x PL x x x PT x* x x* RO x* x x x** SI x* x SK x** x** x*** FI x x x SE x UK x
Measures affecting pension system architecture Short effects measures on eligibility
21
Box 2. STATUTORY RETIREMENT AGES: AN ACCELERATION OF THE INCREASE SINCE THE CRISIS?
Over the period 2008-2013, important increases of statutory pension ages have been observed in some countries, in particular in Greece, Slovenia and Italy (see Graph 14). In some cases, these increases have been particularly fast (for example, Bulgaria brought forward in 2011 the planned increase of statutory retirement age; Italy legislated a rapid rise of women pension age in the public sector – from 61 to 65 between 2010 and 2012). Significant increases have also been legislated for the period 2013-2020, especially in the UK, Italy and Slovakia (mainly for women; see Graph 15).
Graphs 14 and 15. Legislated increases in statutory retirement age between 2008 and 2020
Statutory retirement age change Statutory retirement age change between 2008 and 2013 between 2013 and 2020
Source: Ageing Report (2009, 2015)
This trend seems to have translated into a sharper rise of the effective exit age from the labour market in 2014, contrasting with more progressive increases observed since the beginning of the 2000's. This evolution is particularly outstanding in the post-crisis context of high unemployment rate.
Graphs 16. Average effective exit age from the labour market
Source: Ageing Report (2012, 2015)
Notes: from 1990 to 2011, data come from OECD; after 2011, the series have been extrapolated using the 2015 Ageing Report relative changes.
0 1 2 3 4 5 6 7 8 EL SI IT MT CZ RO EE SK BG BE UK FR LT DE PL NL women men 0 1 2 3 4 5 6 7 8 UK IT SK HU LT BG CZ EE LV HR PL RO SI PT FR NL DK IE MT ES DE women men 57 58 59 60 61 62 63 64 19 9 0 19 9 1 19 9 2 19 9 3 19 9 4 19 9 5 19 9 6 19 9 7 19 9 8 19 9 9 20 0 0 20 0 1 20 0 2 20 0 3 20 0 4 20 0 5 20 0 6 20 0 7 20 0 8 20 0 9 20 1 0 20 1 1 20 1 2 20 1 3 20 1 4 Women Men
22
Reversal of previous reforms: the case of private funded pension schemes
In other cases, mainly in Eastern European countries, the difficulties of private funded pension schemes, and budgetary strategies to reduce public deficit and debt16 resulted in important reversals
of past trends (as pointed by Bielawska et al (2015) - however, these reversals are linked to many
factors, of which fiscal rules only contributed to a limited extent17). Indeed, in Hungary and Poland, a roll back of private pre-funded pension arrangements was observed18. In Slovakia, the participation to private pension schemes was changed from mandatory to voluntary in 2013. Therefore, if in the 2009
16
Indeed, the pre-funding of private pension schemes is to some extent financed in CEECs through public debt issuance (as seen, contributions into these new schemes are most of the times financed by reallocating part of the social contributions raised to finance public pensions in payment; with no additional fiscal revenue raised, this has been compensated by issuing public debt). Thus, this pre-funding of future pension liabilities adds to the current deficit and debt, while in contrast in countries with no pre-funded pension liabilities, such anticipation of costs do not exist (moreover, future PAYG liabilities are treated as implicit liabilities and not official debt). While both types of liabilities have an impact on fiscal positions over the long-term, it is important to recognize that there is a difference between explicit liabilities (servicing government debt and honouring principal repayment), and implicit liabilities (future expenditure commitments). This issue was recognized in the context of the SGP in the early 2000's and led to allowing some flexibility (to take into account systemic pension reform costs in the application of the SGP). However, in the wake of the crisis, growing pressure to comply with SGP rules contributed to a reduced public support or even reversal of earlier systemic pension reforms in a number of CEECs. This issue, among others, was addressed with the 2011 reform of the SGP (the 'Six-pack'): indeed, account is taken of systemic pension reform costs both in the preventive and the corrective arms of the Pact.
17
Outside of the crisis and short-term budgetary constraints, other reasons invoked for downsizing private pension schemes in CEECs include high management fees, low real returns, ineffective/insufficient risk-diversification strategies and the problem of regulating annuities needed for pension pay-outs (see also Egert, 2012).
18
Note that in Bulgaria, government's attempt to shift mandatory funds' assets to the PAYG public schemes has been blocked by the Constitutional Court.
Despite the progress made with increasing effective exit age and thus older workers' participation and employment rates in EU countries over the last decade, a number of countries (Greece, Slovenia, Luxembourg, Croatia, Malta, Romania) remained 10 pp. or more behind the EU average in 2015 (see Graph 17). Moreover, men still have higher participation rates than women (see Graphs A.3 and A.4 in the Annex). Furthermore, there is ample scope for improvement for most EU counties in terms of catching up with the front runners in the EU by putting the right policies in place. Increasing the employment rate of older people would significantly decrease the public pension expenditure ratio in a number of countries. Graphs 17. Participation and employment rate in the EU
Participation rate in the EU, Employment rate, age group 55-64,
by age group (%) by country (% and pp. change)
Source: Eurostat 25 35 45 55 65 75 85 20 06Q 4 20 07Q 4 20 08Q 4 20 09Q 4 20 10Q 4 20 11Q 4 20 12Q 4 20 13Q 4 20 14Q 4 20 15Q 4 15-64 20-64 55-59 60-64 -20 0 20 40 60 80 SE DE DK EE UK NL LT FI LV IE CZ BG PT *FR IT CY SK ES AT HU PL BE RO MT HR LU SI EL Change 2000-15 2000 2015 EU (2015)
23
AR private pension expenditures were projected to strongly increase in the long run, in more recent vintages this trend has substantially been revised downwards (see Table 10). Several countries (e.g. Latvia, Lithuania, Estonia, Romania and Slovakia) also significantly reduced contributions to private pension schemes (either on a temporary or a permanent basis, see Graph 18). By contrast, the contribution rate to the mandatory individual DC pillar has remained unchanged in Sweden since it was introduced in 1998 (the contribution rate is rather small at 2.5 pp. out of a total of 18.5%). More generally, the crisis seems to have put (at least temporarily) a halt to the expansion of the role of pre-funded schemes in pension provision in the EU (SPC, 2015)19. Several countries also used resources accumulated in reserve funds, aimed at supporting public PAYG pensions systems, to finance their public deficit (e. g. France, Poland). In the case of Ireland, the National Pensions Reserve Fund (NRPF) was (partially) used for bank recapitalisation and as a guarantee for the EU / IMF loan.
Table 10. Private pension expenditures projections in Poland, Hungary and Slovakia across different
Ageing Report vintages (% of total public pension expenditures)
Source: Ageing Report (2009, 2012, 2015)
Notes: In the Ageing Report 2015, none of these three countries projected private pension expenditures (while the current level is estimated close to 0% of GDP according to Eurostat). Thus, those schemes are not expected anymore to represent a significant share of total pension expenditures in the long-run.
Graph 18. Contributions to private pension schemes in selected countries (% of GDP)
Source: Ageing Report (2015), OECD.
Countries that required macro-financial assistance are generally the ones that adopted the most comprehensive packages of (short-term / rapid) measures following the financial crisis (e.g. Greece, Hungary, Romania, Ireland, Cyprus, Latvia and Portugal; see Graph A2 in the Annex). Spain also adopted a substantial structural pension reform in 2013.
Finally, in some cases, and after the peak of the financial crisis, short-term pension-related measures were adopted, not to foster sustainability, but with the aim of coping with the negative socio-impact
of the crisis (e.g. Italy, which allowed employees from 2015 to 2018 to receive severance pay in their
payroll rather than transferring it to private pension schemes, to support consumption; Bulgaria, which
19
Even in countries where private schemes are widespread and benefit from a large coverage, different measures had to be taken to restore solvency (indexation suspension, direct benefits cuts, increase of contributions, etc.), contributing to slow down the coverage of these schemes.
AR 2009 AR 2012 AR 2015
PL 19.6 12.0 na
SK 17.7 na na
HU 14.0 0.6 na
Projected increase (2060 - base year)
0 1 2 3 4 5 6 7 0.0 0.5 1.0 1.5 2.0 2.5 3.0 3.5 19 99 20 00 20 01 20 02 20 03 20 04 20 05 20 06 20 07 20 08 20 09 20 10 20 11 20 12 20 13 20 14 20 15 20 16 20 17 20 18 20 19 20 20 20 21 20 22 20 23 20 24 20 25 20 26 20 27 20 28 20 29 20 30
24
temporarily froze the planned increase in the retirement age in 2014 and Romania, which decreased social contributions paid by employers in 2014, in both cases with the objective to support short-term employment). More generally, several temporary measures with immediate effect that were taken in the wake of the financial and sovereign debt crisis were later on revisited (by Constitutional Courts and / or through general elections) and gave rise in some cases to (partial) reversals (e. g. Czech Republic, Portugal, Latvia, Lithuania, Slovenia, Greece, see Table A6 in the Annex). In several countries (e.g. Germany, Italy and Poland), recent debates and measures adopted, which could partially revert past enacted reforms, illustrate the necessity to appropriately calibrate pension reforms to ensure both fiscal sustainability and social acceptability.
2.3. EU PENSION REFORMS IN INTERNATIONAL PERSPECTIVE
After over two decades of reforms, and even though pension systems still vary significantly across Member States, a strong public sector involvement remains a common feature for all EU Member States. Indeed, according to the Ageing Report 2015, public pension expenditure in 2013 was above 11% of GDP in the EU (and above 12% in the EA), compared to an OECD average of less than 8% of GDP in 2011. Despite a relatively large range (going from 6.9% of GDP in the Netherlands to 16.2% of GDP in Greece20), public pension expenditure ratio was close or higher than the OECD average in 24 EU countries. Public pension benefits also still represent a substantial share of European governments' expenditures: this share reached a third of total government expenditure in Italy in 2011, and was above the OECD average (at 17.5%) in more than 20 EU countries (see Graph 19).
Graph 19. Public pension expenditure EU versus OECD average
Public pension expenditurein 2013* Public pension expenditure in 2011 (% of GDP) (% of total government expenditure)
* Last available year for OECD average.
Source: Ageing Report (2015), Eurostat, OECD (SOCX)
Moreover, despite diverse arrangements and attempts to develop second and third pillars21 in most Member States, the bulk of pension benefits currently remains contribution-based and earnings-related (Bismarckian type system), with a relatively limited role played by private pensions. Exceptions exist though (for example, Denmark and the Netherlands rely to a relatively much larger extent on private pension funds).
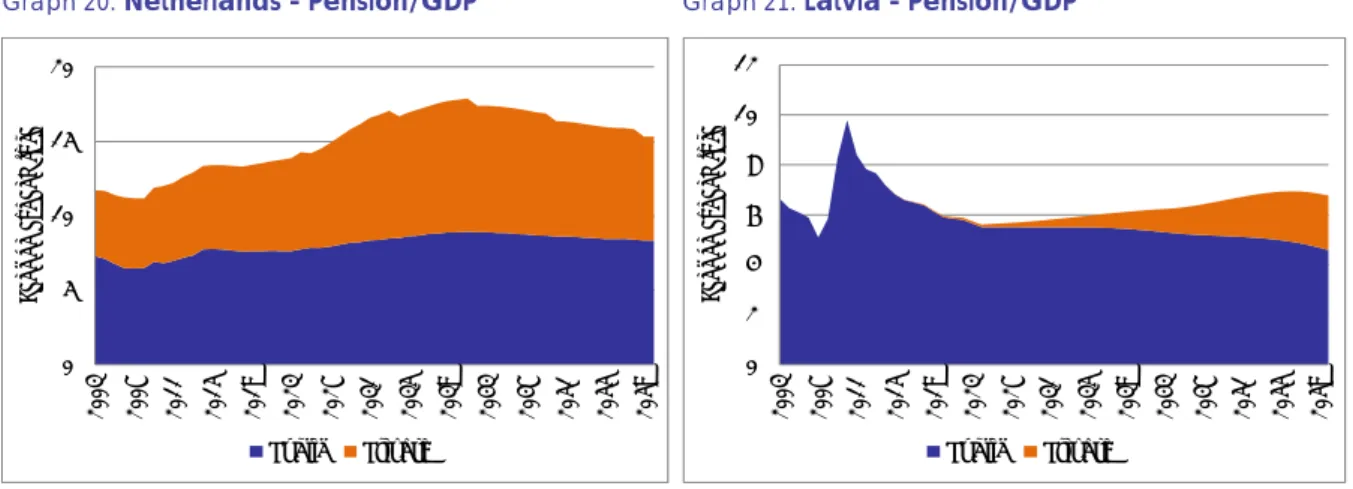
The importance of the private pillars depends on how long they have been in place, and on the contributions paid to them. For instance, private pillars have already been built up for a long time in the Netherlands, and total pensions can therefore expand despite the public pillar being more or less
20
Note that this high level in Greece is partially the result of the severity of the crisis in the country: if the nominal GDP level had remained constant at its 2007 level, public pension expenditure in 2013 would represent around 13% of GDP, though this would still be above EU and EA average.
21
As we have seen in section 2.2, these attempts have been partially / temporarily halted in some countries since the financial crisis. 0 2 4 6 8 10 12 14 16 18 NL LT IE EE UK LV SK RO SE CZ LU CY MT BG DE DK HR PL HU SI BE ES FI PT AT FR IT EL EU (EA) average OECD average 0 5 10 15 20 25 30 35 DK NL IE UK SE SK LU EE FI BE LT HU CZ LV SI ES RO DE MT FR PL AT PT BG EL IT OECD average EU average
25
unchanged as a share of GDP over the next few decades (Graph 20). In Latvia, the introduction of private pillars is more recent (in the 1990s), but because of the private pillar, total pension (as a share of GDP) can expand in the long term despite the public pillar being projected to fall slightly (Graph 21).
Graph 20. Netherlands - Pension/GDP Graph 21. Latvia - Pension/GDP
Source: Ageing Report (2015)
However, past reforms should in the long-run result in a reshaping of pension systems in some
European countries, with private pillars increasingly supporting retirement incomes over time
(Table 11 summarises the main trends in pension system design since 1995). According to the Ageing Report 2015, public pension spending should remain stable over the long run at the EU aggregate level, with 6 countries experiencing substantial decreases (close or above -2 pp of GDP in Croatia, Denmark, Latvia, France, Italy and Greece; at least by -0.5 pp of GDP in Sweden, Estonia, Spain, Portugal and Poland). In some of these countries, this downward trend will coincide with a significant increase in pension benefits provided by private schemes (e.g. Croatia, Denmark, Latvia, Sweden and Estonia).
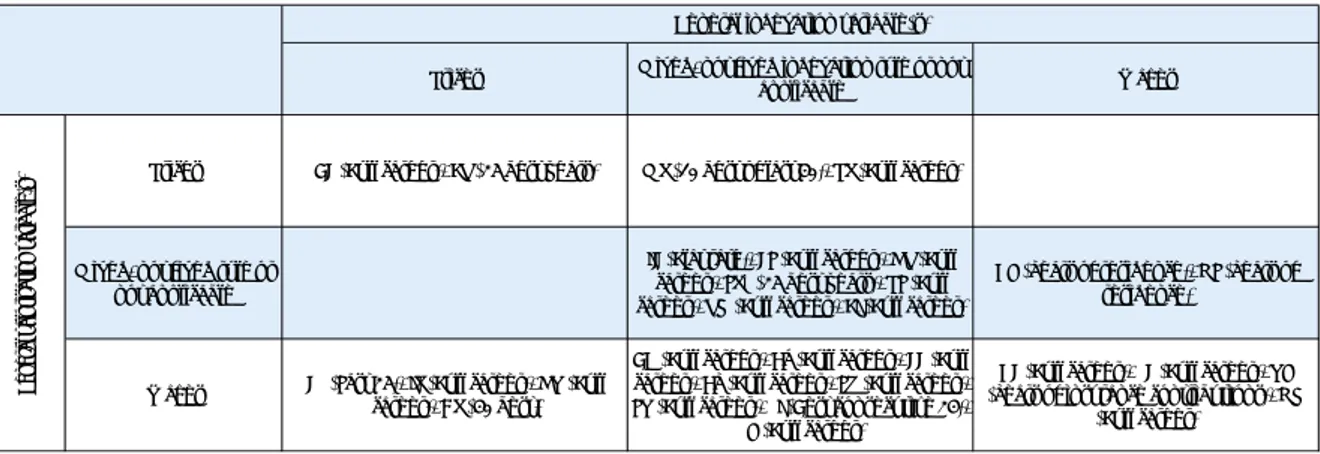
Table 11. Characteristics and main trends in pension system design in EU countries
* This group includes countries that strongly reformed their 1st pillar (like in Greece, Italy and Austria) and / or countries that introduced additional pillars (representing already a significant share of total pension expenditures, or projected to do so in the long-run.
Source: Presentation inspired by Grech (2010)
Notes: i) Pension reforms since 1995 is included ii) Most of countries, attempting to develop a multi-pillar pension system, introduced temporary / permanent measures following the financial crisis likely to have weakened the expansion of private pension schemes (see Table 9). Despite such measures, some countries reporting private pension projections for the 2015 AR, still project a substantial increase of such schemes (e. g. Estonia, Latvia and Lithuania). Countries in italic are those where the intended reforms are still subject to uncertainties. iii) The Annex contains a Table A7 providing more details on this classification.
0 5 10 15 20 2003 2007 2011 2015 2019 2023 2027 2031 2035 2039 2043 2047 2051 2055 2059 Pe ns io n e xp en di tu re Public Private 0 2 4 6 8 10 12 2003 2007 2011 2015 2019 2023 2027 2031 2035 2039 2043 2047 2051 2055 2059 Pe ns ion e xp endi ture Public Private
Preserved overall pension system architecture
Attempt to change pension system nature / architecture*
Partial reverse back to old model Bel gi um France Luxembourg Malta Sl ovenia Czech Republi c Fi nland Portugal
Cyprus Pol and
Spain Greece Hungary
Italy Slovaki a Austria Bulgaria Romania Ireland Lithuania Denmark Croatia UK Latvia Netherlands Estonia Germany Sweden
one dominant pillar