ii
The designations employed and the presentation of material in this information product do not imply the expression of any opinion whatsoever on the part of the Food and Agriculture Organization of the United Nations (FAO), or of the CLAYUCA Corporation (CLAYUCA) or of the Inter-American Institute for Cooperation on Agriculture (IICA) concerning the legal or development status of any country, territory, city or area or of its authorities, or concerning the delimitation of its frontiers or boundaries. The mention of specific companies or products of
manufacturers, whether or not these have been patented, does not imply that these have been endorsed or recommended by FAO, or the CLAYUCA or the IICA in preference to others of a similar nature that are not mentioned. The views expressed in this information product are those of the author(s) and do not necessarily reflect the views or policies of FAO, or the CLAYUCA or the IICA.
ISBN 978-92-5-109348-1 (FAO) © FAO, 2016
FAO encourages the use, reproduction and dissemination of material in this information product. Except where otherwise indicated, material may be copied, downloaded and printed for private study, research and teaching purposes, or for use in non-commercial products or services, provided that appropriate acknowledgement of FAO as the source and copyright holder is given and that FAO’s endorsement of users’ views, products or services is not implied in any way.
All requests for translation and adaptation rights, and for resale and other
commercial use rights should be made via www.fao.org/contact-us/licence-request or addressed to copyright@fao.org.
FAO information products are available on the FAO website
(www.fao.org/publications) and can be purchased through publications-sales@fao.org.
iii
A look at the potential of the crop to promote
agricultural development and economic growth
Cassava in the Caribbean region
Published by
the Food and Agriculture Organization of the United Nations
and
Clayuca Corporation
and
Inter American Institute for Cooperation on Agriculture
iv
Cassava in the Caribbean region:
A look at the potential of the crop to promote agricultural development and economic growth Bernardo Ospina, Executive Director of CLAYUCA Corporation
Alejandra Jiménez, CLAYUCA Consultant Cali, Colombia
Vyjayanthi Lopez, Plant Production and Protection Officer Food and Agriculture Organization of the United Nations Sub-Regional Office for the Caribbean (FAO-SLC)
Hastings, Christ Church, Barbados
Alberto Pantoja, (Ex) Plant Production and Protection Officer Food and Agriculture Organization of the United Nations Regional Office for Latin America and the Caribbean Santiago, Chile
Adam Prakash
Makiko Taguchi, Agricultural Officer
Food and Agriculture Organization of the United Nations Rome, Italy
Humberto Gómez
Inter-American Institute for Cooperation on Agriculture Trinidad and Tobago
Anamaría García, Crop Prodution and Protection Specialist Food and Agriculture Organization of the United Nations Regional Office for Latin America and the Caribbean Santiago, Chile
v
C
ONTENTS
Page
FOREWORD x
WHY THIS DOCUMENT? xi
ACKNOWLEDGEMENTS xii
PART 1: BACKGROUND INFORMATION ON CASSAVA 1
Introduction 1
World cassava figures 1
Importance of cassava in food security 7
PART 2: CURRENT STATUS OF THE CASSAVA CROP IN SELECTED CARIBBEAN COUNTRIES
10
Introducción 10
Results of the survey 11
Statistical information about cassava and other important crops in selected
countries of the Latin American and Caribbean region 43
Barbados 43 Belize 46 Dominica 49 Grenada 51 Guyana 53 Jamaica 55 Montserrat 58 St. Lucia 60
St. Kitts and Nevis 63
St. Vincent and the Grenadines 65
Suriname 67
Trinidad and Tobago 69
Dominican Republic 72
Ecuador 74
Nicaragua 76
Paraguay 78
PART 3: POTENTIAL TECHNOLOGICAL OPTIONS TO PROMOTE SUSTAINABLE
AGRICULTURAL DEVELOPMENT AND ECONOMIC GROWTH 80
Introduction 80
Pillar 1. Increased production and productivity in cassava 80 Pillar 2. Improved processing, value adding technologies 84 Pillar 3. New commercialization/marketing and market systems 92
Pillar 4. Promotion of consumption 92
vi
Page
BIBLIOGRAPHY 96
ANNEXES 97
Annex 1. Contacts in the Caribbean region 98
vii
L
IST OF
T
ABLES
Page
Table 1. Changes in cassava production in three continents, ten-year average. 2
Table 2. Changes in cassava production in three continents, ten-year average (as a percentage of total production worldwide).
2
Table 3. Changes in cassava areas planted in three continents, ten-year average (in millions of ha).
3
Table 4. Changes in cassava areas planted on three continents, ten-year average (as a percentage of total areas planted with cassava worldwide).
4
Table 5. Changes in cassava yields in three continents, ten-year average (MT per ha). 5
Table 6. Changes in cassava yields, by continent, average of ten-year periods (as a percentage of world cassava average yields).
5
Table 7. Food consumption data in energy equivalents by region, 2007-2009. 7
Table 8. Cassava production data (1961 to 2009). 8
Table 9. List of countries included in the survey on the current status of the cassava value chain.
10
Table 10. Production of cassava in selected LAC countries (average of ten-year periods). 12
Table 11. Production of cassava in selected countries of the LAC region (2006-2010). 13
Table 12. Ranking of the most important crops in selected Latin American and Caribbean countries.
14
Table 13. Ranking of the most important crops in selected Latin American and Caribbean countries, excluding wheat, rice and maize.
15
Table 14. Cassava yields in selected LAC countries (average ten-year periods, 1970-2009).
16
Table 15. Cassava yields in selected LAC countries (period 2006-2010). 18
Table 16. Average yield annual growth rate (%) for cassava in selected LAC countries (1970 – 2009).
19
Table 17. Classification of cassava farmers in countries of Caribbean based on farm size and yields.
20
Table 18. Main cassava varieties grown in selected Caribbean countries and farmers’ reasons for the preference.
viii
Page
Table 19. Principal cassava varieties planted in selected countries of the Caribbean region.
22
Table 20. Cassava varieties introduced in the Latin America and Caribbean region. 25
Table 21. Main Institutions working on cassava in the Caribbean region. 30
Table 22. Prices paid for cassava roots by processing enterprises in selected countries. 36
Table 23. Main cassava varieties used in cassava processing activities in selected countries of the Caribbean region.
38
Table 24. Summary of physical, physico-chemical, and cooking characteristics demanded by cassava processing enterprises in selected Caribbean countries.
40
Table 25. Activities and areas of work for interventions to increase efficiency and competitiveness in cassava processing enterprises in some Caribbean countries.
ix
L
IST OF
F
IGURES
Page
Figure 1. Changes in average cassava yields in four regions, 10-year averages expressed as a percentage of world cassava average yields for each decade.
5
Figure 2. Average size of cassava areas in selected countries of the Caribbean region. 21
Figure 3. Experience of cassava farmers included in the survey. 23
Figure 4. Origin of the cassava planting material used by cassava farmers included in the survey.
24
Figure 5. Methods used in the Caribbean region to control cassava diseases. 27
Figure 6. Methods used in the Caribbean region to control cassava pests and insects. 28
Figure 7. Main markets for cassava production in selected Caribbean countries. 29
Figure 8. Participation of women in cassava production and processing activities in selected Caribbean countries.
34
Figure 9. Different types of cassava processing enterprises existing in selected Caribbean countries.
35
Figure 10. Different sources of raw material (cassava roots) for cassava processing enterprises in selected Caribbean countries.
35
Figure 11. Cassava processing activities conducted manually and mechanically in selected Caribbean countries (as a percentage of the total number of processing enterprises interviewed).
37
Figure 12. Cassava processing activities conducted manually and mechanically in selected Caribbean countries (as a percentage of the total number of processing enterprises interviewed).
37
Figure 13. Cassava production in Belize, 2001-2012. 47
Figure 14. Cassava yields in Belize, 2001-2012. 47
Figure 15. Cassava plants obtained from two-node mini-stakes, ready for transplanting. 82
Figure 16. System for rapid multiplication of planting material of imported, improved cassava varieties, included in field evaluation trials.
83
Figure 17. System for rapid multiplication of planting material of improved cassava varieties based on the nursery concept. Farmers receive 2-3 month old plants instead of stakes.
x
F
OREWORD
One of the best strategies for promoting sustainable development of the agricultural sector in a country is to implement approaches that integrate genetic resources, eco-efficient field and crop management, and postharvest value-adding technologies. This integrated systems approach offers many advantages to all the actors of a crop value chain, including policy makers, producers, processors and users. For example, farmers can have facilitated access to improved varieties, with high yielding potential and good
adaptation to the specific agro-climatic conditions of the region. Also, using eco-efficient technologies to manage the soil and the crop, farmers can increase their yields using those inputs that are necessary and affordable and that can make a real contribution to increase the competitiveness and enhance and maintain the sustainability of their farming systems.
Furthermore, using improved, value-adding technologies for processing, farmer groups can have increased access to and consumption of food products that will have a direct impact in their nutritional and food security status. In turn, this will provide rural populations with access to additional employment and income generation opportunities.
This document is an attempt to present an overview of the technological options that are currently available to promote increased productivity and competitiveness of the cassava crop. These options could become an excellent strategy for the difficult task faced by the countries in the region that need to reduce poverty, hunger and the increased dependency on imported foods to attend the nutritional needs of their populations.
xi
WHY THIS DOCUMENT?
Most countries in the Caribbean are currently facing a challenge related to the need of reducing the large and increasing amount of imported food products to meet the rising demands of the population and of the industrial sectors. To meet this challenge, the countries in the region have begun to design and implement policies aimed at promoting local production of crops and food products that are widely consumed, and that can be produced locally. “Let us grow what we eat and let us eat what we grow” is one of the popular titles assigned to such initiatives.
In this context, cassava can play an important role. It ranks high among the major crops produced in the region. It is a source of cheap energy and also has a good content of vitamins and minerals. Cassava can contribute to improve food security and nutrition in rural and urban households. In addition, cassava can be used in many industries including food, textiles, pharmaceuticals, paper and adhesives, animal feeding and as feeedstock for ethanol processing.
However, cassava has historically received little attention and support from governments, donors, and national agricultural research and technology transfer systems. This makes the task of Governments of the Caribbean region even more difficult as they address the urgent need to design and implement coherent agricultural policies and strategies to promote sustainable development of the cassava crop.
Therefore, FAO, CLAYUCA, and IICA considered it strategic to prepare this document as a contribution to the countries of the Caribbean Community (CARICOM) that are in the process of formulating approaches that promote sustainable intensification of cassava production, processing and utilization, as an alternative to the increasing dependency on imported foods.
This document is divided into three parts. The first part summarizes relevant background information on the current status of cassava globally and in the context of the Caribbean region. Part two is a compilation of the information collected via a survey administered with the collaboration of key resource persons in most countries of the region. Data obtained was complemented with updated information collected and compiled with the support of the Statistics Department, FAO Rome; and with data provided by the cassava practicioners (research and extension agents), from 12 countries, who attended an International Training event organized by CLAYUCA, with financial support from the Colombian Government. The third part includes some concrete examples of potential opportunities that could be
implemented in the region, using a three-pillar approach that CLAYUCA has been proposing, that includes: a) improved genetic resources; b) eco-efficient crop and soil management technologies; and c) value-added processing and utilization technologies. Some conclusions and recommendatios are also included.
xii
A
CKNOWLEDGEMENTS
This document is the result of the efforts of a group of research scientists, technicians and farmers, from selected countries in the Caribbean region, who participated actively in a survey coordinated and conducted by CLAYUCA Corporation on the current status of the cassava crop in various countries. This also included collaborators from Nicaragua, Paraguay and Ecuador. Their contribution is gratefully acknowledged.
The Presidential Agency for International Cooperation of the Government of Colombia (APC-Colombia) greatly contributed to the preparation of this document by providing financial and logistical support to CLAYUCA to organize a training event on cassava technologies, specifically aimed at participants from the Caribbean countries included in the document. It was an excellent opportunity for direct interaction with a selected group of persons who provided very useful, updated information on the status of the cassava sector in their respective countries
FAO provided technical and financial support to the preparation of this document. Feedback from Dr Heiko Bammann, Trade and Markets Officer and editorial assistance by Ms. Waynelle Collymore-Taylor and Ms Vermaran Extavour (all of FAO-SLC, Barbados) are gratefully acknowledged.
1
P
ART
1
B
ACKGROUND
I
NFORMATION ON
C
ASSAVA
I
NTRODUCTIONCassava (Manihot esculenta Crantz) is the fourth most important source of energy in the tropics, after maize, sugarcane and rice, and for many millions of people represents a basic component in their diets (FAO, 2000). The crop is grown in more than 100 tropical and
subtropical countries, usually by small-scale farmers. Cassava is one of the most popular crops in small-scale, subsistence farming systems because it is a crop that very seldom fails to produce, even in marginal areas with poor soil conditions and unreliable rainfall.
In the tropical and subtropical regions of Asia, Africa and Latin America, cassava is a major crop for food security and industrial uses. The crop is used mainly for human consumption in most parts of Africa and Latin America. In Asia and some parts of Latin America, it is used for the production of commercial animal feed, processing into starch and starch-based products and on-farm animal feeding. These multiple uses and market options give cassava importance and value as a crop that is appropriate for resource-poor farmers that can use it as vehicle to help feed their families, obtain income and employment and escape poverty.
Cassava has some unique characteristics that make it suitable to produce reasonable yields, even in areas with poor soil and climatic conditions. The crop efficiently uses available water and soil nutrients, has good tolerance to drought and to some pests and diseases. Compared to the main staples globally, cassava is seen as least suited for promoting intensification, using the Green Revolution approach based on the use of uniform crop varieties, intensive tillage, irrigation, fertilizer and pesticides (FAO, 2013). However, in the last decade, the worldwide importance of cassava has changed dramatically. From being a crop considered as “poor man’s food”, cassava has now become a multipurpose crop for the Third Millennium. Its importance for the potential for value-addition is well-documented and acknowledged. The crop is considered as an important strategy that can help developing countries meet their needs and priorities with regard to rural development, food security, energy security and other wider macroeconomic goals.
W
ORLD
C
ASSAVA
F
IGURES
ProductionWorldwide, most cassava production occurs on small farm holdings and in marginal
agricultural areas, and therefore production statistics at country, region and global levels are often inadequately recorded and compiled into reliable statistics figures. The best statistics available are those produced by FAO.
Tables 1 and 2 show data on world cassava production in the last four decades, on each continent, presented as the annual average of ten-year periods. During 2000-2009, Africa produced 53.5% of the total production of cassava globally, which represented an increase of 27.4% compared to 1980-1989, when Africa was responsible for the production of 42% of the total global production of cassava.
2
In Asia, cassava production during the period 2000-2009 represented 30.2% of the world production. This represented a decrease of 15.4% in the share of the total world production compared to 1980-1989, wherein Asia was responsible for 35.6% of the total production. Available data for Latin America (South and Central America), indicate that during the decade 2000-2009, the average annual production of cassava was only 15.6% of the total production at the global level. This represented a decrease in production equivalent to 28.4%, compared to the decade of 1980-1989 during which the cassava production in Latin America
represented 21.8% of the global production.
In CARICOM (comprising 15 Member States)1, available data for 2000-2009 indicate that cassava production decreased by 8.6% when compared to the decade 1980-1989. Total production of cassava in CARICOM countries continues to be very small, only 0.21%, in comparison with global production figures (Table 2).
Table 1. Changes in cassava production in three continents, ten-year average.
REGION 1970-79 1980-89 PERIOD 1990-99 2000-2009 (million MT) Africa 44.1 56.5 83.5 103.9 Asia 32.1 47.9 48.5 58.7 Latin America 32.0 29.4 28.8 30.2 CARICOM 0.26 0.31 0.38 0.41 Total 109.1 134.7 161.9 194.2
Source: FAO. http://faostat.fao.org/
Table 2. Changes in cassava production in three continents, ten-year average (as a percentage of total production worldwide).
REGION 1970-79 1980-89 PERIOD 1990-99 2000-2009 Africa 40.4 42.0 51.6 53.5 Asia 29.6 35.6 30.0 30.2 Latin America 29.3 21.8 17.8 15.6 CARICOM 0.25 0.23 0.23 0.21 Total 100.0 100.0 100.0 100.0
Source: FAO. http://faostat.fao.org/
1 The countries included as CARICOM member States are: Antigua and Bermuda, The Bahamas, Barbados, Belize, Dominica, Grenada, Guyana, Haiti, Jamaica, Montserrat, Saint Lucia, St. Kitts and Nevis, St. Vincent and the Grenadines, Suriname, and Trinidad and Tobago.
3 Main facts
The African continent has maintained its importance as the largest cassava producer in the world, a fact that has been maintained steady over the last four decades. During the last decade (2000-2009), Africa accounted for 53% of the total world cassava production.
Asia continues to occupy its importance as the second largest cassava producing region in the world. During the last decade, average cassava production increased by 21% in comparison with two decades ago. Globally, the total production of cassava has remained almost the same, with cassava in Asia accounting for almost one third of the total production.
Cassava production in Latin America has shown a slight increase during the last decade. Average production in the region was 4.8% higher. In terms of the total world production, cassava’s importance in Latin America was reduced, accounting for only 15.6% of the total world production from 2000-2009. Two decades ago, the region’s share was 17.8 % of the total cassava produced worldwide.
CARICOM continues to show increase in the volumes of cassava produced. During the last decade, these have been nearly 8% higher than those produced two decades ago. However, in comparison with the total world production, the region accounted for only 0.21% during the last decade, whereas the proportion was 0.23% two decades ago.
Area planted
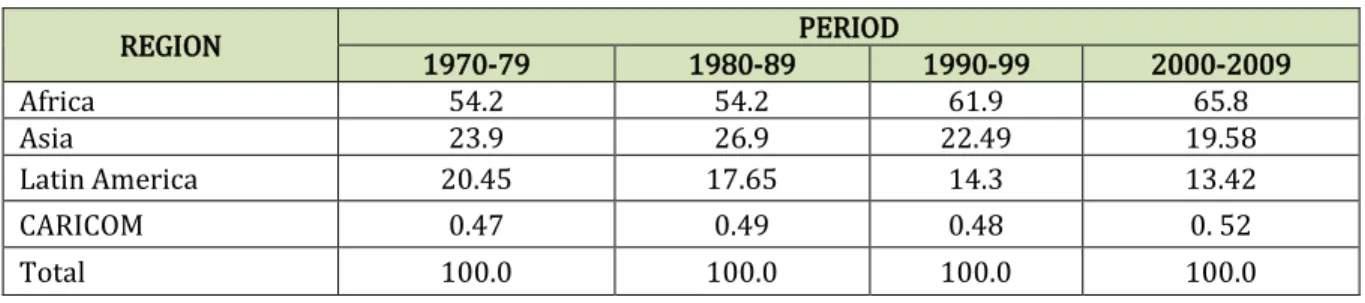
Tables 3 and 4 provide data on the evolution of the areas planted to cassava globally, in the last four decades on three continents, presented as the annual average of ten-year periods. During 2000-2009, Africa planted 65.8% of the total area cultivated with cassava worldwide. This represented a constant, increasing trend, considering that during 1980-1989 the area planted with cassava in Africa represented 54.2 % of the area planted with cassava worldwide and during the decade 1990-1999, Africa’s share was 62%.
Table 3. Changes in area planted with cassava on three continents, ten-year average (in millions of ha). REGION PERIOD 1970-79 1980-89 1990-99 2000-2009 Africa 6.87 7.65 10.13 10.05 Asia 3.03 3.80 3.68 2.99 Latin America 2.59 2.49 2.34 2.05 CARICOM 0.06 0.07 0.08 0.08 Total 12.66 14.10 16.36 15..27
4
Table 4. Changes in areas planted with cassava on three continents, ten-year average (as a percentage of total area planted with cassava worldwide).
REGION 1970-79 1980-89 PERIOD 1990-99 2000-2009 Africa 54.2 54.2 61.9 65.8 Asia 23.9 26.9 22.49 19.58 Latin America 20.45 17.65 14.3 13.42 CARICOM 0.47 0.49 0.48 0. 52 Total 100.0 100.0 100.0 100.0
Source: FAO. http://faostat.fao.org/
In contrast, areas planted with cassava in Asia have been declining over the past 30 years. During 2000-2009, the total area in the region planted represented 19.6% of the total area planted with cassava globally, whereas one and two decades ago, the areas planted with cassava in Asia represented a share of 22.5% and 27%respectively.
A review of the available data from South and Central America shows that during the decade 2000-2009, the average area planted with cassava annually represented only 13.4% of the total area planted worldwide. One and two decades ago, the region’s share was 14.3% and 17.7%, respectively.
In CARICOM, available data for 2000-2009 indicates that area planted with cassava remained the same over the two previous decades. Total area planted accounts for a very small share, representing only 0.52% of the total area planted with cassava globally over the last decade. Main facts
Areas planted with cassava in Africa have remained constant over the last two decades but represent a large increase of almost 31.3% in comparison with the area planted in the region two decades ago (1980-89).
In Asia, areas planted with cassava have been showing a negative growth trend over the past three decades. During 2000-2010, average areas planted with cassava in the region were 18.7% lower than a decade ago, and 21.3% lower than two decades ago.
The average area planted with cassava in South and Central America, during the last decade (2000-2009), were reduced by 31.8%, compared to the area planted two decades ago (1980-1989). The difference in average area planted during the last two decades have maintained a negative trend but the reduction in the average areas planted between the two decades has been only 5.9%.
The average cassava area planted in the CARICOM during the last two decades has
remained constant but in comparison with two decades ago, there is a modest but positive increase. This positive difference of near 14.3 % in the areas planted currently indicates to some extent the renewed importance that the cassava is gaining in the CARICOM region.
5 Cassava yields
Data on the evolution of global cassava yields as 10-year averages on the three continents are presented in Tables 5 and 6, and Figure 1.
Table 5. Changes in cassava yield on three continents, ten-year average (MT per ha).
REGION PERIOD 1970-79 1980-89 1990-99 2000-2009 Africa 6.42 7.40 8.25 10.34 Asia 10.32 13.81 18.43 26.69 Latin America 12.36 11.79 12.28 14.77 CARICOM 4.56 4.35 4.45 5.13 World Total 8.62 9.55 9.89 12.71
Source: FAO. http://faostat.fao.org/
Table 6. Changes in cassava yield, by continent, average of ten-year periods (as a percentage of world cassava average yield).
REGION PERIOD 1970-79 1980-89 1990-99 2000-2009 Africa -25.6 -22.6. -16.6 -18.6 Asia 19.0 44.0 86.3 110 Latin America 43.0 23.0 24.1 16.2 CARICOM -47.1 -54.6 -55.0 -59.6 World Total 100.0 100.0 100.0 100.0
Source: FAO. http://faostat.fao.org/
Figure 1. Changes in average cassava yields in four regions, 10-year averages expressed as a percentage of world cassava average yields for each decade.
Source: FAO. http://faostat.fao.org/
-25,6 -22,6 -16,6 -18,6 19 44 86,3 110 43 23 24,1 16,2 -47,1 -54,6 -55,5 -59,6 100 100 100 100 -80 -60 -40 -20 0 20 40 60 80 100 120 1970-79 1980-89 1990-99 2000-10
6
During the period 2000-2009, average cassava yield in Africa were estimated in 10.3 MT/ha, the second lowest cassava yield in the world, only higher than the average yield obtained in CARICOM, estimated at 5.13 MT/ha. However, considering the evolution of cassava yield in Africa, there is a positive trend during the last three decades. Average cassava yield in Africa during the last decade were 25.3% higher than those obtained a decade earlier, and 39.7% higher than those obtained two decades ago.
The average cassava yield obtained in Asia during 2000-2009 were the highest worldwide, estimated in 26.7 MT/ha, 44.8% higher than those obtained a decade earlier, and 93% higher than the decade of 1980-89.
An analysis of the cassava yield obtained in the South and Central America during the last three decades, indicates that average yield during 2000-2009 were 20.2% higher than those obtained during 1990-1999 and 25.2% higher than those two decades earlier, suggesting a positive trend in the increase in cassava productivity.
For CARICOM countries, available data for the period 2000-2009 indicate the average cassava yields have experienced a modest but positive increase, improving by 15.3% during the decade 2000-2009, in comparison with one decade earlier, and by 17.9% in comparison with the average cassava yield obtained two decades earlier.
Main facts
A comparison of cassava yield obtained in the African region with the cassava yield
obtained worldwide indicates that the difference is narrowing. During 2000-2009, average cassava yield in Africa were 18.6% lower than average yields worldwide, whereas twenty years ago, this difference was 22.6%.
A comparison of the average cassava yield obtained in Asia indicates that during 2000-2009, yields were 110% higher than those obtained worldwide. During 1990-1999, yield in Asia were 86.3% higher and two decades earlier (1980-89), they were also higher but only by 44%. This data clearly indicates the impressive growth in cassava productivity that has been achieved in the Asian region over the last three decades.
Average cassava yield from Latin America over the past three decades, compared to those obtained worldwide, indicates that during 2000-2009, yields were 16.2% higher than those obtained worldwide. During 1990-1999, average cassava yield were 24.1% higher suggesting that the increase in cassava productivity in the Latin American region during the current decade has been a slightly lower than the increase occurring worldwide. The average cassava yields obtained in CARICOM during 2000-2009 were 59.6 % lower
than the global average. This difference was also negative in the previous decade but by 55.5%. This is a clear indication of the very poor gains made in cassava productivity in this region compared to the other regions of the world. Indeed, there is a tremendous gap in cassava productivity in CARICOM in comparison with the cassava production systems in the other two continents.
7
I
MPORTANCE OF
C
ASSAVA IN
F
OOD
S
ECURITY
Table 7 provides food consumption data in energy equivalents at the regional and global levels as the contribution made by different commodities to the total supply of energy. Three crops - wheat, rice and maize - are responsible for nearly half of the caloric intake of the world population, especially in regions with the largest populations of undernourished people with food and nutrition insecurity. Considering the total contribution of agricultural crops to food consumption, in energy equivalent at the global level, these three crops are responsible for 80.4% of the total energy supplied by agricultural crops. The contribution of cassava to the total worldwide energy supply, coming from the rest of the agricultural crops, excluding wheat, rice and maize, is equivalent to 12.4 %.
In Africa, 65.6% of the total supply of calories comes from the agricultural sector. The three main crops -wheat, maize and rice - contribute to 57.2% of the total energy supply. Cassava is a very important crop for food security in Africa with a contribution equivalent to 21.4 % of the total energy supplied by the rest of the agricultural crops, excluding wheat, rice and maize. In Asia, the contribution of cassava to the total energy consumption of the population is very low. Whereas the three main crops (rice, wheat and maize) contribute with 86.3% of the total energy consumption, cassava makes a very modest contribution of only 7.7% of the energy equivalent supplied from the other agricultural crops, excluding wheat, maize and rice. Table 7. Food consumption data in energy equivalents by region, 2007-2009.
CROP COMMODITY SUPPLY KCAL/TOTAL SUPPLY KCAL KILOCALORIES (%)
CARICOM LAC Africa Asia Total
Cassava 0.52 1.42 6.03 0.63 1.30 Bananas 0.91 1.01 0.66 0.71 0.68 Plantains 0.68 0.62 1.71 0.04 0.32 Potatoes 1.03 1.39 1.17 1.82 2.15 Sweet potatoes 0.41 0.11 1.38 1.04 0.81 Yams 0.75 0.06 2.72 0.00 0.37
Roots and tubers total 4.31 4.62 13.70 4.23 5.62
Wheat 18.11 11.19 15.27 19.48 18.78 Rice 10.27 6.90 8.15 28.98 18.99 Maize 2.63 19.32 14.15 2.69 4.95 Beans 0.81 3.16 1.24 0.50 0.79 Others 0.85 0.50 7.18 1.35 1.86 Total kilocalories (%) 37.62 46.25 65.59 59.25 53.1
Contribution of wheat, maize, rice (%) 82.4 80.89 57.28 86.33 80.41
Contribution of cassava in relation to
total energy supply (%) 1.39 3.07 9.20 1.07 2.45
Contribution of cassava excluding wheat,
rice and maize (%) 10.28 16.06 21.44 7.7 12.48
8
In Latin America, the contribution of the three main crops (rice, wheat and maize) to the total energy consumption is equivalent to 80.8%. In comparison with the other agricultural crops that contribute to the total energy supply in the region, cassava makes an important
contribution equivalent to 16%.
In the CARICOM region, as in the rest of the world, rice, maize and wheat are the most
important sources of energy, with a total contribution of 82.4%. Cassava contributes 10.2% of the energy supply from the rest of agricultural commodities, excluding wheat, maize and rice. The importance of cassava is changing very rapidly around the world. Recent FAO estimates indicate that global harvest in 2012 was around 280 million metric tons, representing an increase of almost 60% in comparison to the volumes produced in 2000. These positive trends are likely to continue as the potential of the cassava crop as a strategic provider of food, feed, fuel and other industrial uses is being increasingly recognized and exploited. The strategic and growing importance of cassava is demonstrated by the data available from two important regions, the Least Developed Countries (LDC, as defined by FAO) and
CARICOM. The LDC is a group of 50 low-income countries and the CARICOM region is a group of 15 countries.
Table 8 presents a comparison of production, area planted and yield, for the cassava crop, in the LDC and in the CARICOM region, over a period of 50 years. The CARICOM region is well behind in terms of yield improvements, increasing only by 2.8 % from 1961 to 2009. During the same period, the growth in cassava productivity in LDCs was 69%.
In relation to area of cassava harvested, CARICOM showed significant growth during the last 50 years, equivalent to 158% whereas the LDC countries, the growth in the area of cassava harvested was equivalent to 78%.
The volumes of cassava produced in the CARICOM region increased by 165% over the last 50 years. During the same period, increase in the total volumes in LDCs was 201%.
Table 8. Cassava production data (1961 to 2009).
PRODUCTION (tonnes) AREA HARVESTED (ha) YIELD (t/ha)
CARICOM MEMBER STATES Average
(1961-1963) (2007-2009) Average (1961-1963) Average (2007-2009) Average (1961-1963) Average (2007-2009) Average
183405 487159 42715 110395 4.29 4.41
+165% +158% +2.8%
PRODUCTION (tonnes) AREA HARVESTED (ha) YIELD (t/ha)
Least Developed Countries (LDC) Average
(1961-1963) (2007-2009) Average (1961-1963) Average (2007-2009) Average (1961-1963) Average (2007-2009) Average
21523935 64861771 4266236 7598480 5.05 8.54
+201% +78.1% +69.1%
9
Over the next few decades, with the challenges faced by the governments (especially in the developing countries) to meet the priorities and demands of the population for food, income and employment opportunities, the importance of cassava is likely to maintain a positive trend. This would be particularly so as the governments and policy makers recognize the potential of cassava as a strategic option to promote rural development, economic growth, and food security. The major drivers of this renewed importance of cassava for rural development and raising rural incomes are high prices of cereals, potential to use cassava flour to replace wheat imports, cassava as bio-ethanol raw material, cassava starch for industrial uses and resilience to climate changes (FAO, 2013).
In CARICOM, with a food import bill that has been estimated in almost US$5 billion, cassava could become an important rural development policy option for the urgent task that
governments are facing in order to reduce the huge food imports. Cassava crop could help countries in the region to save foreign exchange, generate employment and create income oportunites, especially in rural areas, and increase the availability of food, especially for the poorest sectors of the population.
10
P
ART 2
C
URRENT
S
TATUS OF THE
C
ASSAVA
C
ROP IN
S
ELECTED
C
ARIBBEAN
C
OUNTRIES
I
NTRODUCTION
In conducting the analysis of the current status of the cassava value chain in selected
countries of Latin American and the Caribbean, CLAYUCA received excellent collaboration and logistical support from the Food and Agriculture Organization of the United Nations (FAO) and the Inter-American Institute for Cooperation on Agriculture (IICA), through their officers and technical personnel in the countries included in the analysis.
The activity was undertaken as a collaborative effort with the main objective of obtaining accurate, updated and meaningful information that could be used later by the three institutions in the design of a regional strategy aimed at promoting sustainable and competitive intensification of production and industrialization in the Caribbean.
To facilitate the implementation of this analysis, an on-line survey was designed to obtain updated information on the current state of the cassava value chain in the selected countries, covering aspects of production, processing, marketing and planning. Key actors of the sector in each country, including technical personnel, farmers, private sector companies and small-scale agroprocessing enterprises, were identified and their collaboration was requested as a valuable source of information on the above-mentioned topics. The survey was divided into various sections and the informants were asked to answer only those questions in which they believed to have adequate information. Table 9 presents the list of countries included in the survey, the number of contacts identified in each country and the number of responses
received. Despite the easy methodology adopted (answering questions in an electronic survey that took a few minutes), and the collaboration received from IICA and FAO country officers and technical personnel, only 31% of the informants contacted responded to the survey. Table 9. List of countries included in the survey on the current status of the cassava value chain.
COUNTRY CONTACTS RECEIVING THE SURVEY ANSWERS RECEIVED
Barbados 21 5 Belize 5 Ecuador 15 2 Guyana 28 4 Jamaica 31 10 Nicaragua 57 16 Paraguay 38 22 Dominican Republic 20 5 St. Lucia 10 3 St. Vincent 12 4 Suriname 20 7
Trinidad & Tobago 48 16
TOTAL 305 94
11
Nonetheless, the quality of the information obtained is good considering that it could provide a baseline for further surveys and analyses in the future. The information obtained through the survey was complemented with up-to-date statistical information available at FAO (FAOSTAT). CLAYUCA has done a preliminary processing of the information obtained and a draft report is presented in the next section.
Despite the fact that only 36% of the intended participants in the survey answered it, affecting the quality of the statistical data presented and discussed in this document, the information obtained could be considered accurate and useful, because a very important, complementary set of information was obtained through the participants in the International Training event held at Cali, Colombia,
Additionally, the electronic survey form and the statistical analysis platform built to process the information are now available and can be used for similar work in the future.
R
ESULTS OF THE
S
URVEY
Cassava in the Caribbean RegionCassava has been identified as an important crop to meet the food and nutrition needs of the population in the Latin American and Caribbean region. It is recognized as one of the crops with higher potential for the development of value added through its processed products (IICA, 2013).
Cassava production figures
Production and processing of cassava in Caribbean countries are relatively small-scale activities, in comparison to other countries in South America and around the world, and in most cases there is a high predominance of traditional, subsistence production systems. Table 10 shows the production of cassava in various LAC countries including the twelve countries included in the electronic survey conducted by FAO/ IICA/ CLAYUCA.
Data has been compiled as the average production of ten-year periods, covering the last four decades (1970-2009). Data is also presented on the variation of cassava production between the two previous decades.
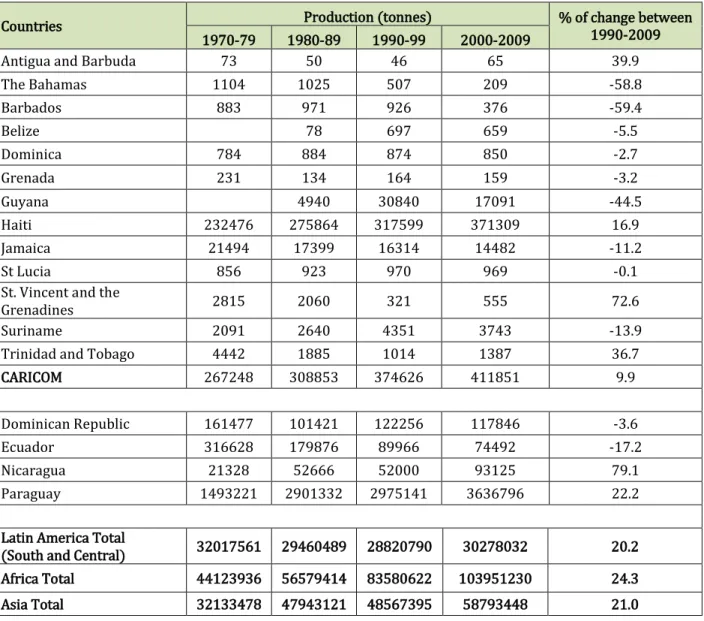
Cassava production in CARICOM from 2000-2009 increased by 10% in comparison with the average annual production in 1990-1999 (Table 10). Only four countries in the region experienced increases in production, compared to the two previous decades: Trinidad and Tobago, Antigua and Barbuda, Haiti, and St. Vincent and the Grenadines. In The Bahamas, Barbados and Guyana, cassava production was reduced drastically, by approximately 50-60%, over the last two decades. In Jamaica, Belize, Dominica, Grenada and Suriname, the reduction during the same periods was lower, approximately 10%.
Nicaragua increased the production of cassava over the past two decades by 79%; Paraguay also had a positive increase of 22%; Ecuador had reduced production (22%), while there was a smaller reduction of around 3.6% in the Dominican Republic.
12
The 10% growth in cassava production in the Caribbean region during the last two decades was modest in comparison with regions like Asia with 44.7%, Africa with 24.3% and Latin America (including South and Central America) with 20.2% growth.
Table 10. Production of cassava in selected LAC countries (average of ten-year periods).
Countries Production (tonnes) % of change between 1990-2009
1970-79 1980-89 1990-99 2000-2009
Antigua and Barbuda 73 50 46 65 39.9
The Bahamas 1104 1025 507 209 -58.8 Barbados 883 971 926 376 -59.4 Belize 78 697 659 -5.5 Dominica 784 884 874 850 -2.7 Grenada 231 134 164 159 -3.2 Guyana 4940 30840 17091 -44.5 Haiti 232476 275864 317599 371309 16.9 Jamaica 21494 17399 16314 14482 -11.2 St Lucia 856 923 970 969 -0.1
St. Vincent and the
Grenadines 2815 2060 321 555 72.6
Suriname 2091 2640 4351 3743 -13.9
Trinidad and Tobago 4442 1885 1014 1387 36.7
CARICOM 267248 308853 374626 411851 9.9
Dominican Republic 161477 101421 122256 117846 -3.6
Ecuador 316628 179876 89966 74492 -17.2
Nicaragua 21328 52666 52000 93125 79.1
Paraguay 1493221 2901332 2975141 3636796 22.2
Latin America Total
(South and Central) 32017561 29460489 28820790 30278032 20.2
Africa Total 44123936 56579414 83580622 103951230 24.3
Asia Total 32133478 47943121 48567395 58793448 21.0
Source: FAO. http://faostat.fao.org/
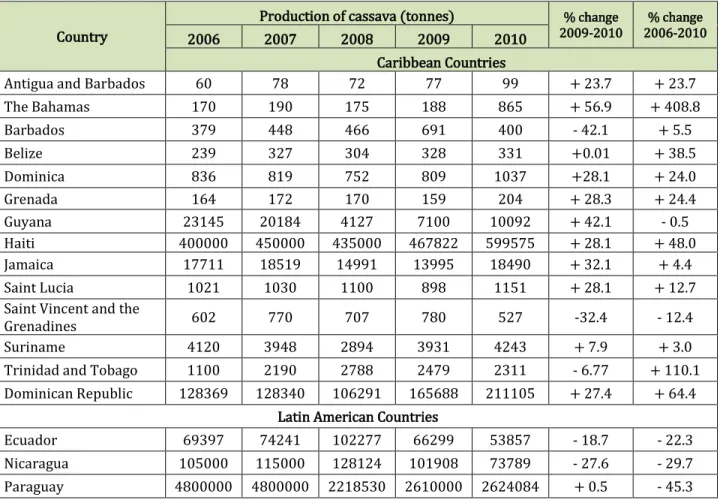
Additionally, an analysis of the production of cassava in selected LAC countries, based on available data (FAOSTAT) for the period 2006-2010, is provided in Table 11. Analysis of data obtained considering the period 2009-2010 revealed that during this period, only three countries in the LAC region showed negative growth in the rate of cassava production: Trinidad and Tobago, Barbados and St. Vincent and the Grenadines. Further analysis for the period 2006-2010 indicates that with the exception of St. Vincent and the Grenadines, the other countries showed positive growth rates in terms of area planted to cassava.
13
Table 11. Production of cassava in selected countries of the LAC region (2006-2010).
Country
Production of cassava (tonnes) % change
2009-2010 2006-2010 % change
2006 2007 2008 2009 2010
Caribbean Countries
Antigua and Barbados 60 78 72 77 99 + 23.7 + 23.7
The Bahamas 170 190 175 188 865 + 56.9 + 408.8 Barbados 379 448 466 691 400 - 42.1 + 5.5 Belize 239 327 304 328 331 +0.01 + 38.5 Dominica 836 819 752 809 1037 +28.1 + 24.0 Grenada 164 172 170 159 204 + 28.3 + 24.4 Guyana 23145 20184 4127 7100 10092 + 42.1 - 0.5 Haiti 400000 450000 435000 467822 599575 + 28.1 + 48.0 Jamaica 17711 18519 14991 13995 18490 + 32.1 + 4.4 Saint Lucia 1021 1030 1100 898 1151 + 28.1 + 12.7
Saint Vincent and the
Grenadines 602 770 707 780 527 -32.4 - 12.4
Suriname 4120 3948 2894 3931 4243 + 7.9 + 3.0
Trinidad and Tobago 1100 2190 2788 2479 2311 - 6.77 + 110.1
Dominican Republic 128369 128340 106291 165688 211105 + 27.4 + 64.4
Latin American Countries
Ecuador 69397 74241 102277 66299 53857 - 18.7 - 22.3
Nicaragua 105000 115000 128124 101908 73789 - 27.6 - 29.7
Paraguay 4800000 4800000 2218530 2610000 2624084 + 0.5 - 45.3
Source: FAO. http://faostat.fao.org/
Importance of cassava in selected Caribbean countries
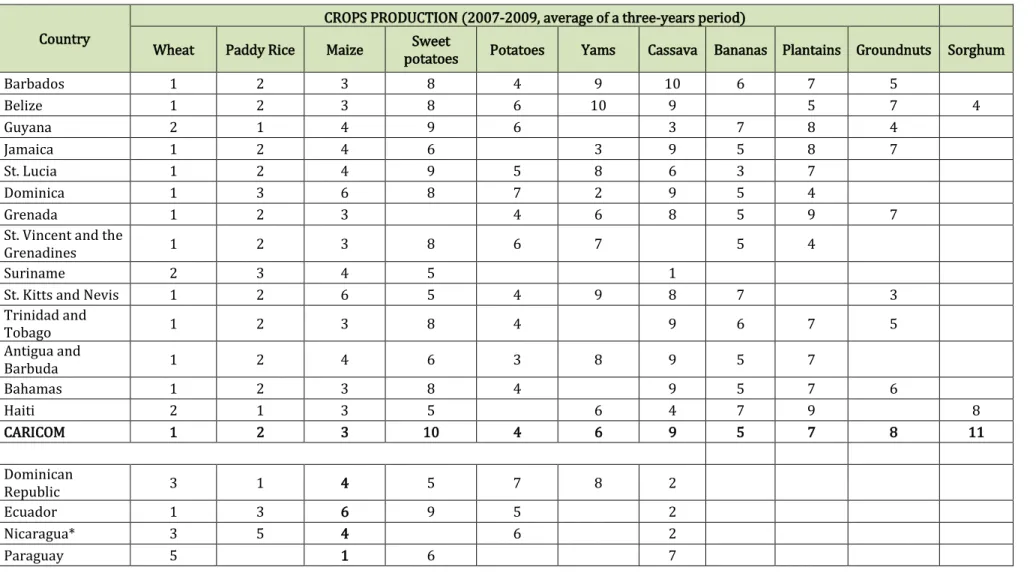
An analysis of the importance of cassava in the Caribbean countries, compared to other crops, is presented in Table 12. The parameter used for this analysis has been the amount of food supply available for consumption, from the different commodities available in each country, expressed as the Kilocalories / per capita / per day, and expressed as the average of the period 2007 to 2009.
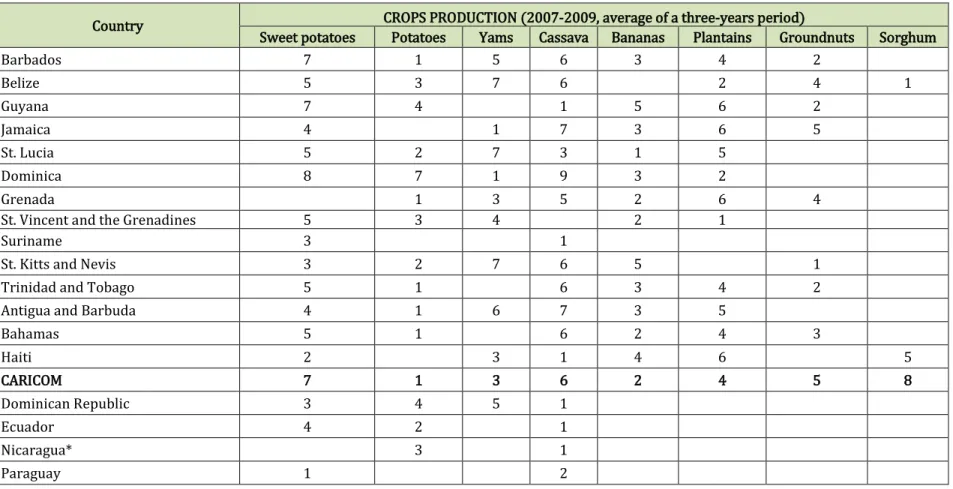
Table 13 presents the same analysis but excluding the three main crops consumed in the region: wheat, rice and maize. This provides evidence of the important role which crops such as potatoes, yam, groundnut (peanut), bananas, plantains and cassava play meeting the caloric needs of the population on the Caribbean region.
14
Table 12. Ranking of the most important crops in selected Latin American and Caribbean countries.
Country
CROPS PRODUCTION (2007-2009, average of a three-years period)
Wheat Paddy Rice Maize potatoes Sweet Potatoes Yams Cassava Bananas Plantains Groundnuts Sorghum
Barbados 1 2 3 8 4 9 10 6 7 5 Belize 1 2 3 8 6 10 9 5 7 4 Guyana 2 1 4 9 6 3 7 8 4 Jamaica 1 2 4 6 3 9 5 8 7 St. Lucia 1 2 4 9 5 8 6 3 7 Dominica 1 3 6 8 7 2 9 5 4 Grenada 1 2 3 4 6 8 5 9 7
St. Vincent and the
Grenadines 1 2 3 8 6 7 5 4
Suriname 2 3 4 5 1
St. Kitts and Nevis 1 2 6 5 4 9 8 7 3
Trinidad and Tobago 1 2 3 8 4 9 6 7 5 Antigua and Barbuda 1 2 4 6 3 8 9 5 7 Bahamas 1 2 3 8 4 9 5 7 6 Haiti 2 1 3 5 6 4 7 9 8 CARICOM 1 2 3 10 4 6 9 5 7 8 11 Dominican Republic 3 1 4 5 7 8 2 Ecuador 1 3 6 9 5 2 Nicaragua* 3 5 4 6 2 Paraguay 5 1 6 7
* Maize was the first ranked crop. Source: FAO. http://faostat.fao.org/
15
Table 13. Ranking of the most important crops in selected Latin American and Caribbean countries, excluding wheat, rice and maize.
Country CROPS PRODUCTION (2007-2009, average of a three-years period)
Sweet potatoes Potatoes Yams Cassava Bananas Plantains Groundnuts Sorghum
Barbados 7 1 5 6 3 4 2 Belize 5 3 7 6 2 4 1 Guyana 7 4 1 5 6 2 Jamaica 4 1 7 3 6 5 St. Lucia 5 2 7 3 1 5 Dominica 8 7 1 9 3 2 Grenada 1 3 5 2 6 4
St. Vincent and the Grenadines 5 3 4 2 1
Suriname 3 1
St. Kitts and Nevis 3 2 7 6 5 1
Trinidad and Tobago 5 1 6 3 4 2
Antigua and Barbuda 4 1 6 7 3 5
Bahamas 5 1 6 2 4 3 Haiti 2 3 1 4 6 5 CARICOM 7 1 3 6 2 4 5 8 Dominican Republic 3 4 5 1 Ecuador 4 2 1 Nicaragua* 3 1 Paraguay 1 2
16
Bananas were ranked first in seven of the fifteen Caribbean countries and in Ecuador. Yams were a very important crop, ranked number one in three countries and as the second most important crop in two other counties. Rice was the most important crop in Suriname, Guyana and Trinidad and Tobago. In terms of the high volumes produced, rice emerged as the top-ranked crop in the entire Caribbean region, with cassava being ranked as the number one crop only in Haiti. In Paraguay, cassava was also the first ranked crop. With the exception of Grenada, cassava was ranked among the top five important crops in all the other Caribbean countries. In Nicaragua and Dominican Republic, cassava was also among the top five important crops.
Cassava productivity in selected Caribbean countries
Table 14 presents data on the productivity of cassava in selected LAC countries, as the average of 10-year periods, over the last forty years. An analysis was also made of the changes in growth rates for the cassava productivity in each country. During the last decade (2000-2009), seven CARICOM countries obtained cassava yields higher than those obtained at the global level. Table 14. Cassava yield in selected LAC countries (average ten-year periods, 1970-2009).
COUNTRIES CASSAVA YIELDS (t/ha) % OF CHANGE 1990 – 2010
1970–79 1980-89 1990–99 2000–2009
Antigua and Barbuda 3.44 5.09 4.73 4.86 2.5
The Bahamas 12.34 10.73 9.15 13.42 46.7 Barbados 25.59 23.01 17.65 22.60 28.0 Belize 14.72 9.38 18.86 101 Dominica 10.11 10.56 9.93 9.67 -2.65 Grenada 8.64 7.01 6.12 7.28 18.9 Guyana 11.49 12.45 12.83 3.02 Haiti 4.24 4.07 4.00 4.82 20.6 Jamaica 9.03 11.45 17.44 20.48 17,5 St. Lucia 3.80 3.33 3.01 3.19 5.79
St. Vincent and the Grenadines 12.24 8.29 6.20 6.31 1.6
Suriname 6.58 6.73 14.29 25.32 77.2
Trinidad and Tobago 11.50 11.74 3.49 3.45 -1.2
CARICOM 4.56 4.35 4.45 5.13 15.3
Dominican Republic 4.54 5.56 6.58 8.28 25.8
Ecuador 9.38 8.08 4.52 4.43 -1.8
Nicaragua 4.45 11.25 11.18 9.91 -11.4
Paraguay 14.55 15.17 14.44 17.65 22.1
Latin America Total
(South and Central) 12.36 11.79 12.28 14.77 20.2
Africa Total 6.42 7.40 8.25 10.34 25.3
Asia Total 10.32 13.81 18.43 26.69 44.7
World Total 8.62 9.55 9.89 12.71 28.5
17
During the same period, yield in seven other countries were lower than the global average yield, while three countries, Barbados, Jamaica and Suriname reported outstanding yield, closer to those obtained in Asia, the region with the highest productivity globally. In the countries of Latin America included in this analysis, only Paraguay obtained cassava yield above the world average, with the other three countries, Nicaragua, Ecuador and Dominican Republic obtaining yields below the average global yield. Considering the changes in average yield obtained during the last two decades, for each country, only in two countries, Dominica and Trinidad and Tobago, cassava yield obtained during the last decade, were lower than those obtained two decades ago. The rest of the countries showed positive growth rates in cassava productivity similar to the Dominican Republic and Paraguay in Latin America; Ecuador maintained productivity at almost the same level and Nicaragua presented a negative trend in the growth of cassava yield.
An analysis of the data reveals that Asia obtained impressive gains in cassava productivity, increasing by 44% in the last decade, in comparison with two decades ago. Africa and Latin America also showed positive, although smaller, growth rates in productivity, increasing by 25.3% and 20.2%, respectively, during the last decade, compared to two decades ago. CARICOM registered a positive growth of 15.3% in productivity during the last decade, in comparison with yield obtained two decades ago. A further analysis of the more recent changes (2006-2010) that have occurred in cassava productivy in the LAC region is presented in Table 15.
In 2010, only four countries in the Caribbean (The Bahamas, Barbados, Suriname and Jamaica), obtained cassava yield higher than the average global yiels, while Belize and Guyana were almost at the same level as the global average and the other seven countries had lower yield than the rest of the world (including the entire African region).
In terms of the trends in changes of cassava yield for the five years period (2006-2010), it was observed that only four countries had maintained a positive trend in yield growth (Antigua and Barbuda, The Bahamas, Grenada and Guyana). In three countries - Belize, Jamaica, and St. Vincent and the Grenadines - a constant negative trend was noted during the same period.
Some countrties like Barbados and Suriname showed positive growth in the first part of the period analyzed but in the last year (2009-2010), the situation was reversed and the cassava yields dropped significantly. On the other hand, countries like Haiti, St. Lucia, Dominica and Trinidad and Tobago that reported negative growth at the beginning of the period showed positive growth in the average yields obtained during the period 2009-2010.
The data presented for the Latin American countries indicated that during 2010 yields obtained in the Dominican Republic, Ecuador and Nicaragua were not only below the global average yields but were also lower than those obtained in Africa. Only Paraguay had cassava yields higher than those obtained on average in Africa and Latin America. For the period 2009-2010, CARICOM showed a positive growth rate similar to that obtained in Africa. During the same period, the Asian region reported a negative growth rate in cassava yield.
Table 16 depicts information on the average annual growth rate of cassava yield in selected countries of the LAC region for 10-year periods. During 2000-2009, five CARICOM countries (Dominica, Guyana, Jamaica, St. Lucia and St. Vincent and the Grenadines) showed negative growth for average annual cassava yield. The other eight countries grew positively albeit with modest increases in comparison with other cassava growing areas worldwide. Guyana was the country with the largest negative growth rate for average annual cassava yield during this period.
18
Table 15. Cassava yield in selected LAC countries (period 2006-2010).
COUNTRY
PRODUCTION OF CASSAVA (tonnes) % CHANGE
2009-2010 % CHANGE 2006-2010
2006 2007 2008 2009 2010
Caribbean Countries
Antigua and Barbados 4.0 5.20 5.54 4,81 5.21 8.3 30.2
The Bahamas 10.63 10.56 10.94 9.89 22.18 124.2 108.6 Barbados 18.75 17.92 21.18 25.59 20 -21.8 6.6 Belize 14.06 17.21 13.22 13.12 12.73 -2.9 -9.4 Dominica 9.61 8.19 8.36 7.42 7.86 5.9 -18.2 Grenada 6.56 9.05 10.0 7.57 8.16 7.79 24.4 Guyana 11.02 10.91 10.32 10.92 11.21 2.65 1.72 Haiti 6.25 4.41 4.39 3.90 4.13 5.89 -33.9 Jamaica 18.62 18.67 18.60 18.64 18.53 -0.5 -0.4 St Lucia 3.80 3.03 3.06 2.05 2.18 6.3 -42.6
St Vincent and the
Grenadines 7.72 6.42 6.61 6 3.36 -44 -56.4
Suriname 20.0 25.47 25.17 27.68 25.26 -8.7 26.3
Trinidad and Tobago 3.49 3.03 5.10 2.76 3.04 10.1 -12.9
Dominican
Republic 7.22 7.56 7.56 7.72 8.51 10.2 17.9
Latin American Countries
Ecuador 3.43 4.51 5.12 3.12 3.20 2.5 -6.7
Nicaragua 9.55 9.58 8.07 8.71 8.85 1.6 -7.3
Paraguay 16.0 16.0 13.0 14.50 14.79 2 -7.5
CARICOM Region 6.60 4.69 4.57 4.05 4.30 6.1 -34.8
Latin America Total.
(South and Central) 13.66 13.68 13.47 13.32 13.42 0.75 -1.75
Africa Total 9.68 9.50 9.80 9.67 10.30 6.5 6.4
Asia Total 18.38 19.20 19.31 20.21 19.33 -4.3 5.1
World Total 11.91 11.97 12.20 12.27 12.41 1.14 4.19
Source: FAO. http://faostat.fao.org/
During this decade, the CARICOM region as a whole reported a drastic reduction in the average growth rate of cassava yield, while a decade ago, the growth rates for the region were positive. It was the only cassava growing region worldwide that showed negative growth rates for average yield.
The Latin American region had the highest growth rate for average annual cassava yield during 2000-2009, with three countries (Ecuador, Nicaragaua and Paraguay) showing negative growth rates for cassava yield and only the Dominican Republic reporting positive growth rates.
On a global basis, Latin America showed very high growth in cassava productivity during the last decade. Africa also grew positively but Asia’s positive growth rate was reduced considerably,
19
compared to the previous decade. Worldwide, the growth rates for average annual cassava yield were high but lower than the growth rates from a decade ago (Table 16).
Table 16. Average yield annual growth rate (%) for cassava in selected LAC countries (1970 – 2009).
COUNTRIES 1970-79 AVERAGE YIELD ANNUAL GROWTH RATE (%) 1980-89 1990-99 2000-2009 1963-2012
Antigua and Barbuda -0.01 0.03 0.01 0.04 0.46
The Bahamas 0.15 -0.24 -0.10 0.02 0.05 Barbados -0.11 -0.04 -0.01 0.01 -0.11 Belize 0.02 Dominica 0.40 -0.34 0.04 -0.10 -0.43 Grenada -0.04 -0.13 0.10 0.05 -0.26 Guyana 0.01 -0.22 Haiti 0.34 0.52 0.04 0.01 0.53 Jamaica 0.11 0.12 0.04 -0.01 0.14 St Lucia -0.53 -1.62 -0.11 -0.18 -1.07
St. Vincent and the Grenadines -0.44 -0.06 0.10 -0.03 -0.21
Suriname -0.04 0.03 0.02 0.04 0.10
Trinidad and Tobago 0.08 -0.16 1.60 0.02 -0.14
CARICOM 0.46 1.19 0.18 -0.03 0.59
Dominican Republic -0.01 0.05 -0.08 0.23
Ecuador -0.07 -0.06 0.01 -0.04
Nicaragua 0.08 -0.17 -0.01 -0.08
Paraguay 0.08 0.07 -0.17 -0.05
LATIN AMERICA TOTAL (South
and Central) -0.15 0.21 0.09 0.27 0.12
Africa Total 0.22 -0.25 -0.16 0.15 0.51
Asia Total 0.16 0.18 0.29 0.07 0.21
World Total 0.36 0.48 0.35 0.21 0.51
Source: FAO. http://faostat.fao.org/
Main facts
A comparison of cassava yield obtained in the African region with yield obtained worldwide indicates that the difference is narrowing. During the decade 2000-2009, average cassava yield in Africa were 18.6% lower than average yield worldwide, whereas twenty years ago, this difference was 22.6%.
A comparison of the average cassava yield obtained in Asia with average yield obtained globally, indicates that during 2000-2009, cassava yield in Asia were 110% higher than those obtained worldwide. During 1990-1999, yield in Asia were 86.3% higher and two decades earlier (1980-89), they were also higher but only by 44%. This data clearly indicates the impressive growth in cassava productivity that has been achieved in the Asian region over the last three decades.
20
Cassava technical and technological profile in selected Caribbean countries
An electronic survey was implemented during the second half of 2014, as part of the FAO/ IICA / CLAYUCA initiative, aimed at improving the knowledge and information about the current status of the cassava sector in the Caribbean (CARICOM region and the Dominican Republic). The survey included sections with specific questions about the technical and technological profile of cassava systems in the selected countries. Some of the findings are presented below.
About 51% of the persons that responded considered themselves as cassava producers. In the region, cassava producers can be classified in three main groups:
- Category 1: planting small-scale areas, using traditional cassava production technologies, and generally obtaining low yields.
- Category 2: planting medium-scale cassava areas, using some type of modern production technologies, and generally obtaining medium yields.
- Category 3: planting large-scale areas, generally using modern technologies, and obtaining high yields.
Table 17 shows the classification of cassava farmers based on the yield obtained, in some Caribbean countries. The data clearly indicates the very low yield obtained by small-scale
farmers, using traditional technologies, which in most countries do not exceed 10 t/ha. Suriname farmers reported the lowest yield between 1.5 and 5.5 t/ha, followed by Jamaica (central
Jamaica) with the yield between 4 to 8 t/ha, Dominican Republic with the yield between 6 to 10 t/ha and St Vincent and the Grenadines, Trinidad and Tobago and Guyana with minimum yield of 8 t/ha. Barbados (22 t/ha), St. Lucia (12-15 t/ha) and some exceptional producers of Trinidad and Tobago reported yield between 15 to 25 t/ha, representing the highest yield among the small-scale producers that responded to the survey.
Table 17. Classification of cassava farmers in countries of Caribbean based on farm size and yields.
COUNTRY Category 1 (small-CASSAVA YIELDS OBTAINED, BY TYPE OF FARMERS (t/ha) scale) Category 2 (medium-scale) Category 3 (large-scale)
Barbados 22 32-40
Guyana 8-10 10-20
Jamaica (central part) 4-8 15-20 20-30
St. Lucia 12-15 20-30 30-40
St. Vincent and the Grenadines 8 15-25
Suriname 1.5-5.5 15-25
Trinidad and Tobago 8-15 11-25 23
Dominican Republic 6-10 14-17 20-25
21
Category 2 farmers cultivated medium size areas and used some level of improved technology for cassava production, reported the yield between 10 and 25 t/ha, with the exception of Barbados that reported cassava yield between 32 to 40 t/ha. St. Lucia, Jamaica, St Vincent and the
Grenadines, Trinidad and Tobago, Dominican Republic and Suriname reported cassava yield between between 15 and 25 t/ha and Guyana between 10 and 20 t/ha.
Farmers producing cassava on large scale farms and using modern technologies were not very common in CARICOM countries. Commercial-scale cassava farmers were reported in Jamaica, with yield of 20 to 30 t/ha; St. Lucia with yield of 30 to 40 t/ha; Trinidad and Tobago with yield of 30 to 40 t/ha; and the Dominican Republic with yield of 20 to 25 t/ha.
Most producers included in the survey had small cassava plots: 46% indicated having less than 1 ha planted to cassava, while 25% indicated having cassava areas between1 to 3 ha (Figure 2).
Figure 2. Average size of cassava areas in selected countries of the Caribbean region. Source: FAO/IICA/CLAYUCA Survey.
Cassava varieties grown in selected Caribbean countries
One of the most important cassava varieties grown in the region is MCol-22, mentioned by 13% of the survey participants from Jamaica, St Lucia, and Trinidad and Tobago. The popularity of this variety among cassava growers in the region was attributed to some specific traits: high yields, high resistance to pests and diseases, early maturing, as well as good market acceptance and good cooking quality. Other important cassava varieties mentioned by farmers were: M Mex 59 (Guyana, Trinidad and Tobago), CM 516 (Jamaica) and CIAT Hybrid (Jamaica). Farmers’ preference for these varieties was principally related to high yielding characteristics.
Table 18 presents the main cassava varieties that are currently grown in each of the countries included in the survey and the main attributes identified by the farmers. Table 19 presents additional information about the most common varieties found in selected countries of the Caribbean region.
Experience of cassava farmers in selected Caribbean countries
17% of the survey respondents indicated that they have been planting cassava for more than 20 years. 20% of the farmers have been planting the crop for 10 to 20 years. Near two thirds of the farmers included in the survey (64%) indicated that their experience as cassava growers were
46 25 8 8 13 0 5 10 15 20 25 30 35 40 45 50
< 1 ha 1-3 has 3-5 has 5-10 has 10-20 has
Pe
rc
en
ta
22
less than 10 years and near one fourth of the farmers stated that their experience as cassava growers were less than 5 years (Figure 3).
Table 18. Main cassava varieties grown in selected Caribbean countries and farmers’ reasons for the preference. COUNTRY MOST POPULAR CASSAVA VARIETY
FARMERS OPINIONS FOR THEIR PREFERENCE OF THE MAIN CASSAVA VARIETIES Good yields Good cooking quality Good market acceptance Pest and disease resistance Early maturing Good yields in drought periods
Barbados White stick X
Guyana Uncle mack X X X X Yankee red stem X X X X Brown stem X X X X X Jamaica MCol22 CM516 X X X X X X X St Lucia MCol22 X X X
Suriname Valencia Botro cassava X
(gele cassave) X X X X X X
Trinidad and
Tobago MMex 59 CIAT Hybrid X X X X X X X X X
Dom. Rep. Valencia X X X X X
Source: FAO/IICA/CLAYUCA Survey.
Table 19. Principal cassava varieties planted in selected countries of the Caribbean region.
COUNTRY CASSAVA VARIETIES
Barbados - White stick - Butterstick (Brown stick) - M. Mex 23 - M. Mex 55 Tacana Local 1
Guyana - Uncle Mack - Bad woman - MMex 59 - MMex 52 - Butter stick - Mexican - Brown stem - Kairuni Cassava - White stick - Smokey Prolific - Santa Rosa Magenta - Yankee Jamaica - Blue Bud - Cuba Sweet - Prison Farm - Real Sweet - Rockwood - Manson - Sweet cassava - Bitter cassava - CM516 - CM849 - CM3306-4 - CM3299 - CM6119-5 - CM523-7 - CM2772-3 - CM2776-5 - MCOL 22 - MCOL 1505 - BRA383 - PER183 Belize - Panamá - Sweet Cassava - Blue Bird - Rasta - Bitter cassava
Dominica - Bitter Butter Stick - White Stick 100 pounds
23
COUNTRY CASSAVA VARIETIES
Montserrat - Red Stem - Mingo Sweet - Fountain Bitter - Green Stem - Fountain Sweet- - Elmont Pink - Guyana Sweet - Belmont Green
St. Lucia -Bitter variety - Sweet variety - MCOL 22 Whyme
St. Kitts and Nevis -Coconut -St. Lucia Sweet - Mingo Sweet - Sugar - Negro - Salt St Vincent and The
Grenadines - Punt stick- - Butter stick - White stick - M Bra 383 - CM 3306-4 - CM 7514-8 - CM 7514-7 - CM 4919-1 - SM 1565-15 Suriname - Local yellow - Valencia - Sweet cassava - Bitter cassava - Reditikie - Botro cassava
(gele cassave) Trinidad and Toabgo - Blue bud - Butter stick - CIAT hybrid - Maracas black stick - White stick - Pickney mumma - Sweet cassava - Bitter cassava - MMex 59 - MMex 60 - MMex 61 - CM3306-4 - CM3299 - CM6119-5 - CM523-7 - BRA383 - M PER183 - CM2772-3 - CM2766-5 - MCOL 2215 - MCOL 1505 - CG 1450-4 Source: FAO/IICA/CLAYUCA Survey.
Figure 3. Experience of cassava farmers included in the survey. Source: FAO/IICA/CLAYUCA Survey.
Origin of the cassava planting material
The majority of the farmers interviewed (83%) obtained planting material from their own cassava fields. 13% of the farmers interviewed indicated that they used both, their own planting material and also material purchased from other farms. A small group of farmers (7%) indicated that they only used planting material purchased from other farms. Finally, around 10% of the farmers indicated that they used only planting material obtained through research and
technology transfer agents and through their participation in cassava technology research and development activities (Figure 4). Cassava gene banks were considered the best source for
37 27 20 17 0 10 20 30 40
0-5 years 5-10 years 10-20 years > 20 years
Pe
rc
en
ta
24
farmers to have access to improved cassava varieties. In the LAC region, the germplasm bank of the International Centre for Tropical Agriculture – CIAT, Cali, Colombia, is the largest cassava genebank, and it is also the main source from which cassava farmers could have facilitated access to improved cassava varieties and good quality planting material.
Introduction of improved cassava germplasm in the Caribbean countries
This could be one of the best strategies for promoting improvements in the productivity of the crop. One of the sections included in the survey aimed to obtain specific, updated information on the existence of cassava gene banks in the Caribbean countries. 65% of the respondents
indicated that there is a cassava gene bank in their countries that could be used as a source for obtaining new, improved cassava varieties; however, 36% of the respondents indicated that they had not used any new variety for the past 10 years, despite the fact that they knew that during this period, there were introductions of improved cassava varieties in their countries.
Figure 4. Origin of the cassava planting material used by cassava farmers included in the survey. Source: FAO/IICA/CLAYUCA Survey.
A recurrent, very common problem in countries of CARICOM is the lack of tracking / traceability of the varieties after release. In many instances, improved cassava varieties have been
introduced, and some years later, it has been difficult to keep track of these varieties. In some cases, they have been completely lost. Very seldom, these introduced varieties become cassava genetic resource pools that can be used widely by the farmers, especially the small-scale farmers. Interestingly, 93% of the respondents expressed that they would be interested in paying to acquire planting material of a new cassava variety, if they could be convinced that this new variety would yield better than the varieties they were currently growing.
This is a good indicator that the cassava farmers in the region are open to innovations and are willing to invest in acquiring them. Table 20 presents a list of the principal cassava varieties that have been introduced to the CARICOM countries, as indicated by the respondents to the survey.
83 13 7 10 0 10 20 30 40 50 60 70 80 90
Own planting material from
previous harvest Own planting material and alsoplanting material purchased from other cassava farms
Only planting material
purchased from other farms onbtained through researh &Only planting materail technology transfer agents
Pe
rc
ent
25
Table 20. Cassava varieties introduced in the Latin America and Caribbean region.
COUNTRY CASSAVA VARIETIES INTRODUCED YEAR AND ORIGIN
Jamaica CM 6119-5 CM 3306-4 CM 523-7 2012 CIAT Cassava Germplasm Bank CM 2772-3 MCOL 2215 BRA 383 Per183 CM 2766-5 MCOL 1505 CM 3299 CM 516 CM 849 CM 1450-4 CM 523-7 CM 2766-5 2011 CIAT Cassava Germplasm Bank CM 2772-3 CM 3306-4 CM 6119-5
BRA 383 MCOL 1505 MCOL 2215
HMC 7 PER 183 Trinidad and Tobago MCOL 2215 MMex 59 CM 3306-4 2005 CIAT Cassava Germplasm Bank CM 523-7 BRA 383 CG 1450-4 CM 2766-5 CM 6119-5 MCOL 2215 MCOL 1505 CM 5306-8 MCOL 1522 CR 30 2013 CIAT Cassava Germplasm Bank CR 63 CR 64 CR 67 PER 183 Suriname CM 507-37 CM 523-7 CM 3306-4 2002 CIAT Cassava Germplasm Bank 2014 CIAT Cassava Germplasm Bank CM 4574-7 CM 4843-1 CM 5306-8 CM 6119-5 CM 6740-7 CM 6754-8 CM 6921-3 CM 5306-8 MCOL 1522 CR 30 CR 63 CR 64 CR 67 PER 183 CM 7073-7 CM 7514-7 CM 7514-8 CM 7951-5 CM 8027-3 SM 805-15 SM 909-25 SM 1411-5 SM 1565-15 BRA383 PER 183 M TAI 8 CM 2166-6 CM 2563-5 CM 2766-3 CM 3110-8 CM 5253-1 CM 7086-13 CM 7596-5 SM 667-1 Barbados
M Mex 23 M Mex 55 MCol 673
1979
M Col 22 To 172 Tacana
CM 323 375 CM 308 197 CM 305 122
M Col 1684 Butterstick Local 1
Local 2 CG 1450-4 CM 2766-5 CM 6119-5 2014 CIAT Cassava Germplasm Bank MCOL 1823 PER 183 CM 2600-2 CM 6438-14 CUB 75 CUB 74 CM 6740-7 SM 1219-9 Dominican Republic CM 507-37 CM 523-7 CM 2772-3 2003 CIAT Cassava Germplasm Bank CM 3306-4 CM 4574-7 CM 4843-1 CM 4919-1 CM 5306-8 CM 6119-5 CM 6438-14 CM 6740-7 CM 7033-3 CM 6921-3 CM 7073-7 CM 7514-8 CM 7951-5 CM 8027-3 SM 805-15