8211
Detection of proteins induced in the haemolymph of
Biomphalaria pfeifferi infected with Schistosoma
mansoni.
Okonjo Edward1, Yole Dorcas1, Eric Korir2, Nguu Edward2, Anyango Beatrice3 and Ogoyi Dorington4
1 School of Biological Science and Technology, Technical University of Kenya, P.O. Box 52482, 00200, Nairobi,
Kenya
1 School of Biological Science and Technology, Technical University of Kenya, P.O. Box 52482, 00200, Nairobi,
Kenya
2 Department of Biochemistry, University of Nairobi, P.O. Box 30197, 00100, Nairobi, Kenya
3School of Agri-business, Jaramogi Oginga Odinga University of Agriculture, Science and Technology, P. O. Box
210 - 40601 Bondo – Kenya.
4Department of Biochemistry and Biotechnology, Technical University of Kenya, P.O. Box 52482, 00200, Nairobi,
Kenya
Corresponding author email: dogoyi@gmail.com
Original submitted in on 19th December 2015. Published online at www.m.elewa.org on 30th April 2015
http://dx.doi.org/10.4314/jab.v88i1.2 ABSTRACT
Objectives: Snail-schistosome interactions in relation to immunological, and biochemical changes induced in the host’s tissues by the developing intramolluscan stages of the parasite form an integral part in understanding the biology of infection. This study focused on determining whether there are induced proteins in an infected snail haemolymph and to determine the cross reactivity of the proteins with antibodies raised against the cercariae and worm antigens.
Methodology and results: Proteomic analysis was carried out to analyze differentially expressed proteins. This was done by separation of proteins by SDS-PAGE and 2D electrophoresis on infected snail haemolymph. Later western blotting was done to check for cross reactivity of induced proteins and antibodies. The protein profiles in SDS-PAGE revealed a complex mixture of polypeptides some of which were induced or suppressed on specific days during the infection period. Separation of haemolymph proteins by 2D electrophoresis analysis revealed a progressive increase of expressed proteins during the parasite’s developmental period in the snail, however there was no specific trend in distribution of the acidic or basic proteins. Finally, haemolymph proteins from infected snails and the control (uninfected) snails were not recognized by antibodies raised against S. mansoni antigens namely Soluble Worm Antigen (SWAP) and Soluble Cercariae Antigen (SCA).
Conclusions and application of findings: Snail- schistosome interaction leads to suppression and induction of proteins. This is important in understanding stage specific interactions of the parasite during intramolluscan development. Lack of cross reactivity was an indication that these proteins could not be used as immunogens for vaccine design.
Key words: Schistosomiasis, Biomphalaria pfeifferi, haemolymph, induced proteins
Journal of Applied Biosciences 88:8211– 8222
8212 INTRODUCTION
Schistosomiasis remains a public health problem in several parts of the world, particularly in Africa, with ≥200 million people infected by the year 2009. The disease affects at least 240 million people worldwide, and more than 700 million people live in 78 endemic countries (WHO 2013). Twenty thousand deaths are associated with the severe consequences of infection, which include bladder cancer or renal failure in Schistosoma haematobium and liver fibrosis and portal hypertension in S. mansoni. Mortality rates due to non-functioning kidney (from S. haematobium) and haematemesis (from S. mansoni) have been estimated at 150 000 and 130 000 per year, respectively (WHO, 2002). Current estimates suggest that 252 million people are infected with schistosomes, with approximately two-thirds of the cases caused by Schistosoma haematobium, one-third caused by Schistosoma mansoni, and approximately one percent caused by Schistosoma japonicum and S. mekongi (Hortez et al., 2014). The host-parasite relationship is a powerful determinant of the biology of infection and disease. Research on snail-schistosome interactions has the potential for making an important contribution to the study of co-evolution or reciprocal adaptation. The association between Biomphalaria and Schistosoma mansoni could well be an excellent model for studies aimed at understanding aspects of the compatibility or adaptations of this species to schistosomes. Snail hosts and schistosomes appear to have effects on each other’s genotype. Aspects of snail-schistosome interactions in relation to immunological, and biochemical changes induced in the host’s tissues by the developing intramolluscan stages of the parasite, may help to identify biochemical or genetic targets for drug and vaccine design. Manipulation of the intermediate host through these targets could break the cycle of human and snail infection by schistosomes (Afaf and Soad, 2006). Several studies have been done for a long time to understand the interaction between S.mansoni and Biomphalaria in relation to their antigenic similarity and protein structure. This has been thought to be a good basis for vaccine development. The reaction of the haemolymph and the tissue of infected intermediate
hosts, Biomphalaria alexandrina and Bulinus truncatus to Schistosoma mansoni and S. haematobium antigens were investigated and a positive reaction was an indicator for the presence of a schistosome-antigen in the snails (El-Dafrawy et al., 2007).Initial studies by Jackson (1976) showed that S. haematobium cerceriae developing in the snail haemolymph shared antigens with their molluscan host. Similarly, Yoshino and Cheng (1978) reported that newly hatched miracidia of S.mansoni posses membrane associated determinants antigenically similar to certain components of the haemolymph from the snail B. glabarata. Two S. mansoni proteins of 43 and 39 kDa (Sm43 and Sm39) reacted with rabbit antibodies produced against B. glabrata proteins. Two-dimensional gel electrophoresis of miracidial proteins indicated that Sm43 and Sm39 were acidic proteins (pH 4.8 and 4.9 respectively) and were invitro translated from miracidial messenger RNA in the same molecular forms. Sm43 and Sm39 were expressed by all parasite stages of S. mansoni. Using anti-Sm43 and anti-Sm39 mouse sera, it was shown that both parasite proteins were antigenically related and cross-reacted with a unique 39 kDa (pH 4.9) protein from B. glabrata (Bg39). Cross-reactive components were found in fresh water and land snails but not in vertebrate tissues, suggesting that the 39-kDa protein was specific for invertebrates (Dissous and Capron, 1989). There is need for a different kind of vaccine for schistosomiasis because existing schistosome antigens have not given adequate protection and they are not available in large enough quantities. An understanding of vaccine strategies represents an essential component for the future control of schistosomiasis as an adjunct to chemotherapy(Mc Mannus and Loukas 2008). The discovery of new vaccine targets by the use of genomics and proteomics is expected to lead to a progress in vaccine development (McWilliam et al., 2012). Untangling the complex interactions of trematodes and snails promises fresh opportunities for intervention to relieve the burden of parasitic disease (Lockyer et al., 2004). This study sought to find out whether there are induced proteins in
8213 infected snail haemolymph and determining their cross reactivity with S. mansoni sera which forms a basis for immunogens to be used for vaccine
development. Since the snail is a bigger organism than the parasite, enough material can be obtained.
MATERIALS AND METHODS
Maintenance of snail host in the malacology laboratory: Laboratory bred snails at the Institute of Primate Research (IPR) were used. The snails were housed in a temperature-controlled (20-250C) snail room
in plastic tanks. The tanks were washed in unchlorinated tap water. Sand and gravel were sterilized by heating in an oven at 1500C for 12 hours cooled and layered in the
tanks. They were filled three-quarter way with unchlorinated tap water. Maintenance of the snails was done as previously described by Yole et al. (1996). Water was changed twice a week while soft lettuce (dipped in hot water and cooled) was added to feed the snails. Daphnia were added to aerate the tanks.
Harvest of S. mansoni eggs from baboons’ faeces and hatching of miracidia: A faecal sample from infected baboons was collected and placed in a plastic beaker and 1 litre of saline added to completely cover the sample. The mixture was stirred with a wooden spatula to obtain a thin suspension of saline and faecal material. The sample was then sieved through two sieves (mesh size 600µm and 250µm) into a collecting tray and the filtrate transferred into urine jars. The sieve was sprayed with saline from a wash bottle to ensure that no eggs remained in the mesh and then filled with saline and left for 30 minutes in the dark. The supernatant was poured off without disturbing the sediment. The above procedure was repeated three times until the supernatant was clear and the sediment transferred into a glass petri dish. The urine jars was sprayed with water thoroughly using a wash bottle to ensure the transfer of all deposits to the Petri dish containing fresh water. The Petri dish was placed under a lamp of 100 watts for 30 minutes. Emergence of miracidia was checked using the dissecting microscope with 10X magnification.
Infection of snails: Snails were infected using infecting wells. A Pasteur pipette with a rubber bulb was used to pick 5-6 miracidia from the glass Petri dish under the dissecting microscope. The miracidia were then dispensed into each well in a 24 well culture plate. Snails were transferred individually into these wells and the plate covered to prevent the snails from crawling out. The setup was left for 30 minutes to allow miracidial penetration, after which snails were transferred into newly prepared aquarium tanks. At 4 weeks post-infection, the
tanks were covered with dark clothes to prevent trickle shedding of cercariae.
Collection of heamolymph and antigens: Bleeding for clean snails was done on a single day, while for the infected snails bleeding was done on days 8, 15 and 32 post-infection. The shell of each snail used was cleaned with 70% alcohol. The snail was punctured near the innermost coil next to the heart by use of a 28G U-100 insulin needle and fresh haemolymph drawn out. About 10µl of haemolymph was drawn from each snail. The total haemolymph collected from the infected and clean snails was centrifuged in a microfuge at 10,000 rpm for 10 minutes to remove the haemocytes. The supernatant or cell free haemolymph (plasma) was aliquoted out and protein concentration determined by the Lowry et al. (1951) method. The plasma was stored at -200C for use
in proteomic assays. A strain of S. mansoni originally obtained from humans and maintained in the Olive baboon (Papio anubis) at IPR was used for all the work involving preparation of soluble antigens. Soluble cercariae antigen (SCA) was obtained through shedding of cecariae from infected snails for 2 hours. The cercariae were chilled for 2 hours at 4oCin order for them to settle at
the bottom of the beaker. These were then centrifuged at 350g for 5 minutes at 4oC. The supernatant was removed.
The cercariae were washed in distilled water twice by centrifuging at 350g for 5 minutes at 4oC as above. The
pellet was washed in sterile phosphate-buffered saline (PBS). This was then sonicated at 23 kHz, 16µm amplitude with intervals on ice to prevent overheating for 10 minutes (Soniprep 150 UK). The homogenate was centrifuged for 1 hr at 100,000 g and 4oC to form the
soluble protein supernatant. The protein estimation was done as per the method by Lowry et al. (1951). Soluble Worm Antigen (SWAP) was prepared from adult S. mansoni worms obtained by perfusion at the 5th week
from mice infected with S. mansoni cercariae. The mice were perfused to recover worms from the liver and the mesenteric veins. The perfusion fluid was pumped through the left ventricle so that it passed through the arterial system. The fluid flushed out the worms in the lever and mesenteries. The worms were washed in sterilized PBS. They were then sonicated at 23 KHz, 16µm amplitude with intervals on ice to prevent overheating for 10 minutes. The homogenate centrifuged
8214 for at 100,000 g, 4oC for 1 hour to obtain the soluble
protein.
Electrophoretic analysis
Determination of protein profiles: SDS-PAGE using the method by Laemmli, 1970 was used to observe the protein profiles of the haemolymph from both infected and clean snails. A gradient gel of 5-20% with a stacking gel (4%) was used in the analysis. Samples were prepared in loading buffer and heated at 95-1000C for five minutes to
denature the proteins. Plasma from control and infected snails were loaded onto adjacent wells to facilitate comparison.70 µg/ml of each sample was loaded onto the wells. The gel was run at a constant current of 20mA until the dye reached the end of the stacking gel then the current adjusted to 25mA for about 1 hour until the dye reached the end of the gel and the proteins profiles were visualized by staining the gel with Silver stain (Wray et al., 1981).
Two dimensional (2D) Gel Electrophoresis: Haemolymph samples collected on day 0, 15 and 32 were each mixed well with the solubilization buffer (8M urea, 4% NP-40, 0.5% Triton x-100, 1.6% ampholine pH 5.0 to 7.0, 0.4% Ampholine pH 3.0 to 10 and 20mM Dithiothreitol (DTT) in the ratio of 2:1 respectively to enhance complete solubilization and denaturation of proteins. The proteins were then separated in the first and second dimension. In the first dimension, isoelectric focusing was carried out according to the procedures of O’ Farrell, (1975). A 4% acrylamide monomer solution comprising of 9.2M urea, 2% NP-40, 1.6% ampholine (pH 5-7) and 0.4 ampholine (pH 3-10) was cast onto capillary tubes and allowed to polymerize. After polymerization, a pH gradient was established by pre-electrophoresis of the rod gel in 10mM H3PO4 anolyte and 20mM NaOH
catholyte at 500V for 10 minutes. The haemolyph samples were then loaded onto gels and overlaid with the sample overlay buffer (7M urea, 0.8% ampholine pH 5-7 and 0.2% ampholine pH 3-10 and 0.05 % bromophenol blue). Using fresh electrolytes electrophoresis was carried out at 500v for 10 minutes followed by 750v for 3.5 hours. After isoelectric focusing, the gels were extruded from the capillary tubes using a 1ml syringe filled with the equilibration buffer ( 6M urea, 2% SDS, 375mM Tris pH 8.8, 20% glycerol and 2% DTT). After noting the orientation of the gel (basic and the acidic end), the equilibration buffer was added onto the parafilm together with the SDS sample buffer in the ratio of 1:1 and allowed to settle for 15 minutes. For the second dimension a 10%, SDS slab gel was prepared as described above. This was stacked using a 4% acrylamide gel and after pouring off
the equilibration buffer from the isoelectric focusing gel, the tube was carefully laid on the second dimension gel noting the cathode and the anode end and resolved alongside SDS molecular weight standards. Separation was carried out according to the protocol described for SDS-PAGE at a constant current of 20mA/gel until the bromphenol blue dye reached the bottom of the gel. Silver staining method (Wray et al., 1981) was used to visualize the spots. The second dimension gels were analyzed using Melanie 2D gel analysis software (GENEBIO VERSION 7.0). Apparent molecular weights of proteins were determined by analysis against the co-electrophoresed 14–94 kDa SDS-PAGE molecular weight standards. Apparent isoelectric points (pIs) of proteins were determined by calibration against the 3–10 pH gradients of IEF electrophoresis. Results obtained by computer-aided evaluation were compared with visual analysis of the original gels. Changes in specific spots were recorded only when they occured in all the replicated gels. Differentially expressed protein spots with pH less than, equal to or greater than seven were categorized as acidic, neutral or basic, respectively. Quantitative comparisons between gels were achieved using normalized spot volumes. Differences without or equal to ±1.5-fold change in any of the treatments against control among matched protein spots were considered significant.The spots were categorized as up- or down-regulated if the differences were ≥1.5 or ≤1.5, respectively or unaffected (if the differences were within ± < 1.5-fold change
Preparation of antibodies and Western blotting: Two white New Zealand rabbits were used for preparation of antisera for both the worm and cerceriae antigen. An intramuscular injection of 50µg per ml of antigen preparation in 0.5ml Freud’s complete adjuvant was given at the initial dose. Boosting was done 4 times after every two weeks. Each boost consisted of 25µg per ml of antigen in 0.5ml Freud’s incomplete adjuvant for each rabbit. The antibody activity against the immunizing antigen was tested using immunodiffusion analysis (Ouchterlony, 1968) and was used for western blotting. Western blotting was carried out using semi dry blotter (Biorad). All the samples from the snail haemolymph (day 0,8,15 and 32) were first separated on 5-20 % SDS PAGE. The gel was rinsed in a transfer/blotting buffer ( 0.25M Tris, 1.92M Glycine 0.2% methanol made up to 1 litre with distilled water). The nitrocellulose membrane was cut to the dimensions of the gel and placed in the transfer buffer to soak for about 15-20 minutes. Also cut to the dimensions of the gel were 2 filter papers
8215 (Whatman 3mm), which were soaked in transfer buffer. The setup was assembled with the gel in-between the filter papers. The proteins were left to transfer at a rate of 3mA/cm2 for 2 hours. After transfer the nitrocellulose
membrane was immersed in a blocking buffer solution (3%BSA in PBs, 2% Polyethylene glycol 6000, 0.05% Non-diet NP40, 0.05 Tween 20) for 30 minutes. The membrane was then incubated with the primary antibody
raised in the rabbit for 1 hour after which it was washed in PBS Tween. The membrane was then incubated again with the secondary antibody (Anti rabbit IgG) for 45 minutes and later reblocked in 10% non fat dry milk in PBS for 10 minutes. Finally the membrane was washed in PBS Tween and the enzyme substrate (Horseradish peroxidise) in order to visualize the bands.
RESULTS
Heamolymph protein profiles: The protein concentration of both the infected and uninfected haemolymph was determined as a measure of the effect of S. mansoni on the snail’s metabolic mechanisms. The parasite relies on the snail’s haemolymph for nutrient uptake. Because there was a regulation of the haemolymph proteins during the development of the
parasite in the snail, it was important to determine this concentration during selected days. A decrease in the total protein concentration was noted during the four weeks of infection. The uninfected snail had a concentration of 300µg/ml, while at the concentration was 258µg/ml, 220µg/ml and 193µg/ml on the snails infected on days eight, fifteen and thirty two respectively (Fig. 1).
Concentration of haemolymph proteins
0 50 100 150 200 250 300 350
Day 0 Day 8 Day 15 Day 32
Days of infection C o n c e n tr a ti o n u g /m l Conc ug/ml
Figure 1: Concentration of proteins during 4 weeks of infection with S. mansoni Haemolymph protein analysis through SDS PAGE (Fig. 2)
showed that B. pfeifferi plasma consisted of a complex mixture of proteins, which fractionated into a series of discrete bands arranged in order of molecular weight. Analysis of the gels revealed that new bands appeared in plasma samples in infected snails, and some bands consistently disappeared because of infection. The uninfected snail (Day 0) was the control and a reference upon which any differences with the infected samples were noted. There were no major difference in the high molecular weight proteins in the range between 250-50kDa. With respect to changes in the soluble components of haemolymph resulting from infection, in snails infected for 8, 15 and 32 days, the 1st major protein
band of interest was found at 47kDa. On day 0, the band was present; it disappeared on day 8 and then reappeared slightly on day 15 and 32. However, its presence on days 15 and 32 was not very distinct. The most conspicuous change involved band found at 35 kDa. Slight disappearance of this band was noted on day 8 and then intensification of this band was observed on day 15, and persisted through day 32. The third band of interest appeared at 19kDa on day 15 and 32 only, while it was absent on day 0 and 8. However, this band was not very distinct in its appearance. The last band of interest was at16kDa. The band was present on all the days. However, its intensity decreased on day 8 but was enhanced on day 15 and day 32. Analysis by two
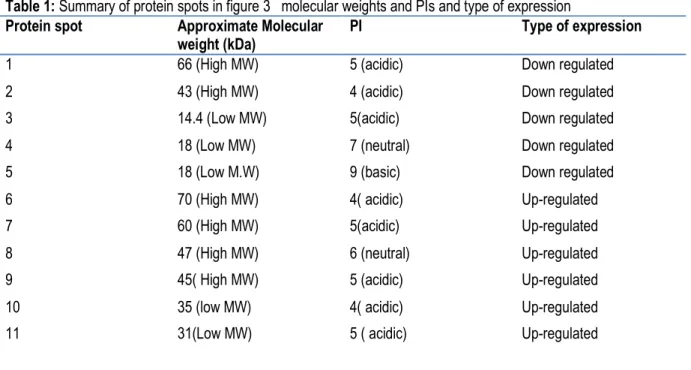
8216 dimensional gel electrophoresis revealed that there was a general progressive increase in the number of expressed proteins across from the naïve haemolyph until the maturity of the parasite at day 32 as seen by the highest number of spots in the gel. Due to the enormous number of proteins being suppressed and induced during the infection, there was hardly a distinct spot pattern being expressed though there was the gradual increase in the spots (Fig 3, 4). Overall, more protein spots were differentially expressed in the infected snail haemolymph than in the control. Only five protein spots were down regulated (spots 1-5) in the control gel against the 15 days’ gel which had 5 spots up-regulated (spots 6-11) as seen (Fig 3). A similar trend was observed when the
control gel was compared against the 32 days’ gel where five protein spots were down regulated and six spots up-regulated (Fig.4). Ultimately, most of the differentially expressed proteins were neutral and of low molecular weights among all treatments. The proportion of the neutral proteins increased with days of infection where the 32 day infected snail haemolymph had more than the control. The proportions were 60% (Fig 3), 70% (Fig 4.). The low molecular weight proteins were most expressed in the 32 day followed by 15 day infected haemolymph respectively. The distributions were 60% (Fig. 3), 63.3% (Fig. 4). There was no specific trend in distribution of the acidic or basic proteins within the populations.
SDS PAGE
Marker Day 0 Day 8 Day 15 Day 32
Figure 2: SDS-PAGE showing the protein profile for both the uninfected and infected snail haemolymph. Amount of sample loaded in each of the wells was 70 µg/ml.
250kD 100k 75kD 50kD 37kD 25kD 15kD 150kD 1 2 4 3
8217 2D electrophoresis Gels
Figure 3: Spots indicated by lines and numbers are differentially induced, such spots in the control gel are down regulated while those of the gel at 15 days are up-regulated.
Table 1: Summary of protein spots in figure 3 molecular weights and PIs and type of expression Protein spot Approximate Molecular
weight (kDa)
PI Type of expression
1 66 (High MW) 5 (acidic) Down regulated
2 43 (High MW) 4 (acidic) Down regulated
3 14.4 (Low MW) 5(acidic) Down regulated
4 18 (Low MW) 7 (neutral) Down regulated
5 18 (Low M.W) 9 (basic) Down regulated
6 70 (High MW) 4( acidic) Up-regulated
7 60 (High MW) 5(acidic) Up-regulated
8 47 (High MW) 6 (neutral) Up-regulated
9 45( High MW) 5 (acidic) Up-regulated
10 35 (low MW) 4( acidic) Up-regulated
11 31(Low MW) 5 ( acidic) Up-regulated
Marker Day 15 Marker Control
8218
Figure 4: Spots indicated by lines and numbers are differentially induced, such spots in the control gel are down regulated while those of the gel at 32 days are up-regulated.
Table 2: Summary of protein spots in figure 4 molecular weights and PIs and type of expression Protein spot Approximate Molecular
weight (kDa)
PI Type of Expression
1 66 (High MW) 5 (acidic) Down regulated
2 43 (High MW) 4 (acidic) Down regulated
3 14.4 (Low MW) 5(acidic) Down regulated
4 18 (Low MW) 7 (neutral) Down regulated
5 18 (Low M.W) 9 (basic) Down regulated
6 68 (High MW) 4( acidic) Up-regulated
7 45 (High MW) 5(acidic) Up-regulated
8 47 (High MW) 6 (neutral) Up-regulated
9 40 (Low MW) 5 (acidic) Up-regulated
10 28 (Low MW) 6 (neutral) Up-regulated
11 30 (Low MW) 5 ( acidic) Up-regulated
12 14 (Low MW) 5(acidic) Up-regulated
Immunological analysis: Antibody activity against the immunizing antigen was tested and precipitin lines indicated formation of an immune complex for verification of identity. The outside wells contained sera while the inner well contained the specific antigen to be tested. The
results showed complete identity of the antigens (SWAP and SCA) and the antibodies (Fig 5a and 5b).. Snail haemolymph used as an antigen was therefore tested against the worm and cercariae antibodies to test for cross reactivity by western blotting.
8219 Ouchterlony
Figure 5a: Cercariae Ag-Ab reaction. No. 1 represents the well loaded with the SCA while no. 2 represents the wells loaded with sera (same concentration) containing Abs.
Figure 5b. Worm Ag- Ab reaction. No. 3 represents the well loaded with the SWAP while no. 4 represents the wells loaded with sera (same concentration) containing Abs.
Results from Western blotting through probing of the transferred heamolymph proteins against the antibodies raised indicated that haemolymph proteins from infected snails and the control (uninfected) snails were not recognized by antibodies raised against S. mansoni antigens. None of the antibodies induced by immunization with Soluble Cercarial Antigen (SCA) and Soluble Worm Antigen (SWAP) had a specific binding to snail proteins
including the induced proteins. No band was seen in any of the blots even though the staining by Ponceau showed that proteins had been transferred from the gel to the nitrocellulose paper. This was an indication that the snail plasma proteins were not specific to the antibodies raised against SCA and SWAP and therefore no cross reactivity could be detected.
DISCUSSION
Snail-schistosome interactions specifically related to biochemical changes in the snail is an important aspect in understanding the biology of the parasite. Specifically expressed and developmentally regulated proteins in the snail haemolymph form an integral part in intramolluscan development. In this study, the total protein concentration decreased from 300µg/ml to 193µg/ml during the infection. Previous studies with Schistosoma mansoni and B. glabrata generally indicate that after 11 to 14 days of infection, the plasma protein content of infected snails is significantly reduced (Lee and Cheng, 1972). There
were no significant increases in total plasma proteins reported for S. mansoni-infected snails. According to Rupprecht et al. (1989) during a long term infection of B. glabarata with S. mansoni, there was a decrease in total protein concentration during the first four weeks of infection, with a significant increase at week five then a significant decrease at week six up to week twelve. The main explanation for this was that the parasites especially the daughter sporocysts reabsorb and metabolize glucose and amino acids as well as the haemolymph protein fragments for development during the first four
Precipitin line Precipitin line 1 4 2 2 2 2 4 4 4 3
8220 weeks. The parasites depend on the haemolymph as a sink for metabolites as well as nutrients. In addition, Lee and Cheng (1975) attributed this change partially to the hydrolysis of snail haemoglobin and uptake of the haeme by schistosome sporocysts and partially to the haemorrhage from the snail foot caused by emergence of cercariae. Findings of this study are in agreement with previous work as shown above. It is worth noting that the decrease in total protein concentration as noted above did not alter the induction and suppression of specific proteins. The protein spectrum of infected snails showed no difference in quality compared with that of non-infected snails. However, there was a difference in quantity of some specific bands showing that some proteins are induced or suppressed as a result of infection. A general observation was that all the main bands of interest in regards to suppression were noted on day 8. The enhancement was observed on days 15 and 32. After 8 days of infection, the mother sporocysts increase in size and are found in the head and foot region. There is a possibility that the parasite induces a transformation of the host’s metabolism to allow for a tremendous growth hence the explanation for suppression of the specific proteins. One new band (19kDa) appeared on day 15 when the daughter sporocysts are found in the digestive gland and day 32 when cercariae are just about to leave the snail, but was absent on days 0 and 8 indicating that they may be induced by the parasite development from the mother to daughter sporocysts. The three other bands of interest (47kDa, 35kDa and 16kDa) also become intensified on these days. The main significance for the disappearance and emergence of the bands was because of the induction and suppression of the specific proteins. From the two-dimensional gel electrophoresis, it was generally observed that there were no major differences in the majority of the high molecular weight protein between the days. There were few proteins expressed in the uninfected haemolymph (Day 0) while day 15 contained new spots suggesting an induction. This may be explained by the fact that by this time daughter sporocysts have developed in the digestive gland and biochemical changes may have resulted in the changes of the haemolymph proteins. Day 32 contained the majority of the proteins expressed. These proteins were
constitutively expressed progressively and they probably are thought to contain housekeeping genes that are important for the metabolic processes during the infection. The variability in the spot pattern across the days of infection reflects induction and suppression of specific proteins. This shows that there is a large pool protein in the haemolymph during the development of the parasite to cercarial stage before being released in to the water. In comparison, in a different study soluble protein from cercariae, lung-schistosomula, adult worms and eggs of Schistosoma mansoni were separated by high-resolution two-dimensional electrophoresis and the resulting images showed a high degree of quantitative and qualitative similarity in spot pattern across the life-cycle, greatest between adjacent stages. (Curwen et al., 2004). As shown by western blotting, lack of cross reactivity between the snail haemolymph and the antibodies raised against the worm and cercariae antigens was an indicator that none of the proteins had specific binding to the antibodies indicating no shared antigens between the snail haemolymph and schistosome stages. Proteins have been known to be good vaccine candidates and the search for and antigenic candidate in the snail plasma would have provided a better insight because of the snail - schistosome relationship. The SDS-PAGE showed that some proteins are regulated either by induction or suppression and therefore a cross reactivity between either of them and the antibodies would be a breakthrough in identifying new target antigens. As mentioned above (Curwen et al., 2004) the similarity in composition between the four preparations (soluble egg, cercariae, lung schistosomulum and adult worm proteins) means that they are unlikely to discriminate adequately between immune responses, and therefore it was expected that a similar cross reactivity would be seen with the cercariae and worm antigen preparations. As the search for vaccine candidates is ongoing, protection against schistosomiasis should not only reduce infection and protect from re-infection, but also accelerate immune responses in infected humans directed against granuloma-related pathology and/or worm fecundity (McManus and Loukas, 2008; Bergquist , 2008).
CONCLUSIONS AND RECOMMENDATION
From this study, a number of conclusions can be made. Firstly, the development of the schistosome in the intermediate snail host leads to the induction and suppression of some proteins as demonstrated by the
protein profile. However, more work needs to be done in order to identify and characterize the specific proteins and the role that they play during the development of the schistosome that leads to their induction or suppression.
8221 Secondly, the separation of haemolymph proteins by two dimensional gel analyses revealed high number of proteins being expressed on days 15 and 32. One limitation of this study was that it was difficult to achieve a good resolution with the 2D electrophoresis. However, the selection of few reproducible spots and the selection of spots showing qualitative and significant quantitative variations were done and more analysis should be carried out on the proteins. Differential analysis and characterization of the proteins as expressed in the gels
should be carried out. Lastly, there was no cross reactivity between the normal snail plasma and infected snail plasma with the cercariae and worm antigens. However it is recommend that the cross reactivity between the above antigens and stage specific snail tissues on day 8, 15 and 32 be carried out, given that the parasite is specific to tissues during these particular days. The search for a new vaccine candidate should focus more on the snail intermediate host and biochemical changes as a result of infection.
ACKNOWLEDGMENT
We would like to acknowledge the support and contribution received from the staff of Institute of Primate Research (IPR) and Centre for Biotechnology and
Bionformatics (CEBIB) at the University of Nairobi towards the completion of this work.
REFERENCES:
Afaf El-Ansary and Soad Al-Daihan, 2006. Important aspects of Biomphalaria snail-schistosome interactions as targets for antischistosome drug, Medical Science Monitor, 12, (12): 282-292 Bergquist NR, Jurg Utzinger, McManus DP, 2008. Trick
or Treat: The Role of Vaccines in Integrated schistosomiasis control, PLOs Neglected Tropical Diseases, 2 (6), e244.
Curwen S R, Peter DA, Johnston AD, Wilson RA, 2004. The Schistosoma mansoni soluble proteome: a comparison across four life-cycle stages, Molecular & Biochemical Parasitology, 138: 57– 66.
Dissous C and Capron, A, 1989. Schistosoma mansoni and its intermediate host Biomphalaria glabrata express a common 39 kilo dalton acidic protein, Molecular and Biochemical Parasitology, 32: 49-56.
El-Dafrawy SM, Mohamed AH, Hammam OA, Rabia I, 2007. Immunolocalization of Schistosoma mansoni and Schistosoma haematobium antigens reacting with their Egyptian snail vectors, Journal of the Egyptian Society for Parasitology, 37(3):1039-48.
Hotez PJ, A.M., Basanez MG, Bolliger I, Bourne R, et al. , 2014. The Global Burden of Disease Study 2010: Implications for the neglected tropical diseases. PLOS Neglected Tropical Diseases 8(7):e2865.
Jackson T.F.H.G, 1976. Intermediate host antigens associated with cercariae of S. haematobium, Journal of Helminthology, 50: 45-46
Leammli U.K, 1970. Cleavage of structural proteins during the assembly of the head of bacteriophage T4, Nature, 227: 680-685. Lee FO and Cheng TC, 1972a. Schistosoma mansoni
alterations in the total protein and hemoglobin in the haemolymph of infected Biomphalaria glabarata, Experimental Parasitology, 31, 203-216.
Lee FO and Cheng TC, 1975. Selective depletion of haemolymph proteins of Biomphalaria glabarata infected with Schistosoma mansoni, Journal of Parasitology, 61, (1)
Lockyer AE, Jones CS, Leslie RN, Rollinson D, 2004. Trematodes and snails: an intimate association, Canadian Journal of Zoology, 82(2): 251–269. Mc Manus DP and Loukas A, 2008. Current status of
vaccines for Schistosomiasis, Clinical Microbiological Reviews, 21 (1): 225-242. McWilliam HE, Driguez P, Piedrafita D, McManus DP,
Meeusen EN, 2012. Novel immunomic technologies for schistosome vaccine development, Parasite Immunology;34(5):276-84. doi: 10.1111/j.1365-3024.2011.01330.x. O’ Farrel PH, 1975. High resolution of Two Dimensional
electrophoresis of proteins, Journal of Biological Chemistry, 250: 4007- 4021
Ouchterlony T O, 1968. Handbook of immunodiffusion and immunoelectrophoresis, Ann Arbor, MI: Ann Arbor Science Publishers
Rupprecht H,Becker W, Schwanbek A, 1989. Alterations in the haemolymph components in Biomphalaria glabarata during long term infection with
8222 Schistosoma mansoni, Parasitology Research, 75: 233-237.
World Health Organization, 2002. Strategic Direction for Research. TDR Strategic Direction: Schistosomiasis, World Health Organization, Geneva.
World Health Organization, 2013. Fact sheet no 115. Wray W, Boulikas T, Wray VP, Hancook R., 1981. Silver
staining of proteins on polyacrylamide gels, Analytical Biochemistry, 118: 197-203. Yole DS, Reid GDF, Wilson RA, 1996. Protection against
Schistosoma mansoni and associated immune
responses induced in the Vervet monkey Cercopithecus aethiopis by the irradiated cerceriae vaccine. American Journal of Tropical Medicine Hygiene, 54 (3): 265-270.
Yole DS, Pemberton R, Reid GD, Wilson RA, 1996. Protective immunity to Schistosoma mansoni induced in the olive baboon, Papio anubis, by the irradiated vaccine. Parasitology 11: 37-46. Yoshino TP and Cheng TC, (1978). Snail Host Antigen
associated with surface membrane of S.mansoni miracidia, Journal of Parasitology, 64: 752-754.