UNIVERSITÉ DE MONTRÉAL
AUTOMATIC BEHAVIOR ANALYSIS AND UNDERSTANDING OF
COLLISION PROCESSES USING VIDEO SENSORS
MOHAMED GOMAA M. MOHAMED
DÉPARTEMENT DES GÉNIES CIVIL, GÉOLOGIQUE ET DES MINES ÉCOLE POLYTECHNIQUE DE MONTRÉAL
THÈSE PRÉSENTÉE EN VUE DE L’OBTENTION DU DIPLÔME DE PHILOSOPHIÆ DOCTOR
(GÉNIE CIVIL) JUILLET 2015
UNIVERSITÉ DE MONTRÉAL
ÉCOLE POLYTECHNIQUE DE MONTRÉAL
Cette thèse intitulée :
AUTOMATIC BEHAVIOR ANALYSIS AND UNDERSTANDING OF
COLLISION PROCESSES USING VIDEO SENSORS
présentée par : MOHAMED Mohamed Gomaa M.
en vue de l’obtention du diplôme de : Philosophiae Doctor a été dûment acceptée par le jury d’examen constitué de :
M. TRÉPANIER Martin, Ph. D., président
M. SAUNIER Nicolas, Ph. D., membre et directeur de recherche M. MORRIS Brendan, Ph. D., membre
DEDICATION
ACKNOWLEDGMENTS
First and foremost, I would like to thank Allah for His endless blessings and for keeping my body and mind strong to fulfill this research. Thanks Allah for paving the way for coming to Montreal and continuing my study in Polytechnique Montreal without any intended plans.
I would like to express my sincere appreciation to my supervisor, Dr. Nicolas Saunier, for his invaluable contributions, constructive feedbacks and guidance through my research journey. This research would not have been possible without his guidance and support. Thank you for answering my questions quickly at any time and your careful revision of this thesis. Indeed, no words can fulfill the feeling of gratitude I carry: I was fortunate to work under your supervision.
I would like to acknowledge the financial support of the Natural Sciences and Research Council of Canada (NSERC). I would also like to thank Zu Kim of California PATH and Ann Stansel of the Kentucky Transportation Cabinet for providing the Kentucky video dataset, the City of Montreal for providing collision diagrams of the studied intersections in Montreal and financial support. I would like to thank Steve Warren (SNC-Lavalin O&M inc.) for helping us to collect the video data of the Guy Intersection.
I would like to thank my lab-mates for supporting me, in particular Kinan Bahbouh and to all my friends that supported and accompanied me all these years, in particular Ibrahim Bakry, Ibrahim Mashhour, and Adham Tamam.
I also thank my beloved parents for everything they have done in my life and for their moral support throughout my research. I am also grateful to my brother Osama for happily carrying loads of responsibilities that I burdened him with while away for study. I must acknowledge my younger sisters, Basma, Eman, and Nada for encouraging me with their best wishes.
At last, and most importantly, I am extremely thankful to my wife, Mona Abouhamad for living and interacting with me during the research journey with its ups and downs. She always supports me with her love and encouragement till completing the thesis. I want to express my deep love to my kids, Sara and Yusuf, for sharing our dream.
RÉSUMÉ
La sécurité routière est un des problèmes de société les plus importants à cause des multiples impacts et coûts des accidents de la route. Traditionnellement, le diagnostic de sécurité repose principalement sur les données historiques de collision. Cette approche réactive mène à remédier au problème de sécurité après que ses impacts sur la société soit déjà réalisés. Les analystes de la sécurité et les décideurs doivent attendre jusqu'à ce qu'un nombre suffisant de collisions (ce qui demande d’attendre habituellement au moins trois ans) soit collecté pour analyser ou mettre en place des mesures d’amélioration de la sécurité routière. Les méthodes substituts (« surrogate ») d'analyse de la sécurité constituent une approche alternative proactive qui s'appuie sur l'observation d’événements « dangereux » sans collision, souvent appelé accidents « évités de justesse » (« near misses ») ou « conflits ». Parmi ces approches, les techniques de conflits de trafic (TCT) reposent sur la collecte des données de conflit par des observateurs sur le terrain qui interprètent leur sévérité. Par conséquent, les TCT souffrent des variations de jugement des observateurs, de la difficulté de mesurer les indicateurs de sécurité en temps réel par les observateurs, et du coût de la collecte des données.
Cette thèse vise à proposer un cadre générique et efficace pour utiliser et gérer de grandes quantités de riches données spatio-temporelles obtenues par analyse vidéo automatique afin d'effectuer l’interprétation automatique de la scène, la compréhension du comportement des conducteurs, la détection des comportements anormaux et l'analyse substitut de la sécurité. À cette fin, ce cadre a deux composantes principales : 1) un cadre d’apprentissage multi-niveau des mouvements et 2) un cadre d’analyse substitut de la sécurité.
Pour commencer, un outil d'analyse vidéo venant du projet au code source ouvert « Traffic Intelligence » est utilisé. Un algorithme de lissage est développé pour les trajectoires extraites et sa performance est évaluée quantitativement. Les performances de l'algorithme sont évaluées dans trois études de cas. La mesure de performance est améliorée de 86-95 % pour tous les usagers de la route, de 97 % pour les véhicules, et seulement de 80-86 % pour les piétons.
Le cadre d’apprentissage multi-niveau des mouvements est utilisé pour l'interprétation de scène automatisée et la détection de comportements anormaux. Tout d'abord, les zones d'intérêt (zones d'entrée/sortie, zones d’occlusion, et zones de bruit résultant d’erreur de l’analyse vidéo) sont détectées par le biais d'un modèle de mélange de gaussiennes et l'algorithme de
espérance-maximisation. De plus, nous présentons quatre applications différentes des zones détectées : filtrage des trajectoires, connexion des trajectoires divisées, nettoyage de l'apprentissage des mouvements et de la prédiction des mouvements. Ces opérations reposent sur trois algorithmes non-supervisés; 1) un algorithme de filtrage, 2) un algorithme de connexion, et 3) un algorithme de nettoyage. Deuxièmement, les patrons de mouvement (PM), représentés par des trajectoires prototypes, sont appris à partir des trajectoires des usagers en deux phases, une première fondée sur la les informations spatiales puis une seconde sur les informations temporelles (de vitesse). Enfin, les trajectoires qui ne sont pas assignées à un PM après l'apprentissage sont considérées comme des anomalies. Une large étude expérimentale de trois cas variés démontre les capacités du cadre de plusieurs façons : elle réduit le coût de calcul d’environ 90 % pour l’apprentissage des mouvements, connecte les trajectoires incomplètes avec une précision jusqu'à 97 %, élimine les trajectoires aberrantes et permettent de prédire les mouvements futurs de façon réaliste pour calculer des indicateurs de sécurité.
Pour l’analyse substitut de la sécurité, trois questions différentes sont étudiés concernant : 1) l'influence de la méthode de prédiction du mouvement sur les indicateurs de sécurité, 2) l'influence de la représentation géométrique des usagers sur l'exactitude des indicateurs de sécurité, et 3) la façon d’interpréter les indicateurs de sécurité. Pour répondre à ces questions, l’approche est appliquée au diagnostic de la sécurité des interactions entre les véhicules tournant à gauche et les véhicules en direction opposée à un carrefour à feux.
Premièrement, la prédiction du mouvement est nécessaire pour déterminer si deux usagers de la route sont sur une trajectoire de collision et pour calculer des indicateurs de sécurité continus tels que le temps à la collision (TTC). La méthode par défaut, utilisée sans justification dans une grande partie de la littérature, est la prédiction à vecteur-vitesse constante. Toutefois, le cadre générique proposée prédit les positions futures des usagers de la route selon des différentes hypothèses d'extrapolation : des méthodes cinématiques (MC) telles que la prédiction à vecteur-vitesse constant et l’adaptation aléatoire basée sur un échantillonnage de distributions d'accélération et de direction, et les méthodes par appariement aux patrons de mouvement (APM). L’APM consiste à apparier les portions des trajectoires des usagers jusqu’à un instant donné avec les prototypes appris à l’étape de l’interprétation de scène. Les résultats montrent que l’APM est en mesure de calculer les indicateurs de sécurité dès le début de l’interaction et fournit un plus grand nombre de mesures dans le temps. Cela confirme que les MC ne sont pas réalistes pour calculer les indicateurs de la
sécurité pour les mouvements de virage et pour comprendre les processus de collision. L'intégration de l'interprétation de scène avec l'analyse de sécurité semble capable d'effectuer le diagnostic de sécurité d'une intersection dans un système automatisé et de manière non supervisée.
Deuxièmement, différentes représentations géométriques des usagers de la route sont proposées pour la mesure automatisée des indicateurs de sécurité. En particulier, ils sont utilisés pour automatiser les mesures du temps post-empiètement (PET). Les résultats montrent que la représentation d’un usager de la route comme une enveloppe convexe basée sur les points caractéristiques est la plus précise avec une erreur quadratique moyenne égale à 0,25 s.
Enfin, deux approches d'interprétation des indicateurs de sécurité sont étudiées pour l'analyse de la sécurité : 1) les distributions des indicateurs agrégés de sécurité et 2) la classification des profils temporels des indicateurs. La première approche repose sur la comparaison des distributions des indicateurs agrégés de sécurité. La seconde approche a pour objectif d'analyser l'ensemble des séries temporelles des indicateurs pour trouver des similarités entre les interactions, alors que la plupart des méthodes d’interprétation actuelles des indicateurs continues de sécurité (comme la première approche) reposent sur une seule valeur d'indicateur à un moment donné pour qualifier de l'ensemble de l'interaction, comme le TTC minimum. Une nouvelle mesure de similarité pour les séries temporelles, la plus longue sous-séquence commune alignée, est appliquée à des mesures substituts de sécurité et d'autres indicateurs caractérisant les interactions des usagers. La nouvelle mesure de similarité est couplée avec un algorithme personnalisé de regroupement qui ne nécessite pas de connaître le nombre de groupes attendu et reste interprétable grâce à l'utilisation de profiles d’indicateurs prototypes comme représentants de chaque groupe. Un résultat important est que la classification des indicateurs peut éliminer l'influence du bruit des mesures, qui pourrait mener à surestimer le danger d’une interaction. L'approche de classification des indicateurs aide à mieux comprendre les processus de collision dans leur ensemble.
ABSTRACT
Traffic safety is one of the most important social issues due to the multiple costs of collisions. Traditionally, safety diagnosis depends mainly on historical collision data. This reactive approach leads to remedy the existing safety problem after the materialization of the induced social cost. Safety analysts and decision makers must wait till a sufficient number of collisions (typically at least 3 years of collision data) is collected to analyze and to devise countermeasures. Surrogate safety analysis is an alternative and proactive approach that relies on the observation of traffic events without a collision, in particular “unsafe” events often called “near misses” or “conflicts”. Among these approaches, traffic conflict techniques (TCT) rely mainly on field observers to identify conflicts and interpret their severity. Consequently, TCTs suffer from the variations of observer judgement, the cost of collecting conflict data, and the difficulty of measuring safety indicators in real time by the observers.
This dissertation aims to propose an effective and generic framework to utilize and manage the rich amount of spatial-temporal data obtained through automated video analysis for automated scene interpretation, driver behaviour understanding, anomalous behaviour detection, and surrogate safety analysis. To this end, this framework is composed of two main components: 1) a multi-level motion pattern learning sub-framework and 2) a surrogate safety analysis sub-framework.
At the beginning, a video analysis tool from the open source project “Traffic Intelligence” is used. A smoothing algorithm is developed for the extracted trajectories and its performance is evaluated quantitatively. The performance of the algorithm is evaluated for three case studies. The performance measure is improved by 86-95 % for all road users, up to 97 % for vehicles, and only up to 80-86 % for pedestrians.
The proposed multi-level motion pattern learning framework is used for automated scene interpretation and anomalous behaviour detection. Firstly, the interest zones (Entry/Exit zones, occluded zones, and noise zones due to tracking failure) are detected through a Gaussian Mixture Model and the Expectation Maximization algorithm. Meanwhile, we introduce four different applications of the detected zones: filtering trajectories, connecting divided trajectories, cleaning the dataset, and speeding up motion pattern learning and prediction methods. This is performed with three unsupervised algorithms; 1) a filtering algorithm, 2) a connection algorithm, and 3) a cleaning algorithm. Secondly, motion patterns, represented by trajectory prototypes, are learnt from
road users’ trajectories using two-stage trajectory learning based on spatial then temporal (speed) information. Finally, the trajectories that are not assigned to any MP after the learning are considered as anomalies. A comprehensive experimental analysis of three varied scenes demonstrates the framework ability in several ways: it reduces the computation cost up to 90 % for motion pattern learning, connects incomplete trajectories with performance accuracy up to 97 %, removes outliers from trajectory dataset, and predicts future motion realistically to compute safety indicators.
For surrogate safety analysis, three different questions are investigated: 1) what is the influence of motion prediction on the measurement of safety indicators, 2) what is the influence of the road users’ geometric representation on the accuracy of estimated safety indicators, 3) how can the safety indicators be interpreted. To answer these questions, the framework is applied to the safety diagnosis of left turn and opposite direction interactions at a signalized intersection.
First, motion prediction is required to identify whether two road users are on a collision course and to compute several continuous safety indicators such as Time to Collision (TTC). The default, unjustified method used in much of the literature is prediction at constant velocity. However, the proposed generic framework predicts road users’ future positions depending on different extrapolation hypotheses: kinematic methods (KM) such as constant velocity and random adaptation based on sampling distributions of acceleration and direction, and motion pattern matching (MPM). MPM consists in matching partial road user trajectories up to the current instant to the learnt prototypes obtained from the scene interpretation step. The results show that MPM is able to compute the safety indicators early with a larger number of measurements. This finding supports that KM are not realistic enough to compute safety indicators for turning movements and to understand collision processes. The integration of the scene interpretation with the safety analysis is able to perform the safety diagnosis of an intersection in an automated and unsupervised fashion.
Second, different geometric representations of road users are proposed for automated measurement of safety indicators. In particular, they are compared in the case of the measurements of post encroachment time (PET). The results show that representing the road user as a convex hull using extracted features is the most accurate with a root mean square error equal to 0.25 s for PET computation.
Finally, two interpretation approaches of safety indicators are investigated for safety analysis: 1) aggregated safety indicator distributions and 2) indicator profile classification. The first approach relies on the comparison of the distributions of aggregated safety indicators. The second approach aims to compare the whole time series or profiles of the indicators to find similarities between interactions, while most current interpretations (such as the first approach) of continuous safety indicators rely on only one indicator value at a given time to qualify the whole interaction, e.g. the minimum TTC. A new similarity measure for time series, the aligned longest common sub-sequence, is applied to surrogate measures of safety and other indicators characterizing road user interactions. The new similarity measure is paired with a custom clustering algorithm that does not require to set the number of expected clusters and remains interpretable through the use of prototype indicator profiles as cluster representatives. An important finding is that classifying indicators can eliminate the influence of noisy measurements, which could lead to over-estimate the risk for such interactions. The classification approach helps to better understand collision processes.
TABLE OF CONTENTS
DEDICATION ... III ACKNOWLEDGMENTS ... IV RÉSUMÉ ... V ABSTRACT ... VIII TABLE OF CONTENTS ... XI LIST OF TABLES ... XV LIST OF FIGURES ... XVI LIST OF INITIALS AND ABBREVIATIONS ... XIX GLOSSARY OF TERMS ... XXI LIST OF APPENDICES ... XXIIICHAPTER 1 INTRODUCTION ... 1 1.1 Context ... 1 1.2 Challenges ... 5 1.3 Objectives ... 6 1.4 Methodology Overview ... 7 1.5 Contributions ... 9 1.6 Thesis Outlines ... 10
CHAPTER 2 LITERATURE REVIEW ... 12
2.1 Video Tracking Technology ... 12
2.2 Scene Interpretation ... 17
Point of Interest (POIs) Learning ... 18
Behaviour Analysis based On Trajectory Learning ... 19
Behaviour Analysis based On Topic Modelling ... 23
Speed Profiles Analysis ... 25
2.3 Motion Prediction and Collision Avoidance ... 26
Collision-based Safety Analysis ... 29
Methods for Surrogate Safety Analyses ... 31
2.5 Summary ... 38
CHAPTER 3 RESEARCH METHODOLOGY (PHASE ONE) ... 40
3.1 Overview ... 40
3.2 Computer Vision based for Obtaining Road User Trajectories ... 40
Camera Calibration ... 41
Feature Tracking ... 43
Feature Grouping ... 45
New Method for Smoothing Road User Trajectories ... 46
3.3 Scene Interpretation ... 50
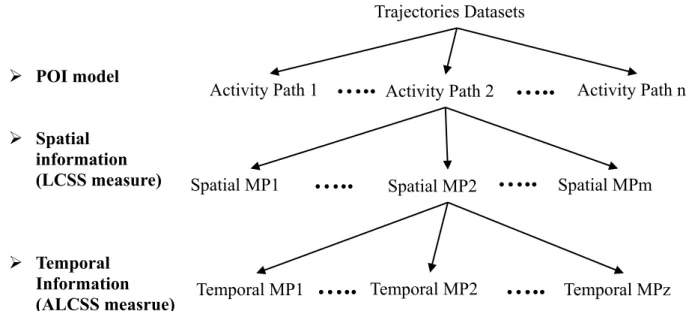
POI Model Learning ... 52
Two-Stage MP Learning ... 56
3.4 Summary ... 59
CHAPTER 4 EXPERIMENTAL RESULTS (PHASE ONE) ... 60
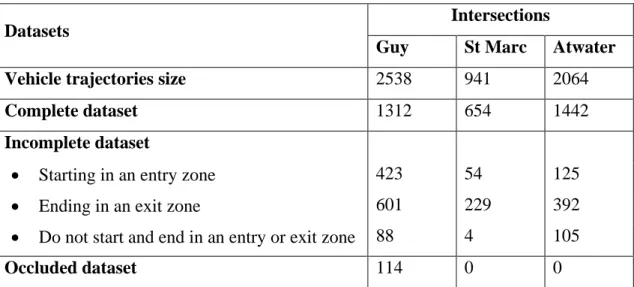
4.1 Data Description ... 60
4.2 Smoothing Algorithm Results ... 61
4.3 POI Model ... 63
POI Detection Experiments ... 63
POI Applications Experiments ... 66
4.4 Two-Stages MP Learning Experimental Results ... 75
Speeding up the computational cost ... 75
MP Learning Results ... 76
Anomaly Detection ... 80
4.5 Summary ... 86
CHAPTER 5 RESEARCH METHODOLOGY (PHASE TWO) ... 87
5.1 Overview ... 87
5.2 Motion Prediction Methods ... 88
Kinematic Methods ... 88
Comparison between Different Motion Prediction Methods ... 96
5.3 Automated Safety Indicators Calculations ... 98
Simple indicators ... 98
Surrogate Safety indicators ... 99
5.4 Continuous Indicator Interpretation ... 105
Indicator aggregation ... 105
Indicator Clustering ... 106
5.5 Summary ... 107
CHAPTER 6 EXPERIMENTAL RESULTS (PHASE TWO) ... 108
6.1 Overview ... 108
6.2 Description of the Case Studies ... 108
Guy Intersection ... 108
Atwater Intersection ... 110
Kentucky Dataset ... 110
6.3 Influence of Geometric Representation on Surrogate Safety Measure ... 111
Guy Intersection ... 112
Atwater Intersection ... 117
6.4 Influence of Motion Prediction Methods on Surrogate Safety Measures ... 117
Number of Measurements and Detected Encounters ... 118
Safety Indicator Calculation ... 122
6.5 Analysis of Safety Indicator Distributions ... 127
Aggregation by Site ... 127
Aggregation by Interaction Type ... 128
6.6 Clustering of Safety Indicators Profiles ... 131
Kentucky Dataset ... 131
Guy Intersection ... 132
6.7 Summary ... 135
CHAPTER 7 CONCLUSION AND RECOMMENDATIONS ... 136
7.1 Conclusion ... 136
7.3 Perspectives and Future Works ... 139 REFERENCES ... 141 APPENDICES………..………151
LIST OF TABLES
Table 1.1: Current challenges of different topics for improving safety analysis approach ... 5
Table 3.1: Range of used tracking parameters ... 44
Table 4.1: Calculated CSJ for each dataset ... 63
Table 4.2 : Filtering algorithm results ... 67
Table 4.3: Size of datasets and number of learnt prototypes ... 76
Table 5.1: An example of a probability estimation ... 92
Table 5.2: Comparison between different motion prediction methods in term of required information and running time for two road users in a given interaction at a given instant. ... 97
Table 6.1: Interactions descriptive and corresponding collision in Guy Intersection ... 109
Table 6.2: Comparison between PET measurement methods for the example dataset ... 112
Table 6.3: Correlations between the four methods and the manual measurements ... 114
Table 6.4: Number of encounters for each motion prediction method based on computed TTC and pPET (time horizon is 150 frames (equivalent to 5 s)) ... 119
Table 6.5: The correlation analysis between the frequency and the rank of encounters and collisions for different thresholds and using TTCmin ... 130
Table 6.6: Parameters used in the computation of SALCSS and clustering algorithm (fps is frames per second) ... 131
LIST OF FIGURES
Figure 1.1: Traffic safety analysis main approaches ... 1
Figure 1.2: Research Overview ... 8
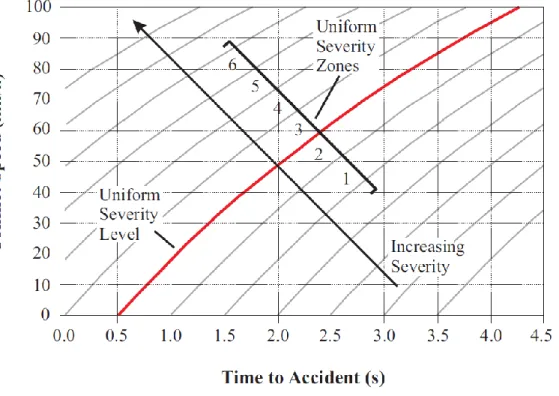
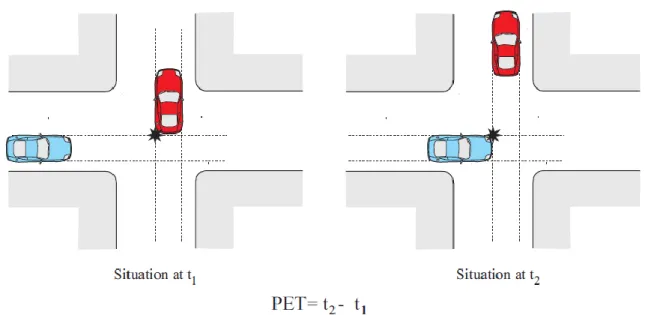
Figure 2.1: TA/Conflicting speed diagram to measure interaction severity level (Archer, 2005) . 32 Figure 2.2: The Concept of post-encroachment time (PET) (Cunto, 2008) ... 33
Figure 2.3: Concepts of Time-Exposed TTC and Time-Integrate TTC (Minderhoud & Bovy, 2001) ... 34
Figure 2.4: Safety Hierarchies Examples: pyramid model (on left) and diamond model (on right) (Laureshyn A. , 2010) ... 35
Figure 3.1: Phase One Methodology Overview ... 40
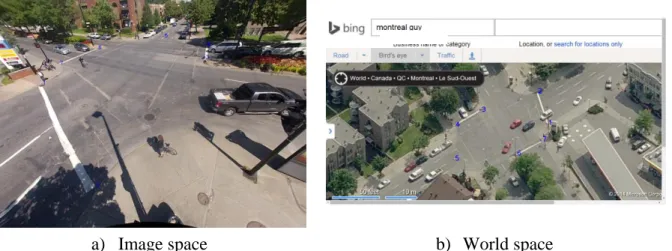
Figure 3.2: An example of distinct landmarks in image space and corresponding points in world space ... 42
Figure 3.3: An example of image with a fish-eyes effect and the resultant calibrated image ... 43
Figure 3.4: Sample of features tracked on road users ... 44
Figure 3.5: Sample of grouped features into one object hypothesis (box is the bounding box of each road user, the letter C denotes cars and the letter P denotes pedestrian) ... 46
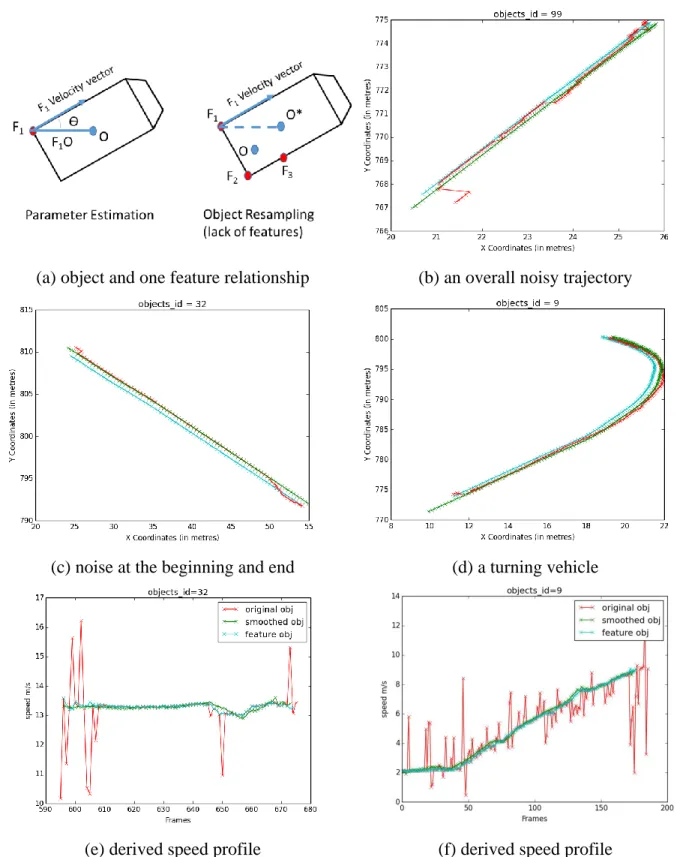
Figure 3.6: Illustration of the smoothing algorithm: a) relationship between a road user (vehicle) and one of its features, (b-d) examples of smoothed road user trajectories (in green), with the corresponding original trajectories (in red) and the selected feature trajectory (in blue), (e,f) examples of derived speed profiles. ... 49
Figure 3.7: Multi-level motion pattern learning sub-framework ... 51
Figure 3.8: Two stage motion pattern hierarchical leaning ... 52
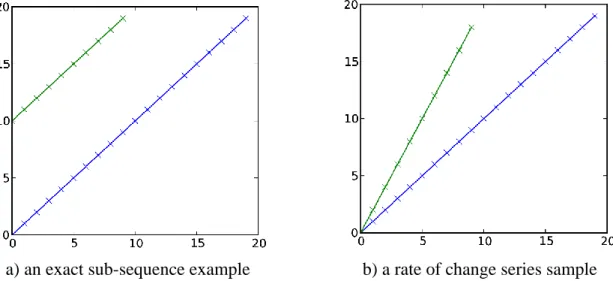
Figure 3.9: Examples of simple series that illustrate the advantages of using a finite δ and aligned longest common sub-sequence (from (Saunier & Mohamed, 2014)). ... 57
Figure 4.1: Camera views for each studied intersection ... 61
Figure 4.2: Smoothed and original 100 trajectories ... 62
Figure 4.3: Detected POI zones for Guy intersection ... 64
Figure 4.4: Detected POI zones for St Marc intersection ... 65
Figure 4.5: Detected POI zones for Atwater intersection ... 66
Figure 4.6: POI applications: filtering algorithm results for the Guy intersection ... 68
Figure 4.8: POI applications: filtering algorithm results of the Atwater intersection ... 69
Figure 4.9: Examples of connected incomplete trajectories ... 70
Figure 4.10: POI applications: cleaning trajectories using boxplots based on distribution of travelled distances in each AP (Guy intersection) ... 72
Figure 4.11: POI applications: cleaning trajectories using boxplots based on distribution of travelled distances in each AP (St Marc intersection) ... 73
Figure 4.12: POI applications: cleaning trajectories using boxplots based on distribution of travelled distances in each AP (Atwater intersection) ... 74
Figure 4.13: Prototypes representing MPs for the Guy intersection (color-coded as a sequential black-red-yellow-white to represent the number of trajectories associated to the MP) ... 77
Figure 4.14: Prototypes representing MPs for the St Marc intersection (color-coded as a sequential black-red-yellow-white to represent the number of trajectories associated to the MP) ... 78
Figure 4.15: Prototypes representing MPs for the Atwater intersection (color-coded as a sequential black-red-yellow-white to represent the number of trajectories associated to the MP) ... 79
Figure 4.16: Samples of detected spatial anomalies at the Guy intersection ... 82
Figure 4.17: Samples of detected excessive speed profile anomalies at the Guy intersection ... 84
Figure 4.18: Samples of detected spatial anomalies at the St Marc intersection ... 85
Figure 4.19: Samples of detected spatial anomalies at the Atwater intersection ... 86
Figure 5.1: Methodology overview ... 88
Figure 5.2: Examples of predicted trajectories using kinematic methods (the blue and red crosses or lines in each image). ... 91
Figure 5.3: A flow chart of MPM prediction procedure ... 94
Figure 5.4: Examples of predicted trajectories using different motion prediction hypotheses based on MPM (the blue and red crosses or lines). ... 95
Figure 5.5: Examples of predicted speed profiles for the through and left turn movements for the same stated interaction and their associated probability in the legend of each figure ... 96
Figure 5.6: An example of the pPET evolution during an interaction interval (red crosses refer to past trajectories, blue ones refer to predicted trajectories, and the cyan point is the predicted CZ) ... 100 Figure 5.7: Sample of a geometric representation (a) detected features (red crosses) and computed centroid (cyan circle), (b) the centroid based methods: CBM (cyan point) and CirBM (blue circle)
representations, and (c) the FBCH (blue polygon) and the FMAB (the red rotated rectangle) representations. ... 103 Figure 6.1: Sketch of locations of entry and exit zones learnt based on POIs (red ellipses represent entry zones while green ellipses represent exit zones) ... 110 Figure 6.2: Comparison between different geometric representation methods on PET. ... 113 Figure 6.3: Examples of PET measurements (in the table under each image representing the interaction from the FBCH, FMAB, CirMB, CBM, and Manual methods) ... 116 Figure 6.4: Distribution of the number of measurements per interaction based on the calculated TTC using different motion prediction method. ... 119 Figure 6.5: Maps of collision point’s density for LTOD interactions using different motion prediction methods. Left maps represent all computed collision points while right maps show collision points corresponding to TTC value below 1.5 s. ... 121 Figure 6.6: Maps of computed crossing zones density for LTOD interactions using different motion prediction methods. Left maps represent all computed crossing zones while right maps show crossing zones corresponding to pPET below 1.5 s. ... 122 Figure 6.7: Example of LTOD interaction (interaction 529). ... 125 Figure 6.8: Example of LTOD interaction (interaction 689) ... 126 Figure 6.9: Distributions of TTCmin and pPETmin observations using different motion prediction methods ... 128 Figure 6.10: Comparison of the frequency of encounters (with different TTCmin thresholds) and collisions for different motion prediction methods and types of interaction ... 129 Figure 6.11: Clustering of the TTC profiles in the Kentucky dataset (Saunier & Mohamed, 2014) ... 132 Figure 6.12: The distribution of each cluster of TTC per interaction type. ... 133 Figure 6.13: Clusters of the TTC profiles from the Guy Intersection (whole dataset, 5 clusters, and outliers) ... 134
LIST OF INITIALS AND ABBREVIATIONS
ALCSS Aligned Longest Common Sub-Sequence
AP Activity Path
AR Attainable Region
BB Bounding Box
BIC Bayesian Information Criteria CBM Centroid Based Method CirBM Circle Based Method
CV Constant Velocity
CP Collision Point
CSJ Cumulative Squared Jerk
CZ Crossing Zone
DP Dirichlet Processes
DTMD Directional Trimmed Mean Distance DTW Dynamic Time Warping
EM Expectation Maximization EVT Extreme Value Theory
FBCH Features-Based using Convex Hull method FHWA Federal Highway Administration
FMAB Feature-based using Minimum Area Bounding box method FOV Field of View
FCM Fuzzy C Mean
GMM Gaussian Mixture Model
GP Gaussian Processes
GPD Generalized Pareto Distribution KLT Kanada- Lucas- Tomasi
HCA Hierarchical Clustering Analysis HDP Hierarchical Dirichlet Process HMM Hidden Markov Model
ICSTCT International Calibration Study of Traffic Conflict Techniques LCSS Longest Common Sub-Sequence
LDA Latent Dirichlet Allocation
LT Left Turn
LTOD Left Turn and Opposite Direction
MP Motion Pattern
MPCS Motion Pattern Constant Speed MPM Motion Pattern Matching MPSP Motion Pattern Speed Profile
NA Normal Adaptation
OD Opposite Direction
PCA Principle Component Analysis pdf probability density function PDO Property Damage Only PET Post Encroachment Time
pLSA probabilistic Latent Semantic Analysis pPET predicted Post Encroachment Time POI Points of Interest
PS Set of Initial Positions
SAAQ Société de l’Assurance Automobile du Québec (Quebec’s auto insurance company) SSAM Surrogate Safety Assessment Model
TA Time to Accident
TCT Traffic Conflict Technique TET Time Exposed TTC
TI Traffic Intelligence TIT Time Integrated TTC TTC Time To Collision
GLOSSARY OF TERMS
Collisions A collision is defined as an interaction where two or more vehicles enter in
contact or one vehicle goes into an obstacle or off the road. It leads to different scales of severity. Collisions are the basis for traditional road safety analysis.
Collision course For a given motion prediction method, a collision course is defined as a
situation in which two road users would collide if they follow the predicted trajectories.
Collision severity It refers to the level of injury or property damage of single or multiple road
user collisions.
Encounter An encounter is an interaction meeting some criteria intended to select a
subset of interactions that are “closer” to collisions, for which safety indicators such as TTC may be computed, or are below some threshold.
Interaction An interaction is defined as a traffic event in which two road users exist
simultaneously and are close enough.
Motion Pattern The motion patterns are representations of the frequent road user
movements in the studied site. Post
Encroachment Time (PET)
PET is measured directly using the actual trajectories: it is defined as the time difference between the instant when the first road user leaves the crossing zone and the instant when the second road user enters it.
Points of interest (POIs)
The POIs indicate regions where road users enter, exit, and stop. They are learnt from the origins and destinations of observed trajectories. In this thesis, POIs correspond mainly to the entry/exit zones.
Road user spatial information
Road user temporal information
The information derived from a trajectory by differentiation such as speed and acceleration. In this thesis, temporal information is limited to speed.
Safety Indicator A safety indicator is an operational parameter that is used to measure the
proximity to a potential collision, or probability of collision, or the severity of the potential collision. It is synonymous with severity indicator.
Time to collision (TTC)
It is defined for a given motion prediction method as the time required for two vehicles to collide following the predicted trajectories.
Trajectory It is defined as a sequence of positions, typically one position for each frame
LIST OF APPENDICES
Appendix A – POI Detection Algorithms ... 151 Appendix B – Published Papers ... 153
CHAPTER 1
INTRODUCTION
1.1 Context
Traffic safety is one of the most important social issues due to the multiple costs of collisions. The total social cost of road collision in Canada in 2004 was estimated at $62.7 billion annually (about 4.9 % of Canada’s 2004 Gross Domestic Product) (Vodden, Smith, Eaton, & Mayhew, 2007). In Quebec, the Quebec’s auto insurance company (SAAQ – Société de l’Assurance Automobile du Québec) reported in the recent road collision report that 336 people were killed and 1573 were sever injured in road collisions in 2014 (SAAQ, 2015). Globally, the World Health Organization (WHO) ranked road accidents in the ninth place of leading causes of death and disability in 2009 and predicted it will rise to the fifth place by 2030 (WHO, 2009). The 2013 WHO report confirms the trend is going worse and road accidents are ranked in the eighth leading cause of death which signifies an urgent action must be taken (WHO, 2013). Traffic safety diagnosis relies on two main approaches (see Figure 1.1): collision –based analysis and surrogate safety analysis. Each of these approaches has its own advantages and disadvantages.
Figure 1.1: Traffic safety analysis main approaches
Safety manuals such as the manual of the World Road Association (RSM, 2003) depend mainly on historical collision data obtained from police and hospital reports and on different types of statistical analysis to identify and understand the failures of road systems, and to propose corrective
Traffic Safety Analysis
Collision-based Analysis (reactive approach)
Surrogate Safety Analysis (proactive approach)
Video Camera Field Observers Simulation Models
actions. This type of data has several shortcomings: the underreporting of some types of accidents, the lack of information in the reports, and the relatively small number of events. Besides, the record is done after the accident happened. The safety analysts and decision makers must wait till a sufficient number of accidents is collected to analyze the collisions and to devise countermeasures. The typical period of collision data is at least three years for safety analysis (Nicholson, 1985). Therefore, collision-based safety analysis is a reactive approach and the existing safety problem may only be remedied after the materialization of the induced social cost. These limitations have lead researchers to search for new methods to perform road safety diagnosis with higher confidence and in a proactive manner. This recommendation is contrasted with our first attempt to understand collision factors based on traditional collision data (Mohamed M. G., Saunier, Miranda-Moreno, & Ukkusuri, 2013).
One promising approach relies on the observation of traffic events without a collision, in particular “unsafe” events often called “near misses” or “conflicts”. Such methods have been developed in several countries since the late 1960s and are now better known as methods for surrogate safety analysis. One commonly used, and probably the first invented, category of surrogate safety measurement tools is the Traffic Conflict Technique (TCT) which relies on the observation of conflicts. The widely accepted definition of a conflict according to the International Calibration Study of Traffic Conflict Techniques (ICSTCT) is as follows:
“A conflict is an observable situation in which two or more road users approach each other in time and space for such an extent that there is a risk of collision if their movements remain unchanged”. (Hydén & Amundsen, 1977)
The traditional TCTs rely mainly on human observers in the field to identify conflicts and interpret their severity. TCT thus suffers from intra-observer and inter-observer variations, in additional to the cost of conducting traffic conflict collections. The intra-observer variations and consistency problem are related to the variance of the observations made by the same observer when evaluating traffic events. The inter-observer variation concerns the potentially contradicting assessment of the same event by different observers. Operational indicators are used to measure the proximity to a potential collision, or probability of collision, and in some TCTs the severity of the potential collision. The term “severity” is typically used as an indication of the consequence of a collision in terms of property damage or injuries of one or more road users. Since a potential or hypothetical
collision is studied, its consequence is difficult to determine. Therefore, the general term safety indicator is used in this thesis to measure the safety of a traffic event to avoid confusion (see section 2.4.2 for more details). The safety indicator values are mostly calculated at a given time using the positions and speeds of the two interacting road users which cannot be measured in real time by human observers.
The development of microscopic simulation models provides a unique opportunity to conduct various advanced level analyses in the transportation engineering field. Among others, the ability to test possible strategies before their implementation is an important advantage of simulation. The Surrogate Safety Assessment Model (SSAM) was designed by the Federal Highway Administration (FHWA) to perform the analysis of trajectory data extracted from microscopic simulation software (e.g. VISSIM) (Gettman & Head, 2003; Gettman, Pu, Sayed, & Shelby, 2008). SSAM can calculate several safety indicators and the total number of conflicts. The traffic simulation models have several limitations such as the difficult calibration and validation of the models, the difficulty to represent driver behaviour well in particularly complex situations, and the perfect driver behaviour models that avoid all collisions. A detailed safety assessment using microscopic simulation model analysis is conducted by (Archer, 2005). The author concluded that existing simulations models do not yet represent sufficiently realistic road user behaviour (e.g. speed profiles in intersections and/or behaviour interactions with other users).
A possibility to reduce the limitations of surrogate measures of safety collected by field observers and simulation models is to collect automatically microscopic data (trajectories, i.e. series of positions), in particular using video sensors and computer vision techniques. A trajectory is defined as a sequence of positions, typically one position for each frame of the video. Hereafter, automated safety analysis based on video data can be conducted. This approach provides detailed microscopic data and offers a complementary approach to address the issues of manual collection methods. Yet, this automated approach is still under development and is not widely used.
For surrogate safety analysis, a key defining concept of all safety-relevant traffic events, is the collision course, i.e. a situation in which two road users would collide if their movements remain unchanged (taken from the conflict definition in (Hydén & Amundsen, 1977)). This requires specifying a method to predict the road users’ movements in order to evaluate whether they are on a collision course, and to measure several safety indicators such as the Time to Collision (TTC).
TTC is defined for a given motion prediction method as the time required for two vehicles to collide following the predicted trajectories. Most analyses rely on the rarely specified or justified method of extrapolation at constant velocity, while several possible paths may in general lead road users to collide. This uncertainty in motion prediction is the result of the following factors:
unobserved variables, e.g. the characteristics of the driver and the vehicle (if any), including the driving skills and ability to perform an evasive action, the awareness of road users to each other and their environment;
the stochastic nature of predicting the future given the current state of the system, e.g. the variability of motion choices (small variations in speed and direction), the complexity of all the road users’ interactions1;
measurement uncertainty, depending on the accuracy of the sensing technology.
The choice of a method for motion prediction is essential for surrogate safety analysis. Such methods are very similar to navigation and path planning in robotics, where collisions should be predicted and avoided. The difference is that robots know their goals, in particular places to reach, and can plan accordingly, while the analysis of road user interactions based on exterior observations does generally not have access to their internal state and goals. Therefore, a possible assumption is to iterate the future positions based on the assumed driver intention as a control input (e.g. acceleration and steering). Although this assumption considers partially driver behaviour, it does not consider the traffic environment (e.g. intersection layout, curbs, sidewalks locations). This shortcoming is particularly visible for turning vehicles. An appropriate solution is to learn the frequent road user motions, known as Motion Patterns (MPs), on the studied site. These patterns help to interpret the scene and to understand the road users’ behaviour, and they can be used for motion prediction in a probabilistic manner to compute several safety indicators. The automated learning of MPs is a challenging problem in the case of a large number of trajectories. New algorithms are therefore needed to mine these massive datasets while having a manageable computational cost in time and space. Moreover, the characteristics of the behaviour of road users
1 In this thesis, an interaction is defined as a traffic event in which two road users exist simultaneously and are close
can be described in terms of both trajectories (spatial information2) and speed profiles (temporal information) with respect to the traffic environment. However, limited work is documented to cluster (or even consider) individual speed profiles, separately from motion patterns. The joint or hierarchical learning of MPs and speed profiles and their applications for behavior analysis should be investigated.
1.2 Challenges
A generic framework is required to compute reliable surrogate safety measures. Therefore, four main topics have been studied in this research. Each topic has its own challenges as summarized in Table 1.1. Addressing these challenges and incorporating them will provide a robust approach for surrogate safety analysis.
Table 1.1: Current challenges of different topics for improving safety analysis approach
Topic Current challenges and limitations
Computer vision Varying quality of extracted trajectories e.g. with presence of noise.
Motion prediction models Most analyses are based on constant velocity model.
In robotics field, motion prediction for collision avoidance is a well-researched topic. These methods have not been investigated for surrogate safety analysis.
There is limited use of motion pattern methods for surrogate safety analysis. Few models have been proposed that include the variations of the speed profiles in motion prediction methods, for example for turning vehicles at an intersection.
Table 1.1: Current challenges of different topics for improving safety analysis approach (cont’d)
Topic Current challenges and limitations
Scene interpretation analysis
High computational cost in time and required storage space. Unsupervised scene interpretation is a challenging problem for traffic scenes. It should provide a description of road user behaviour with respect to traffic rules and environmental structure, with or without prior knowledge of the scene. Scene is interpreted by motion patterns learnt based on
spatial information only, limited work is documented to learn individual speed profiles, separately from motion patterns.
Surrogate safety analysis There is no generic framework that incorporates the previous topics after addressing their limitations to compute reliable surrogate measures of safety.
Current automatic video-based methods for surrogate safety analysis consider road users as points or circles to simplify the computation.
The interpretation of continuous safety indicators over time is based only on one value and not on the whole time series.
1.3 Objectives
The main objective of this research is to develop a consistent and generic framework for automated scene interpretation, driver behavior understanding, anomalous behaviour detection, and surrogate safety analysis. To achieve the main objective, specific objectives are identified as follows:
• Collect traffic video data and extract the trajectories for all road users using computer vision.
• Enhance the trajectories extracted by an existing video tracking tool to improve behaviour analysis accuracy (e.g. trajectory smoothing).
• Understand and interpret scene activities by developing a multi-level motion pattern learning framework. This framework must be able to detect anomalous events and to predict future behaviour.
• Propose new motion prediction methods and compare them to measure the safety of road users’ interactions.
• Study the influence of geometric representation of road user on the automated measure of safety indicators.
• Understand interaction processes by analyzing the similarities between indicator profiles over time.
1.4 Methodology Overview
To address the research objectives, the overview of the research framework is presented in Figure 1.2. The methodology conducted consists of two main phases:
a. In the first phase, road user trajectories are extracted from video data recorded with a fixed camera using a custom feature-based video tracker available in the open source “Traffic Intelligence” project (Saunier N. , 2014). An algorithm is developed to smooth the extracted trajectories using the feature trajectories dataset. An unsupervised multi-level motion pattern (MP) learning sub-framework is developed that is used for automated scene interpretation, driver behavior understanding, anomalous behaviour detection, and motion prediction application. Moreover, logical constraints are proposed to accelerate the processing time for learning MPs and predicting future road user motion.
Figure 1.2: Research Overview
b. In the second phase, an automated safety diagnosis sub-framework is proposed and used mainly to analyse the Left Turn and Opposite Direction (LTOD) interactions at a signalized intersection. In the proposed sub-framework, different geometric representations of road user volume are proposed to compute safety indicators and evaluated to compute the Post Encroachment Time (PET) indicator. For the safety indicators that rely on motion prediction method such as TTC, different motion prediction methods, including the output of the MP learning framework, are investigated to evaluate whether two road users are on a collision course and to compute several safety indicators. These methods are grouped into two main categories: kinematic and motion pattern matching (MPM) methods. Kinematic
Video Recording Multi-level Motion Pattern Learning Trajectories (positions, velocities) Traffic Intelligence Software Motion Patterns (prototype trajectories) Phase One: Scene interpretation
Motion Prediction Methods Conflict Diagrams Safety Indicator Computation Indicator Classification Phase Two: Surrogate safety analysis
Constant Velocity
Normal Adaptation
Set of Initial Positions Kinematic Methods
Road User Volume Representation
methods predict future motion based on a mathematical model using current vehicle state (e.g. current position and velocity). In this thesis, three methods are used: constant velocity, normal adaptation using control distribution function (e.g. acceleration and steering distribution) and set of initial position. On the other hand, MPM methods use the learnt prototypes, as prior knowledge of the studied site, to predict future motion according to the static traffic environment. Two safety indicators, TTC and a predicted version of PET (pPET), are calculated to assess the safety for the studied sites. The safety analysis is conducted by analyzing the distributions of indicators and by classifying similar indicator time series.
1.5 Contributions
The following contributions are done in this thesis:
1. An algorithm to reconstruct smooth road user trajectories based on feature trajectories. 2. The exploitation of points of interest3 (POI), entry and exit zones, to discover static
occlusion zones, filter trajectories, connect divided trajectories, detect outliers, and speed up MP learning and motion prediction.
3. MPs are extracted in two stages using spatial and temporal information. The integration of speed profiles in MPs is especially useful for motion prediction in the case of turning vehicles.
4. The application of the learnt prototypes (spatial and temporal) to anomaly detection, motion prediction and surrogate safety measures.
5. An investigation of different motion prediction methods to evaluate whether two road users are on a collision course and to compute safety indicators. Motion prediction based on following MPs proves to predict future behaviour realistically.
6. An investigation of different geometric representations of road user volume and their impact on the computation of safety indicators. It shows that the consideration of road
3 The POIs indicate regions where road users enter, exit, and stop, learnt from the origins and destinations of tracked
users’ outlines gives a more accurate estimation of PET in the case of an almost overhead camera view, while simple centroid based methods are more applicable for a low angle camera view.
7. Propose a probabilistic version of predicted post-encroachment time (pPET) indictor4. 8. An open source software implementation (Mohamed M. G., 2014) and (Saunier N. , 2014)
of the proposed methods to encourage adoption and further development.
1.6 Thesis Outlines
The remainder of this thesis is organized as follows:
Chapter 2 summarizes the literature review and identifies research gaps. The development of video analysis technology is presented and its application in the transportation domain. Additionally, the fields of behaviour analysis and scene interpretation are explained. Safety analysis methodologies are explored. Furthermore, the literature in the robotics field is reviewed to present the different methods for motion prediction and collision avoidance. Finally, the existing gaps and limitations are identified.
Chapter 3 introduces the methodology of the first phase of this research. The Traffic Intelligence project is explained. A novel smoothing algorithm is presented and a quantitative measure of the algorithm performance is discussed. A multi-level MP learning sub-framework is introduced for scene interpretation and anomaly detection.
Chapter 4 presents the application of the computer vision technique and the multi-level MP learning sub-framework on a comprehensive experimental analysis of three different intersections. Chapter 5 presents the second phase of the methodology for surrogate safety analysis. Different motion prediction and several safety indicators are explained. The automated measurement of PET is explained using four different road users’ representation methods. Two interpretation methods for continuous safety indicators are described.
4 The implementation and the proposed methodology to compute pPET is a joint contribution with Nicolas Saunier.
Chapter 6 presents the experimental safety analysis mainly of LTOD interactions in a signalized intersection. The influence of geometric representation of road user and different motion prediction methods on the measurement of safety indicators is discussed. The analysis of indicator distributions based on temporal aggregation and the analysis of the whole time series is investigated at the end to assess the safety of the interactions.
CHAPTER 2
LITERATURE REVIEW
This chapter provides a review of the literature of related works. We start with a discussion of video tracking technology and the applications to transportation. Scene interpretation, an important application of video analysis and a core concept of the probabilistic safety analysis framework, is described showing the advantages and disadvantages of existing techniques. Additionally, we provide a discussion on previous development of safety analysis (traditional and surrogates approaches). Finally, a literature review of the research on motion prediction methods, in particular from the field of robotics, is presented.
2.1 Video Tracking Technology
Video tracking is the process of detecting and tracking objects of interest over time using video sensors. It has attracted lots of attentions because of rapid improvement of quality and resolution of video sensors (cameras), in addition to the improvement in computer power. Video sensors can be mounted at relatively high positions (e.g. light poles) on a selected road element. They can collect traffic data with several advantages over traditional spot detector such as radar, ultrasonic sensors, and inductive loop detectors. Video sensors are relatively easy to install, low-cost and can cover a large field of view. Moreover, they have the ability to capture naturalistic data with limited risk of road users changing their behaviour if they felt being watched. Using video tracking tools, rich and detailed information about all the road users can be extracted from video data such as trajectories, velocities, accelerations, lane changes, etc. This information can provide a high level of interpretation about individual road user behaviour and interaction behaviour with other road users. On the other hand, traditional sensors provide traffic data only at the location of the sensors. For example, loop detectors are embedded in pavements: hence, the installation and maintenance of these detectors require an interruption of traffic. Consequently, they are an expensive tool and difficult to maintain, so that a large number of sensors is often out of service.
Video analysis tools have been utilized in the field of transportation, in particular for the collection of road user positional data. This data is used in several applications such as counting road users, automated safety analysis, behaviour analysis, calibration and validation of microscopic simulation models. For instance, video analysis tools are developed by research teams in the following universities: Lund University (Laureshyn A. , 2010), University of Washington (Malinovskiy, Wu,
& Wang, 2009), University of Minnesota (Atev, Arumugam, Masoud, Janardan, & Papanikolopoulos, 2005), University of British Columbia (Saunier & Sayed, 2006; Ismail, 2010) and Polytechnique Montreal (Saunier N. , 2014).The latter one is available in an open source project with several tools for transportation data analysis, including a video analysis tool. This project, called “Traffic Intelligence (TI)”, will be used in this research (for detail discussion about the video analysis tool available in TI, readers refer to Chapter 3). Methods for video analysis are classified into three main categories according to the level of automation: manual, semi-automated (supervised), and automated (unsupervised) (Maggio & Cavallaro, 2011)
Manual tracking: The user detects objects of interest in each frame manually by watching the video film on a computer and annotating the objects by ‘clicking’ on them with a mouse. Objects of interest are accurately detected but it is very time consuming, and cannot be used for large volumes of video data. This method may be used in a portion of video clip to construct ground truth data for validation and performance calculation purposes. An example of an annotation tool developed at Polytechnique Montreal is available in the video tracking project called Urban Tracker (Jodoin, Bilodeau, & Saunier, 2014).
Automated tracking: uses prior information about objects of interest that is defined mainly as a manual configuration input. Fully automated video-tracking technique is still under development in the field of computer vision and not widely used in real-world applications. These algorithms interpret pixels in an image sequence. Buch, Velastin, and Orwell (2011) reviewed the development of computer vision techniques for urban traffic analysis. Computer vision technique can overcome several limitations of field observers and manual video analysis such as the time-consuming and error-prone procedure. Semi-automated tracking: is a combination of manual and automated video trackers. It
aims to employ computer aid in the processing of video records with an intervention of a user to obtain satisfactory results. In some cases, trained observers review a portion or all video clips manually for correcting and validating the quality of the tracked objects. Video tracking consists of three main steps: defining an object of interest, object detection, and object tracking.
1. The Object of interest is defined based on the application. In transportation applications, objects of interest usually refer to the road users (vehicles, pedestrians and cyclists), while in building surveillance, they may refer to people and their behaviour.
2. Object detection algorithm, known also as object segmentation, aims to detect and identify the objects of interest in an image or video sequence. It is the foundation of the next process (i.e. object tracking) because only these objects will be considered later. The detection methods rely on either temporal or spatial information in the image sequence. The common approaches used for object detection are outlined as follows (Hu, Tan, Wang, & Maybank, 2004; Liu, Wu, & Zhang, 2008):
o Optical flow approaches are methods to analyze relative motion between the objects and the scene in the sequence of images. The optical flow is the distribution of the apparent velocities of objects in an image. This approach relies on the characteristics of flow vectors of moving objects over time which detects moving objects in the image sequence. The main drawbacks of these approaches are the complex computation methods and sensitivity to both of noise and variations in scene illumination (Liu, Wu, & Zhang, 2008).
o Temporal differencing approaches detect the moving region based on pixel wise difference between two or three consecutive frames in an image sequence. In (Lipton, Fujiyoshi, & Patil, 1998), an absolute difference of intensities in consecutive frames is computed, and then objects are extracted based on a defined threshold (e.g. 15 % of digitizer brightness range). The objects are clustered into motion regions using a connected component criterion. These approaches have low computational complexity. Despite the simplicity of these approaches, they are very sensitive to the selected threshold. A small threshold generates a lot of noise, however, a large one leads to miss a lot of information. In addition, the speed of objects affects the detection where speedy object can be treated as two objects (Yi & Liangzhong, 2010). Although these approaches are very adaptive to dynamic environments, they failed to detect all relevant features and the true shape of moving object (Spagnolo, Leo, D’Orazio, & Distante, 2004).
o Background subtraction is a common and effective method for object segmentation. Many background subtraction algorithms are built to detect moving object in an image, following almost the same scheme (Sobral & Vacavant, 2014):
1) Background initialization: its goal is to build a reference background model, 2) Foreground detection: its goal is to compare the current image with the
background model, and
3) Background updating: its goal is to update the initial background model during the detection process.
There are several methods for background subtraction such as basic methods (e.g. absolute difference, mean, and variance), fuzzy methods, statistical methods using one or multiple Gaussians, and Eigen composition methods. Sobral (2013) offers a library of 37 background subtraction algorithms.
3. Object tracking algorithms can be classified into four major categories of algorithms (see (Hu, Tan, Wang, & Maybank, 2004; Saunier & Sayed, 2006; Liu, Wu, & Zhang, 2008) for more details). Each algorithm could be used alone or integrated with other algorithm to track objects. Each category is described as follows:
o Region based tracking algorithms rely on identifying connected regions of the image (blobs) associated with each object, often obtained through background subtraction. Region-based algorithms are suitable in the free-flowing traffic condition. Congested traffic is considered as a serious problem for this category of algorithms. It groups more than one object in one large blob which leads to undercounting objects (Malik & Russell, 1997; Saunier & Sayed, 2006).
o Active contour based algorithms: a contour is commonly known as a “snake”. The idea is to detect and track the moving object outline and keep updating it dynamically. Contour based algorithms are better than region based algorithms as they reduce the computational complexity (Malik & Russell, 1997). Nevertheless the problems stated previously remain.
o Model-based tracking algorithms are performed in the following sequence steps (Koller, Daniilidis, Thorhallson, & Nagel, 1992). First, the algorithm needs to
choose an accurate wire-frame 3D model of typical objects. Second, these models are projected into the image plane. Finally, the projected models are matched with the detected objects and tracked in subsequence frames. While this algorithm achieve accurate trajectories, detailed information on object geometry is very difficult to obtain.
o Feature-based tracking algorithms perform the tracking and recognition of objects by extracting elements such as points instead of tracking them as a whole region. The algorithm can deal with the presence of partial occlusion by tracking visible parts of any object (Liu, Wu, & Zhang, 2008). This advantage makes the use of this algorithm possible in different lighting conditions: daylight, twilight, night-time and different traffic conditions (Saunier & Sayed, 2006). The Kanade-Lucas-Tomasi feature trackers (Kanade-Lucas-Tomasi & Kanade, 1991) are mostly used to track the features. The object consists at this stage of multiple features. The next procedure is grouping or clustering of these features to generate the object hypothesis. Feature-based tracking is the method of choice in the TI project and will be used in this thesis.
Nonetheless, a number of video analysis methods combine different tracking algorithms. For example, Jodoin et al (2014) combined the region based and feature based tracking algorithms. Region-based algorithm are used to estimate the object size and to group features; a feature-based algorithm is used to deal with the partial occlusion issue.
Video analysis can be used for traffic management to collect different traffic parameters such as vehicle counts and speeds which can also be classified. Bas, Tekalp and Salman (2007) counted vehicles from video using adaptive blob size for detecting and tracking vehicles. The adaptive blob method considers that the vehicles far away from the camera will appear as smaller blobs. Hence, this method estimates the relative distance between the camera and blob, then it adopts the blob size accordingly. Zhao and Wang (2013) proposed a new approach for counting vehicles through learning first semantic regions. The semantic regions classify and form the typical movement paths in the scene which facilitate the counting of vehicle in each path separately. Morris and Trivedi (2008b) used video analysis for two different traffic system: 1) the VEhicle Classifier and Traffic flOw analyzeR (VECTOR) module which is used for vehicle classification into eight different
types on highways, collect traffic statistic modelling (e.g. speed, flow, lane density), 2) a Path behaviour analysis module which deals with behaviour analysis and path modelling. In (Messelodi, Modena, & Zanin, 2005), the authors utilized a robust background and feature-based tracking method to track moving objects. The trajectories are used to estimate the speed profile of each object and to classify objects into seven categories based on model matching technique.
Automatic behaviour analysis is an important application and a very challenging problem. In the literature, machine learning and video analysis are integrated to understand activities in the scene. Existing techniques are discussed in detail in the next section.
One of the most challenging and useful application of video analysis is automated safety analysis. Atev et al (2005) proposed a vision based system to monitor intersection and predict a possible collision. The system can issue a warning message if a possible collision is predicted. Saunier and Sayed (2007) developed a system to extract traffic conflict automatically and analyzed the safety of a site using video sensors data. Zaki, Sayed, Ismail, and Alrukaibi (2012) identified traffic violations (spatial and temporal) by pedestrians using computer vision and machine learning techniques in two intersection cases. The authors defined the spatial violation as a pedestrian crossing an intersection through undesignated locations while temporal violation is defined if a pedestrian crossed an intersection during an improper signal phase. Jackson, Miranda-Moreno, St-Aubin, and Saunier (2013) presented the development of a mobile video camera system and of the open source TI project to collect and analyze video data. Three case studies are illustrated to show the effectiveness of this system to study automatically road user behaviour and safety.
2.2 Scene Interpretation
Scene interpretation applied to transportation seeks to understand traffic behaviour and analyze activities in the scene. One accepted framework for scene interpretation was introduced by Makris and Ellis (2005) where the scene is modeled as a topological map consisting of nodes and edges. The nodes are points of interest (POIs) which refer to regions where some activity occurs, whereas the edges are the activity paths which represent how the objects move between the POIs. Therefore, the activity analysis can be summarized in two main tasks; discovering the points of interest (POI) and learning activity paths. Activity learning is performed based on two main approaches: the