HAL Id: ineris-00972414
https://hal-ineris.archives-ouvertes.fr/ineris-00972414
Submitted on 3 Apr 2014HAL is a multi-disciplinary open access
archive for the deposit and dissemination of sci-entific research documents, whether they are pub-lished or not. The documents may come from teaching and research institutions in France or abroad, or from public or private research centers.
L’archive ouverte pluridisciplinaire HAL, est destinée au dépôt et à la diffusion de documents scientifiques de niveau recherche, publiés ou non, émanant des établissements d’enseignement et de recherche français ou étrangers, des laboratoires publics ou privés.
Urban atmospheric stratification and its dynamics : ABL
development above the city of Marseille and in the
surroundings
Clothilde Moppert, F. Said, Patrick Augustin, Sylvain Geffroy, Hervé
Delbarre, P. Freville, Amandine Fievet, Bernard Campistron, Emeric Frejafon
To cite this version:
Clothilde Moppert, F. Said, Patrick Augustin, Sylvain Geffroy, Hervé Delbarre, et al.. Urban at-mospheric stratification and its dynamics : ABL development above the city of Marseille and in the surroundings. 4. International Conference on Urban Air Quality Measurement Modelling and Man-agement, Mar 2003, Prague, Czech Republic. pp.388-391. �ineris-00972414�
Urban atmospheric stratification and its dynamics: ABL development above thé c'rty of
Marseille and in thé surroundings.
Moppert C.0'2', Saïd F.(2), Augustin P.(3), Geffroy S.( M\ Delbarre H/3', Freville P/3 1, Fievet A/ 0, Campistron B .® and Frejafon E.0'*1
(l): INERIS, BP 2, 60550 Vemeuil en Halatte, France / (2): LA, 14 av. Belin, 31400 Toulouse, France (3): LPCA, 145 Av Schumann, 59140 Dunkerque / (4): LASIM, 43 Bd 11 Nov., 69622 Villeurbanne *: Corresponding author: Emeric.frejafon(%ineris.fr
ESCOMPTE 2001 [1,2] is a field experiment that took place in thé south-east of France in order to understand chemical transformation and transport of air pollutants and then to improve numerical models devoted to study and forecasting: http://medias.obs-mip.fr/escompte.
In order to build such 3D database, a large set of ground based, onboard and remote data were collected through several measurement techniques. To be used for model validation, such database needs a reliability that can be obtained by checking thé data cohérence. For this, we had perfonned a specialized quality control on altitude ozone measurement, including LIDAR, airplanes and radio-sondes instruments, showing a global cohérence within an uncertainty below 15%, which fùlfils thé European guidelines. Such quality control, which was performed on ail chemical and physical measurements, had validated thé 3D database and thus ail extracted data shall be compared. As an application to thé ABL characterization, several flights were devoted to thé study of Marseille urban boundary layer where Wind angular LIDAR, Ozone and aérosol angular LIDAR, wind RADAR profilers and Constant Volume Balloon had made continuous characterization of thé urban and sub-urban boundary layers. Thus, such combined results [5], which give a global overview of the ABL stratification and its dynamic, might aiso defined some corrélations between chemical vertical stratification, especially on ozone and aérosol, and local or global dynamic effects like for example see breeze development.
MaHvmorf (aircraft soundi
Flight trajecl
Figurel : trajectory of the Merlin 19 flight Figure 2: wind vectors along thé 4 horizontal legs
ABL dynamic characterization
Thé "Merlin" aircraft from Météo-France fiew above Marseille at différent altitudes in order to obtain a vertical description of the low troposphère. "Thé Merlin" flight on June 26*'', from 9h20 to 12h30 UTC, was divided in first a vertical sounding above Mallemort (40 km, north of Marseille) and then four horizontal legs (2700, 1100, 800 and 500m) along 80 km North-South and 50 km East-West transects over Marseille (figure 1).
Thé wind speed was strong and easterly at 500m and then tumed into a westerly flow at 2700m, which corresponds to sea breeze at low levels and synoptic wind at 2700m (figure 2). This présentation deals with thé four North-South legs. Thé aim is to try to retrieve and analyse thé boundary layer topography along a transect that is crossing thé coast, south to thé city.
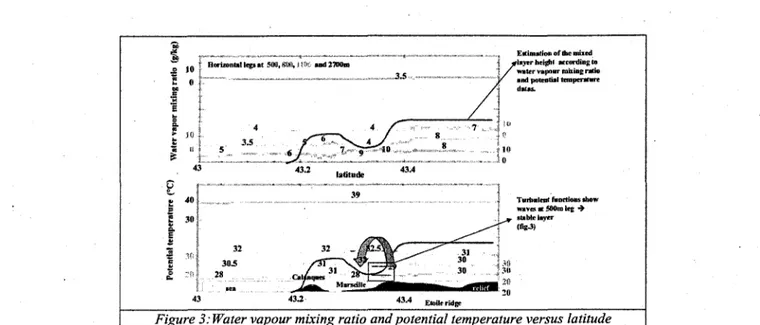
Figure 3 shows thé water vapour mixing ratio and thé potential température versus latitude for thé four legs, which are spaced vertically according to thé height. Thé highest leg is at 2700m and thé lowest at 500m. Thé aircraft flies over thé sea, crosses thé Calanques ridge (150m), Marseille town and Etoile mountain (200m under thé flight leg). On this graph, we plotted an estimation of thé boundary layer height (in red) according to thé variation of both potential température and humidity mixing ratio.
Turbulent functions show waves at 500m leg •> • tabl e layer 43 Etoile ridge
Figure 3: Water vapour mixing ratio and potential temperature versus latitude
We found a sea breeze situation with a stable gradient above thé sea between thé surface and thé free troposphère and unstable above thé ground. Thé height of thé ABL increases after thé Calanques ridge, mainly due to thé relief. Above Marseille, we hâve lower values of humidity mixing ratio (4g/kg) and higher values of potential température (32°C) at thé 800m level. So we can estimate thé ABL height between thé two lowest legs above Marseille. Norther to Marseille, humidity mixing ratio values are high (8g/kg) and potential température values low (30°C) at thé 1100m legs. So we plotted thé height of the ABL over thé 1100m leg. It resulted in a boundary layer that is lower above Marseille than above thé ground, inland. This height bas been confirmed by thé Marseille radiosounding information at UTC 12, which indicated 730m. Moreover, thé UHF radar data confirm this resuit (fîg 4a.). Thé boundary layer height that we suppose to be constant north to N 43°4 is consistent with other boundary height measurements at thé same distance from thé coast such as Avignon (1000m at 10h30 UTC) or Aix-les-Milles (1300m at 12h40).
VERTICAL VELOCITY (M/S)
-1.5 - 0 . 9 - 0 . 3 0.3 O 9 1~5
T * . .11 ' l ' l ' l ' l ' l ' l ' i1!1
t «II i s m m
Turbulence raie from IMF turbulence ktaeticenerEy Subsidence until lIb UTC
'.ffCTx*m*?i.i.i I.I.*. . .1,1.1,1.1.1.1 i. n
i
- j
Ê
ABL heigbl variation oblaiiieJ fr..iti UHF renertivhy measurfinents Positive vertical velocitv Négative vertical veludty
00 02 04 06 OE 10 1 ; M 16 18 2 0 22 0 0 25JUW1 TtME (UTC) 26JUN01
ESCOMPTE P012 UHFJCNRM Marseille
Figure 4a: Vertical velocitv, Marseille 26/06/0} (UHF)
Figure 4b: Turbulence rate, vertical velocity and ABL height in Marseille on June 26th (UHF radar)
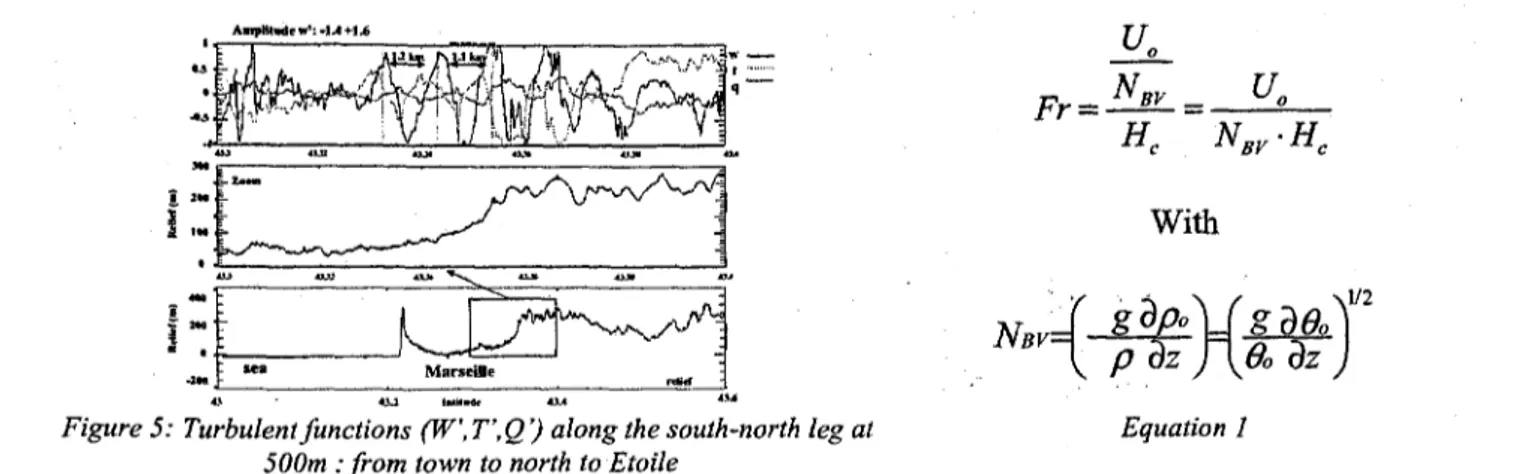
Additional information is given by thé turbulent fùnctions. We plotted thé turbulent fonctions of thé vertical velocity, température and humidity (fig.5) for thé lowest leg (at 500m). This graph displays some waves above thé Etoile ridge, which is quite strange for a flight leg, which is situated in thé so-called mixed layer, as indicated in fig.3 where thé 500m leg is supposed to be flown in thé unstable layer. It's not possible to see waves inside an unstable layer due to turbulence effects. In fact thèse waves point out a thin stable layer between 500 and 800m. This stable layer seems to be a resuit of thé "Etoile" relief, which générâtes an ascending flow over thé hill colder than thé air above. This flow leaps up along thé hill and then cornes back to thé city of Marseille as a retum flow, which brings a négative velocity, schematised by pointing down a row on fîgure3. Later in thé aftemoon, thé differential heating between thé hill and downtown vanishes and thé UBL climbs up to 1030m agi., as indicated by thé UTC 14 h radiosounding in Marseille (figure 4a). Such a capacity to climb up along thé mountain is confirmed by thé calculation of thé Froude number, which was closed to thé critical value, as it is show in équation (1).
1.4
i:
NBy-Hc
With
Figure 5: Turbulent fonctions (W,T'.Q') along thé south-north leg at 500m :from town to north to Etoile
Equation 1
This means that thé flow goes over thé mountain with a possibility of lee waves fonnation after thé top over-flowing. Finally, whereas thé boundary layer development should be more important in an urban area than in a rural area, such description is in our case limited by three différent factors such as thé sea coast proximity, thé retum flow above thé town due to thé slope current and aiso a mesoscale subsidence which is due to thé anticyclonic situation. Last two features are shown in figure 4b, which indicates a descending (blue before UTC 12) and then ascending vertical wind velocity (red between UTC 13 et 15), estimated by thé UHF profiler radar, installed in Marseille downtown. This weak height of the boundary layer enhanced thé pollution épisode because of a less important dilution of the pollutants.
Aérosol vertical stratification withîn thé UBL
Beside this dynamic information, a measurement site in thé sub-urban area of Marseille was equipped by 2 angular LIDAR, giving information on thé Aérosols spatial distribution, thé ozone concentration and thé radial wind velocity distribution.
We first obtained thé dynamic of the ABL and thé angular aérosol load, over several kilomètres in North-South direction. Long tenu angular scan of ozone concentration and atmospheric extinction were made and especially simultaneousiy to thé flights described above.
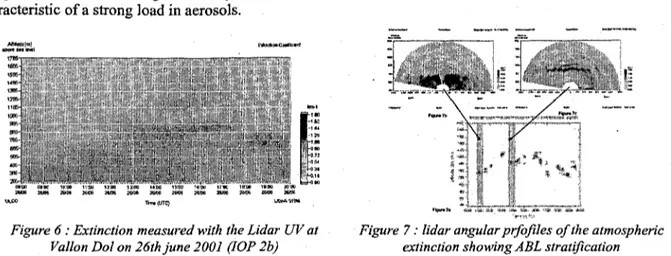
On this June 26th 2001 (3 "1 day of lOP 2b) case study, which corresponds to an ozone pollution épisode, where thé ozone concentration had reached thé French public information level, thé UV angular lidar provided spatial distribution of thé extinction coefficient in order to deduce thé development of thé ABL in thé sub-urban région of Marseille. This lidar was located at Vallon Dol (43.36° N, 5.4° E), 285 m ASL, 5 km from thé coast and aiso about 5 km from Marseille downtown. Extinction measurements were carried out using thé off wavelength of the ozone DIAL angular lidar (?i=286.3 nm). Thèse measurements were obtained from several vertical cross section of thé atmosphère (angular scan from horizon to zénith in soufh and north directions) along a North-South axis and an approximately range of 1500m.
Figure 6 represents thé temporal évolution of thé extinction versus altitude, up to 1800 m (ASL) between 8h00 and 20h00 (UTC). For each lidar beam, thé extinction is computed using thé slope method. This figure is obtained by vertical projection of angular scans with a OlhOO temporal intégration and a 100 m spatial intégration. Such représentation of thé temporal évolution of thé atmospheric extinction vertical profile, allows thé characterization of the stratification and thé dynamics of the ABL, generally recognized by thé contrast of the aérosol load between low and high altitude lowers. Thé height of thé ABL, which is at 750m at 1 IhOO UTC, rises up to 1000m at 13h00 UTC and then stabilizes at 950m at 14h00 UTC. At thé end of thé see breeze development (17h00 UTC), thé 950m layer decreases down to 750 m and then cornes back to its moming height. Thé transition between thé différent layers, can aiso be obtained directiy and more precisely by thé lidar signais, avoiding any interpolation. Figure 7a shows thé précise height évolution of the ABL obtained from thé log scale of thé range corrected lidar signal and thus each point indicates first thé top height ABL position from 1 IhOO to
17h00 (UTC) and then thé setting of a layer between 17h00 and 20h00 (UTC). It is then possible to indicate more precisely thé transition from a 750m-altitude layer at IlhOO (UTC) to a 950m-altitude layer at 14h00 (UTC). This rising is probably related to thé descending and ascending vertical velocity estimated by thé UHF radar profiler (figure 4b). Thé angular vertical cross section (figure 7b) carried out at about 1 IhOO (UTC), shows
thé présence of an homogeneous layer characterized by high extinction coefficients (closed to 2 characteristic of a strong load in aérosols.
km'1),
-AH
ULCO Ttmt (UTEO
Figure 6 : Extinction measured with thé Lidar UV at Vallon Dol on 26th june 2001 (IOP 2b)
Figure 7 : lidar angular prfofiles of the atmospheric extinction showing ÂBL stratification
Atter thé rising of the ABL, mainly when convection processes take place, thé aérosols load is definitely lower due to dilution processes (about 1.2 km'1) but still increases at thé top of the ABL (about 950m) as shown on figure 7c. Such aérosol load at thé top of thé ABL and thus in thé see breeze development layer, might correspond to a transport effect of maritime aérosols. In order to confirm this bypothesis and then be able to quantify thé see breeze effect, dynamically but aiso in thé atmospheric aérosol load, it is then important to evaluate thé vertical profile of the size distribution.
Vertical distribution of the aérosol size distribution as ABL parameter
As it is difficult to use onboard instruments due to thé fast ABL rising processes, remote sensing technique might be an alternative method. But, as remote sensing instrument is of common use for gaseous pollutants, it is still under development regarding aérosols characterization and especially for concentration and size distribution évaluation. In particular, UV and IR lidar profiles obtained during thé ESCOMPTE campaign with temporal and spatial corrélation (co localized in thé same measurement site), had shown différent atmospheric stratification. As it is well known, beside molecular absorption, ail aérosols and molécules along thé beam affect UV lidar signal; Oppositely, mid-IR lidar signal is affected by coarse particles.
Using thé spectral dependency of thé aérosol scattering, one can then obtained thé response on coarse or fine particles by selecting thé lidar wavelength. As it was seen above, ozone lidar profiles were made in thé UV range. In thé same measurement site, thé radial wind was aiso evaluated simultaneousiy using thé Wind angular Doppler lidar, which works in thé IR région. Using lidar signais in thé UV range (off ozone dial wavelength) and in thé IR range (10.2u.rn Doppler lidar wavelength), we will then try to obtain thé 2 principles modes of thé aérosol size distribution. To achieve such resuit, beside lidar profiles in thé UV and IR régions, we will aiso use first a new lidar algorithm based on fractal. Mie and Rayleigh theory, a non-linear Kemel procédure and finally, as we need to reduce thé uncertainty associated to this resuit, we will use physical parameters like thé aérosol index, pressure and humidity instead of thé common fit parameters usually employed. We finally expect to retrieve thé vertical profile of thé size distribution dynamic, which might characterize thé transport effect of maritime aérosol under sea breeze development.
Références
1. Cros B et al, 2002 : « ESCOMPTE program : an overview ». accepted in Atmos. Res. 2. Cros B et al, 2002 : « Thé ESCOMPTE experiment. », AMS, Norfolk,USA
3. Saïd F et al 2002 : « Vertical Structure of the Polluted Low Troposphère », XXVIIEGS, France 4. Puygrenier et al, 2002 : « Comparison of Urban and Rural Atmospheric Boundary Layers During Sea
Breezes ». 7"' Conférence IGAC, Crète, Grèce
5. A. Thomasson et al, 2002 : « LIDAR mapping of ozone-épisode dynamics in Paris and intercomparison with spot analyzers », App. Phys. B 74 pp 453.