HAL Id: hal-01308053
https://hal.archives-ouvertes.fr/hal-01308053
Submitted on 27 Apr 2016
HAL is a multi-disciplinary open access archive for the deposit and dissemination of sci-entific research documents, whether they are pub-lished or not. The documents may come from teaching and research institutions in France or abroad, or from public or private research centers.
L’archive ouverte pluridisciplinaire HAL, est destinée au dépôt et à la diffusion de documents scientifiques de niveau recherche, publiés ou non, émanant des établissements d’enseignement et de recherche français ou étrangers, des laboratoires publics ou privés.
TSC and Broadband Dielectric Spectroscopy Studies of
β Relaxation in Phosphorus-Containing Dendrimers
Eric Dantras, Colette Lacabanne, Anne-Marie Caminade, Jean-Pierre Majoral
To cite this version:
Eric Dantras, Colette Lacabanne, Anne-Marie Caminade, Jean-Pierre Majoral. TSC and Broad-band Dielectric Spectroscopy Studies of β Relaxation in Phosphorus-Containing Dendrimers. Macro-molecules, American Chemical Society, 2001, vol. 34 (n° 12), pp. 3808-3811. �10.1021/ma001740v�. �hal-01308053�
O
pen
A
rchive
T
OULOUSE
A
rchive
O
uverte (
OATAO
)
OATAO is an open access repository that collects the work of Toulouse researchers and makes it freely available over the web where possible.
This is an author-deposited version published in : http://oatao.univ-toulouse.fr/ Eprints ID : 14313
To link to this article : DOI : 10.1021/ma001740v URL : http://dx.doi.org/10.1021/ma001740v
To cite this version : Dantras, Eric and Lacabanne, Colette and
Caminade, Anne-Marie and Majoral, Jean-Pierre TSC and Broadband Dielectric Spectroscopy Studies of β Relaxation in Phosphorus-Containing Dendrimers. (2001) Macromolecules, vol. 34 (n° 12). pp. 3808-3811. ISSN 0024-9297
Any correspondance concerning this service should be sent to the repository administrator: [email protected]
TSC and Broadband Dielectric Spectroscopy
Studies of
βRelaxation in
Phosphorus-Containing Dendrimers
E. Dantras and C. Lacabanne*
CIRIMAT, Laboratoire de Physique des Polyme`res,
Universite´ Paul Sabatier, 31062 Toulouse Cedex 04, France
A. M. Caminade and J. P. Majoral
Laboratoire de Chimie de Coordination, 31077 Toulouse Cedex 04, France
Introduction.With their self-similar architectures, dendrimers constitute good models of complex struc-tures. After Vo¨gtle’s results,1further investigations have intended to increase the generation number.1,2The state of the art is reached with phosphorus-containing den-drimers3(12th generation). The aim of this work is to analyze the evolution of molecular mobility upon in-creasing of generation. Thanks to complementary di-electric techniques as thermostimulated currents (TSC) and dynamic dielectric spectroscopy (DDS), the mech-anism of dipolar polarization and its evolution as a function of the generation of dendrimers will be studied. DDS shows the shift of relaxation mode on a wide frequency and temperature range as being shown previously.5-8Owing to its low equivalent frequency and
its high sensibility, TSC experiments give complemen-tary information on the elemencomplemen-tary components of the complex relaxation. Moreover by using fractional po-larization, the experimental distribution function of the activation parameters has been determined. In this communication, we focus on low-temperature relax-ations of phosphorus-containing dendrimers of genera-tions 0, 1, and 2.
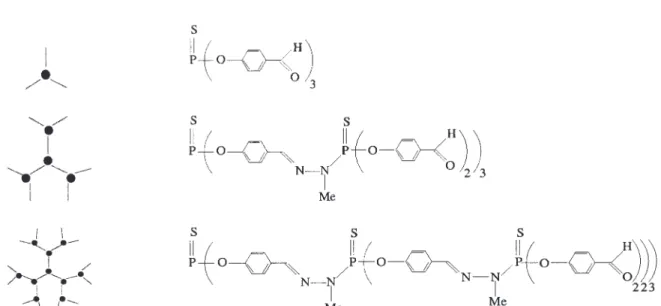
Experimental Section.Phosphorus-containing den-drimers are characterized by a regularly branched treelike architecture and strongest dipolar moment values found in dendrimers3 (for exampleµ )1.082× 10⁻²⁸ C‚m for a generation number g) 11). From a
phosphorus core constituted by the strong PdS dipole, these dendrimers were synthesized by a convergent process which consists on iteration of chemical steps. On the same core, radially branched layers were at-tached (Figure 1). Dendrimers were synthesized genera-tion after generagenera-tion. Details of synthesis of this amor-phous polymers were published elsewhere.3,4Numbering of these compounds hereafter will be done as follows: [G′g] in which g is the number of generationshere g) 0, 1, and 2sand G′corresponds to a dendrimer with terminal aldehyde groups. All the studied samples are available as powder. For g )0, no calorimetric mani-festation of glass transition has been pointed out. For g )1 and g)2, the glass transitions Tgof the studied phosphorus-containing dendrimers are 346 and 395 K respectively. In the case of DDS, the sample is consti-tuted by a thin layer of powder (100(10µm). For TSC experiments, slightly compressed pellets of 800(10µm thickness were directly inserted between electrodes.
Broadband dielectric measurements were performed using a NOVOCONTROL BDS400 covering a frequency range of 10-2to 3
×106Hz with 10 points per decade. Experiments were carried out with a temperature range 123-373 K. Dielectric isotherms spectra were measured every 5 K. Before each frequency scan, temperature was
kept constant to within (0.2 K. The real ǫ′T and
imaginaryǫ′′Tparts of the relative complex permittivity ǫT/, were measured as a function of frequency F at a given temperature T.
Complex TSC spectra and fractional polarization analysis were carried out on a Thermold TSC/RMA spectrometer. For global experiments, the sample was polarized by an electrostatic field Ep ) 400 kV‚m-1
during tp )2 min over a temperature range from the
polarization temperature Tp ) 173 K down to the
freezing temperature T0 ) 93 K. Then the field was turned off and the depolarization current was recorded with a constant heating rate (qh ) +7 K‚min-1), so that
the equivalent frequency of the TSC spectrum was feq ∼10-3 -10-4Hz. TSC experiments are complementary from DDS spectroscopy on the low-frequency side. For windowing experiments (ith elementary peak), the polarizing field was applied for tp )2 min at Tpi. Then the sample was short-circuited at Tdi )Tpi -∆Tpand the temperature was maintained constant for td ) tp. Then the sample was cooled at T0i )Tpi - 50 K, and the depolarization current was recorded in the same way as for the complex mode. Two types of windowing experiments11,12were carried out: narrow poling win-dows (∆Tp e5 K) for isolating elementary processes and large poling windows (∆Tp g20 K) for the “cleaning process”. Wide poling windows might allow us to exhibit the various components of relaxation modes and narrow poling windows give elementary TSC spectra that can be analyzed by the hypothesis of a single relaxation time.
Results and Discussion. Figure 2 displays the dielectric loss spectra of the low-temperature relaxation mode for g ) 0 (Figure 2a) and g ) 2 (Figure 2b) of phosphorus-containing dendrimers. Experimental data are fitted by the Havriliak-Negami (HN) function9,10 without any additional conductivity term
where ǫ∞ is the relative real permittivity at infinite frequency, ǫst is the relative real permittivity at null frequency,τHNis the relaxation time,ωis the angular frequency, andRHNandβHNare the Havriliak-Negami parameters. Numerical values of HN parameters are reported in Table 1.
For g)0, the dielectric loss profile confirms previous data on different dendritic macromolecules:5 a quasi-Debye modeβ[G0′]is pointed out. Since the isotherm T) 248 K, conductivityσappears on the low-frequency tail ofǫ′′T(ω). Nevertheless, it does not modify the Havriliak -Negami fitting.
For g ) 1 and g ) 2, two relaxation regimes are
observed: (R[G1′]; R[G2′]) the dielectric manifestation of glass transition and a low-temperature mode (β[G1′];
* Corresponding author. E-mail: [email protected].
ǫ Τ /( ω)) ǫ ∞+ ǫst - ǫ ∞ [1+(iωτHN)RHN]βHN (1)
β[G2′]). For g)0, the sample exhibiting no glass transi-tion, noRdielectric relaxation is observed. Contrarily, all studied phosphorus-containing dendrimers have a secondaryβrelaxation mode.β[G0′],β[G1′], andβ[G2′]modes
are characterized by relaxation times with an Arrhe-nius-like dependence
where R is the ideal gas constant,τ0is the preexponen-tial factor, and∆H is the activation enthalpy.τ0 is on the order of magnitude of∼10-13s.
According to the Eyring relationship
where h is the Planck constant, kB is the Boltzmann constant, and ∆S is the activation entropy. For [G′0], [G′1], and [G′2], ∆S is near zero, and ∆H takes the values∆H)40.4, 32.6, and 34.9 kJ‚mol-1respectively.
This parameter is strongly dependent upon the genera-tion. In others dendrimers6,7,8activation enthalpies of β-modes vary from 16 to 80 kJ‚mol-1for g)0 and g)
2, respectively. This variation has been attributed to differences in their physical structure. In phosphorus-containing dendrimers, the activation enthalpy of [G′0] remains of the same order of magnitude than for [G′1] and [G′2]. It is also important to note that the single peak of [G′0] is perfectly explained by the existence of a single mobile dipolar species which is the aldehyde end group. The low-temperature mode β[G1′]/β[G2′] occurs in the same temperature range than β[G0′], but its half-width increases: HN parameters related to mode half-width vary fromRHN([G′0]))0.90-0.971 toRHN([G′2]))0.28 -0.41(cf. Table 1). The hypothesis of an additional dipolar relaxation is proposed in order to explain this important
Figure 1. Scheme of phosphorus-containing dendrimer architectures (points (b) symbolize PdS groups) and molecular structures
for g)0, 1, and 2 (respectively [G′0],[G′1], and [G′2]).
Figure 2. (a) Frequency and temperature dependence of the dielectric energy loss for theβ-mode of [G′0]. (b) Frequency
and temperature dependence of the dielectric energy loss for theβ-mode of [G′2].
Table 1. Havriliak-Negami Parameters (Variation of HN Parameters with Temperature) for the Various
Generations HN param g)0 [G′0] g)1 [G′1] g)2 [G′2] RHN 0.90-0.971 0.27-0.53 0.28-0.41 βHN 0.912-1.0 0.85-1.0 1.0 τ(T))τ0exp∆H RT (2) τ0 )khBTexp- ∆S R (3)
broadening. A more detailed analysis of the complex relaxation modes, was carried out by TSC experi-ments.
Figure 3a shows the complex TSC spectrum in full line of phosphorus-containing dendrimers of generations 0, 1, and 2. The polarization temperatures are indicated by the small arrows on the figure. The global TSC
spectrum for g ) 0 presents a narrow peak, whose
maximum is located at 149 K. Fractional polarization with∆Tp )5 K, exhibits a quasi-non-distributed mode. The temperature dependence of relaxation times is expressed by an Arrhenius equation (eq 2). Equations 2 and 3 permit us to extract ∆S and ∆H, and these values are listed in Table 2. Let us consider the major contribution component of this mode located at Tm ) 146 K: τ0is close to 10-14s, which is coherent with DDS
data. Consequently, this mode has been assigned to local dipolar relaxation.
In the case of g)1, a single mode is observed near Tm )131 K. Taking as reference G′0, both characteris-tics half-width (∆1/2) and maximum current (Im) of the peak slightly increase (from ∆1/2([G′0]) ∼ 20 K to ∆1/2 ([G′1])∼40 K, and Im([G′0])∼6×10-14A to Im([G′1])∼ 1×10-13A). The peak temperature maximum is shifted toward lower temperature.
Contrarily to the modes observed for g)0 and g)1, the one recorded for g)2 is metastable. After a series of scans at the same rate in the investigated tempera-ture range, it stabilizes and gives the spectrum reported as a solid line in parts a and b of Figure 3. After poling the virgin dendrimers, a single peak is recorded (dashed line in Figure 3b). The higher temperature component has the same behavior than relaxation processes due to physical aging while the low-temperature component has the characteristics of a relaxation associated with a secondary transition.
To isolate both components, the windowing technique (“cleaning process”) has been applied.
The polarization temperatures are indicated by small arrows on the Figure 3a. The complex TSC spectrum has been resolved by this technique into two submodes (dashed line in Figure 3a): first one β1[G2′] near T1 ) 128 K and a second one β2[G2′] near T2 ) 163 K. As expected, this complex mode has two major components. Their envelope (dashed line) follows the same variation as the complex mode (full line) of [G′2]. But neither β1[G2′]norβ2[G2′]can be compared withβ[G0′]: temperature positions (∆T(β1,2[G2′] β[G0′])/20 K) and intensities are quite different. The analysis of the lower temperature component of [G′2] shows that it has a common origin with the relaxation mode observed in [G′0]. The com-plexity of the relaxation modes indicates the existence of interactions with other dipolar species, most probably PdS. The substitution of a PdS core by a PdO core for g)0 shows that there is a significant interaction with this group. Indeed, TSC experiments indicate a low-temperature shift of ∼20 K of the very narrow mode. Considering the mobility and the polarity of the
alde-hyde groups, they might be responsible for the β
relaxation modes. To check this hypothesis, a compara-tive study of dendrimers without aldehyde end groups has been performed (in the case of the PdO core): the βmode does not exist. So, theβmode has been assigned to local movements of aldehyde end groups. The higher temperature component requires local order inherent with physical aging so that it has been associated with a structural relaxation.
Conclusion.Combined TSC and DDS studies allow us to follow the temperature and frequency dependence
of the β relaxation mode of phosphorus-containing
dendrimers. Dipolar nature of the relaxation modes has been shown. For [G′0], a narrow relaxation mode is observed: this is coherent with the existence of a single mobile dipolar species, i.e., aldehyde end groups. Those dipolar species interact with the PdS dipolar core. The relaxation mode found in [G′0] exists also in [G′1] and [G′2] in the same temperature range. The activation enthalpies remains of the same order of magnitude than for [G′0]. The slight modification of its characteristic parameters has been associated with differences in the interaction with PdS groups. An additional submode is also observed in [G′2] in the same temperature range: due to its metastability, it might be ascribed to a
Figure 3. (a) Global TSC spectra of [G′0],[G′1] and [G′2] (full
line). Experimental resolution of [G′2] (long-dashed line) (∆Tp g20 K). The small arrows indicate the polarization
temper-atures. (b) Global TSC spectra of [G′2] (full line) after thermal
treatment and global TSC spectra of [G′2] (long-dashed line)
before thermal treatment. The arrow indicates the polarization temperature.
Table 2. Temperature Dependence of the Maximum Current (im), the Pre-Exponential Factors (τ0), Activation
Enthalpy, and Activation Entropy (∆Hand∆S) of
Relaxation Times Associated with the Elementary Peaksfor g )0 Tm (K) (kJ‚∆molH-1) τ0 (s) (J‚mol∆-S1‚K-1) (10-im14A) 141 27.9 1.7×10⁻⁹ -70.8 1.13 143.15 31.8 1.5×10⁻¹⁰ -50.8 2.4 144 39.5 2.9×10⁻¹³ 11.3 3.6 146 41.4 5.7×10⁻¹⁴ 14.5 4.2
structural relaxation. In a near future, those analysis will be extended to the high-temperature range in order to analyze more delocalized molecular mobility. We also plan to investigate dendrimers of the same series corresponding to higher generations, to compare them with equivalent linear and hyper-branched phosphorus-containing macromolecules.
References and Notes
(1) Buhleier, E. W.; Wehner, W.; Vo¨gtle, F. Synthesis155 1978,
-158.
(2) Fischer, M.; Vo¨gtle, F. Angew. Chem., Int. Ed. Engl.1999, 38, 884-905.
(3) Lartigue, M. L.; Donnadieu, B.; Galliot, G.; Caminade, A.-M.; Majoral, J.-P.; Fayet, J.-P. Macromolecules1997, 30, 7335-7337.
(4) Majoral, J.-P.; Caminade, A.-M Topics in Current Chemistry; Springer-Verlag: Berlin and Heidelberg, Germany, 1998; Vol. 197, pp 79-124.
(5) Trahash, B.; Frey, H.; Lorenz, K.; Stu¨hn, B. Colloid. Polym. Sci.1999, 1186-1192.
(6) Hurve, S. A.; Appelhans, D.; Prigann, J.; Voit, B. I.; Kremer, F. Macromolecules2000, 33, 3762-3766.
(7) Emran, S. K.; Newkome, G. R.; Weis, C. D.; Harmon, J. P J. Polym. Sci., Part B1999, 37, 2025-2038.
(8) Trahasch, B.; Stu¨hn, B.; Frey, H.; Lorenz, K. Macromolecules
1999, 32, 1962-1966.
(9) Havriliak, S.; Negami, S. J. Polym. Sci., Part C99 1966, 14,
-117.
(10) Havriliak, S.; Negami, S. J. Polym.1967, 8, 161-210.
(11) Chatain, D.; Gautier, P.; Lacabanne, C. J. Polym. Sci., Phys. Ed.1973, 11, 1631-1640.
(12) Teysse`dre, G.; Lacabanne, C. J. Phys. D: Appl. Phys.1995, 28, 1478-1487.