HAL Id: hal-02762196
https://hal.inrae.fr/hal-02762196
Submitted on 4 Jun 2020HAL is a multi-disciplinary open access archive for the deposit and dissemination of sci-entific research documents, whether they are pub-lished or not. The documents may come from teaching and research institutions in France or abroad, or from public or private research centers.
L’archive ouverte pluridisciplinaire HAL, est destinée au dépôt et à la diffusion de documents scientifiques de niveau recherche, publiés ou non, émanant des établissements d’enseignement et de recherche français ou étrangers, des laboratoires publics ou privés.
The VENFOR project: response of a homogeneous
forest canopy to wind stress through the analysis of
accelerometer measurements
Fabienne Lohou, Alain Lopez, Aimé Druilhet, Yves Brunet, Mark Irvine, Eric
Lamaud
To cite this version:
Fabienne Lohou, Alain Lopez, Aimé Druilhet, Yves Brunet, Mark Irvine, et al.. The VENFOR project: response of a homogeneous forest canopy to wind stress through the analysis of accelerometer measurements. International Conference Wind Effects on Trees, Sep 2003, Karlsruhe, Germany. �hal-02762196�
International Conference ‘Wind Effects on Trees’
September 16-18, 2003, University of Karlsruhe, Germany
THE VENFOR PROJECT: RESPONSE OF A HOMOGENEOUS
FOREST CANOPY TO WIND STRESS THROUGH THE ANALYSIS OF
ACCELEROMETER MEASUREMENTS
F. Lohou1, A Lopez1, A. Druilhet1, Y. Brunet2, M. Irvine2 and E. Lamaud2
1. Laboratoire d’Aérologie, Toulouse, France; 2. INRA-Bioclimatologie, Bordeaux, France
Abstract
An experiment was performed in a homogeneous pine forest canopy in order to analyze the interactions between wind velocity and tree motion. Turbulence measurements were associated with two-dimensional measurements of tree motion. After a description of the experiment the simultaneous diurnal variations in wind velocity above and under the canopy are analyzed and related to stability conditions. The tree transfer function is then calculated, showing natural tree oscillation with a period of 5 s. A time-frequency analysis of tree motion is performed, showing that the tree oscillation is linked to the momentum flux.
Introduction
In order to understand wind and tree interactions, it is of primary importance to analyze how a tree dissipates the mechanical energy provided by the turbulent flow. During an experiment (Landes-99) performed in 1999 in an homogeneous pine forest canopy to study various transfer processes, two high-frequency accelerometers were set up on a tree trunk, as part of the VENFOR project. After looking at the simultaneous diurnal variations in wind velocity above and under the canopy, we focus on tree motion and analyze the tree transfer function and the natural tree oscillation frequency.
The Landes-99 Experiment
The main aim of the Landes-99 experiment was to study turbulent transfer processes at the interface between a homogeneous pine forest and the free atmosphere. The experiment was performed at the Bay site (see Brunet and Irvine 2000) in the Landes Forest, which is one of the largest flat forests in Europe, located in south-west France along the Atlantic Ocean coast.
The 20 m high canopy is made of three layers: an upper stratum between 16 and 20 m consisting in dense vegetation made up of branches and needles; an intermediate layer (between 1 and 16 m) with an alignment of trunks; an understorey made up of ferns and graminaceous plants.
The experiment lasted several months during which the experimental device changed. The study presented here relies on the analysis of data collected during the period from July 12 to August 19. Only the sensors used during this period are mentioned here. A 40 m high tower
was instrumented to measure the mean meteorological parameters (temperature, humidity, wind speed and direction, solar and net radiation) above the canopy. The turbulent dynamical (three wind components) and thermodynamical (temperature) parameters were provided by two ultrasonic anemometers set up at a height of 4 and 40 m. Two accelerometers normally used on aeronautical platforms were fixed at 6 m on a trunk representative of the tree population. These sensors were installed along the North and East directions, providing tree movement and inclination at frequencies up to 300 Hz. The turbulent data was sampled at 32 Hz and recorded at 4 Hz by averaging bins of eight samples.
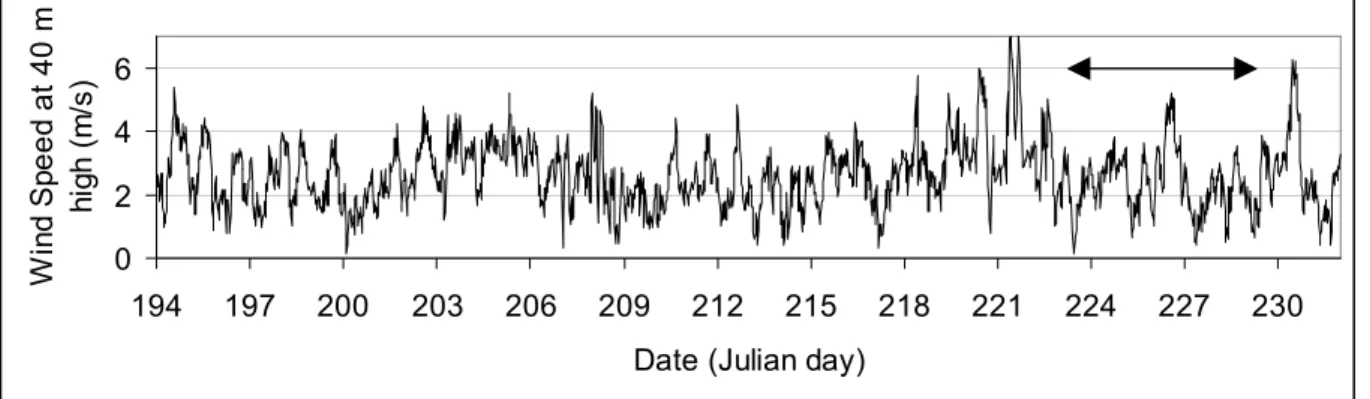
The dynamical conditions were relatively constant during this period and characterized by very low wind velocities. The wind speed measured at 40 m varies in average from 2 to 4 m s-1 (see Figure 1) and exceeds in a few cases 6 m s-1 (on Julian days 218, 220, 221, 226, 230). The following study focuses on the 223 – 228 Julian day period (August 11 to 16) during which a sun eclipse occurred (August 11).
0 2 4 6
194 197 200 203 206 209 212 215 218 221 224 227 230 Date (Julian day)
W in d S peed at 40 m hi gh ( m /s )
Fig. 1: Wind speed at 40 m measured during the 194 to 231 Julian day period (July 13 to August 19). The studied period is indicated by a horizontal arrow.
Mean Wind Above and Under the Canopy
Before looking at the effect of wind on tree displacement, we first consider the impact of the mean flow on the wind under the canopy and the canopy spectral transfer function.
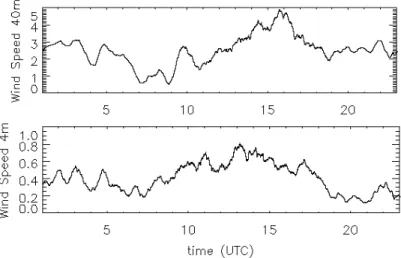
Figure 2 shows the diurnal evolution of the wind speed measured at 4 and 40 m on August 16. A 30 min running average was applied to the turbulent functions. This day is characterized by weak wind above the canopy reaching 5 m s-1 at 04:00 pm, whereas the wind speed under the canopy does not exceed 0.8 m s-1.
In order to highlight the phase difference in wind speed at the two levels, parametric curves are plotted in Figures 3a and 3b with a 30 min and 2 h running averages, respectively. Figure 3b shows a phase difference between the wind speeds at the two levels since the curve exhibits a loop. During the three time periods 00:00-06:00 am, 08:00 am-16:00 pm and 18:00-20.00 pm, the two winds are well correlated with respectively a simultaneous decrease, increase and decrease again of the wind speed at the two levels, respectively. However, wind velocities are anti-correlated during the sunrise and sunset periods when stability conditions are changing. While wind speed decreases at 40 m, it increases under the canopy between 06:00 and 08:00 am, and inversely between 04:00 and 06:00 pm. The parametric curve plotted in Figure 3a shows a similar shape, but the running average over
30 min emphasizes other phase differences indicated by several secondary loops. These loops have time scales ranging between 30 min and 2 h.
Fig. 2: Wind speed at 40 and 4 m measured on August 16. A 30 min running average is used.
Fig. 3: Parametric curves of wind speed under the canopy against wind speed above it (August 16). The running temporal average is operated over 30 minutes (a) and over 2 hours (b). The colour code
refers to time (UTC).
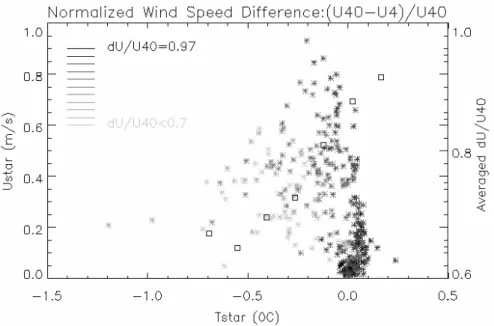
As already mentioned, the relation between wind velocities above and under the canopy is likely to be related to stability conditions. An analysis of the wind speed difference, normalized by the wind at 40 m, is presented in Figure 4. This graph displays data from six Landes-99 days, from August 11 to 16. Dynamical and thermal stability is quantified by the surface characteristic scales for wind speed (U*) and temperature (T*). The colour code shows the normalized wind speed difference. It essentially depends on the thermal stability with high values for neutral conditions (T* ≥ 0) and low ones for large thermal instability (T* < -0.5). The averaged value of the normalized wind speed difference (open squares) decreases linearly with increasing thermal instability from 0.92 to 0.65. This means that in stable and neutral conditions the wind under the canopy is negligible compared to the wind speed above. Moreover, the variation in the normalized difference only depends on thermal
stability. In the most unstable thermal conditions, the wind speed under the canopy never exceeds 35 % of the wind above.
Fig. 4: Difference between wind velocities above (40 m) and under (4 m) the canopy, normalized by the wind velocity above (40 m), plotted against the surface layer scales U* and T*. Mean values of the
normalized wind speed difference are indicated by open squares and represented against T* (Y-axis on the right).
Spectral Analysis: Canopy Transfer Function on August 16
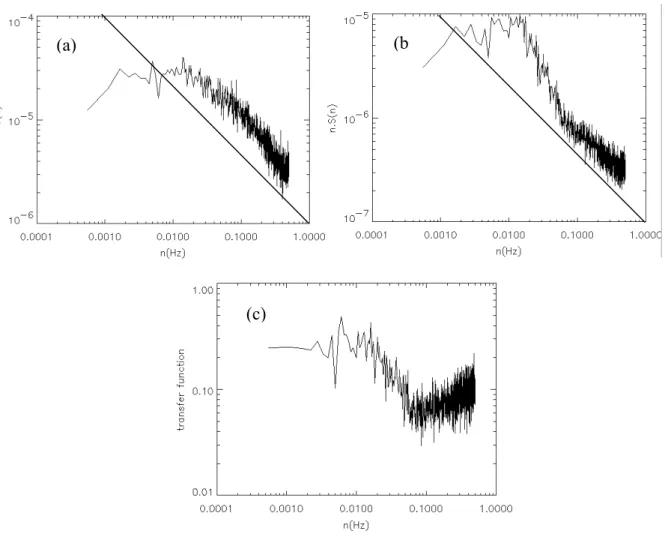
Power spectra of wind speed at 40 m and 4 m are inferred by averaging the 48 energy spectra calculated over 30 min samples on August 16 (Figure 5). The 40 m spectrum (Figure 5a) has a classical shape with an energy domain production centered on 0.01 Hz and an inertial subrange with a –2/3 slope. The wind speed under the canopy has an energy spectrum (Figure 5b) characterized by a very energetic production domain with an inertial subrange with a –6/3 slope up to 0.06 Hz. Beyond this frequency the inertial subrange recovers his usual slope of –2/3. This peculiar shape of the energy spectrum has already been observed in wind tunnels (Seginer et al 1976; Raupach et al 1986) and in natural plantation (Gardiner 1995). Finnigan 2000 discusses this phenomenon with a schematic representation showing an extra amount of energy at the end of the inertial subrange at high wavenumbers. The sampling frequency was not high enough during the Landes-99 campaign to resolve this extra amount. The input of energy at energy-containing wavenumbers is associated to the inflection point instability process that removes energy from the mean flow and injects it into coherent eddies. A second spectrum anomaly, not visible here, is due to the direct conversion of eddy energy into fine-scale turbulence in the wakes of canopy elements.
Figure 5c shows the transfer function of the canopy, relative to wind speed, calculated as the ratio of the spectral power of the wind under the canopy to its counterpart above. Whereas the wind energy is transferred from the mean flow with an efficiency of 0.08 for the inertial subrange, the canopy efficiency is four times higher for the energy containing wavenumbers. This result illustrates the same dynamical process previously commented, concerning the shear energy production associated to the inflection point in the mean velocity profile.
(c)
(c)
(a)
(b
Fig. 5: Mean power spectra of wind speed above (a) and under (b) the canopy on August 16. Transfer function for the canopy (c).
Wind Effect on Trees: Tree Transfer Function on August 16
The spectral analysis of the accelerometer signals is based on the same method used for the wind speed in the previous section. The energy spectrum (Figure 6a) results from averaging 48 spectra calculated over 30 min samples. A maximum of energy, centered at 0.2 Hz, clearly appears. This maximum reflects tree oscillation with a period of about 5 s. The tree transfer function quantifying the tree spectral response to the mean flow constraint appears constant throughout the whole wavenumber range, except for the peak associated with the natural tree oscillation.
Figure 7 shows signals from both accelerometers during 300 s when the tree oscillates. The oscillation is continuous but its amplitude varies most of the time with an exponential decrease associated with a 1 min time scale.
(a)
(b)
Fig. 6: Mean power spectra of accelerometer signal (a) and tree transfer function above the canopy (b).
Fig. 7 : 300 s samples of the two accelerometer functions during tree oscillation.
Wind Effect on Trees: Natural Tree Oscillation Frequency
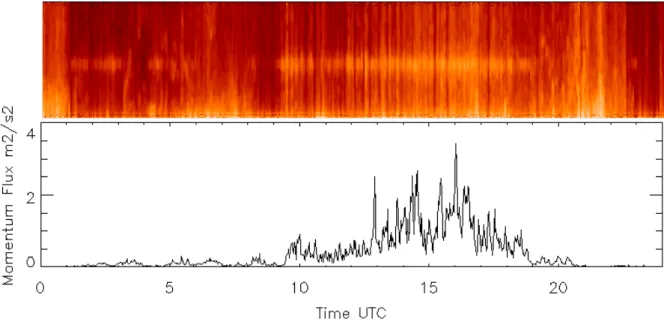
We now focus on the natural tree oscillation, its appearance and its energy during the day. Running spectra over 5 min samples, with a 1 min time lag, have been calculated for August 16 (Figure 8) and 11 (Figure 9). The energy spectra are presented against both frequency (from 0.03 Hz to 0.5 Hz) and time along the Y-axis and X-axis, respectively. The simultaneous momentum flux above the canopy is shown in the lower part of the figures. The energy of the natural tree oscillation clearly appears as a white band centered around 0.2 Hz. On August 16 it is continuous between 09:00 am and 07:00 pm, when the momentum flux is large. The oscillation also appears during the night between 01:00 and 03:00 and around 04:30. Some vertical dark lines regularly appear during the day, implying a decrease in energy over the whole frequency range.
Fig. 8: Time variation in the mean power spectra of the accelerometer signal and the momentum flux at 40 m, on August 16. Each spectrum is calculated over 5 min samples.
Fig. 9: Same as Figure 8 for August 11 (sun eclipse).
On August 11 the natural tree oscillation starts at 08:00 am but rapidly stops at the onset of the sun eclipse, during which the momentum flux is close to zero. The tree oscillation appears again around 11:00 am but the associated energy as well as the momentum flux are lower than those measured at the same time on August 16.
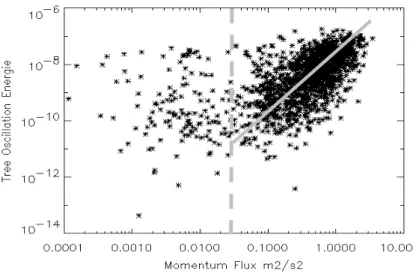
The extra energy due to tree oscillation was calculated for each energy spectrum and plotted against the momentum flux above the forest, over six days of the Landes-99 experiment (Figure 10). Both parameters are calculated over 5 min samples. The extra energy of the accelerometer energy spectrum at 0.2 Hz varies from 10-12 to 10-7 throughout the range of momentum flux. This shows the existence of energetic tree oscillation motions even when the momentum flux is weak, for example during the night on August 16. For small values of the momentum flux there does not seem to be any relation but above 0.03 m2s-2
(u* = 0.17 m s-1), corresponding to daytime conditions, the extra energy and the momentum flux are well correlated.
Fig. 10: Tree oscillation energy and momentum flux above the canopy for 6 days of the Landes-99 experiment.
Conclusion
These first results provide valuable information on wind and tree interactions. The analysis will be extended to the horizontal, two-dimensional motions of the tree trunk in relation to the three-dimensional wind. The data already collected provide validation data for the dynamical biomechanical model for tree motion that is currently developed in the course of Venfor (see companion papers by Brunet et al and Sellier et al). Additional measurements will be performed at the same site in autumn 2003, with more ultrasonic anemometers (vertical profile) and accelerometers.
Acknowledgements
The GIP Ecofor is gratefully acknowledged for supporting the Venfor project. References
Brunet, Y., Irvine, M.R., 2000: "The control of coherent eddies in vegetation canopies: streamwise structure spacing, canopy shear scale and atmospheric stability", Boundary Layer Meteorology, 94, pp. 139-163.
Finnigan, J.J., 2000: "Turbulence in Plant Canopy". Annu. Rev. Fluid Mech., 32, pp. 519-571.
Gardiner, BA., 1995: "The interactions of wind and tree movement in forest canopies", in Wind and Trees (M.P. Coutts and J. Grace, Eds.), Cambridge University Press, pp. 41-59.
Raupach, M.R., Coppin, P.A, Legg, B.J., 1986: "Experiments on scalar dispersion within a model plant canopy. Part I: The turbulent structure", Boundary Layer Meteorology, 35, pp. 21-52.
Seginer, I., Mulhearn, P.J., Bradley, E.F., Finnigan, J.J. 1976: "Turbulent flow in a model plant canopy", Boundary Layer Meteorology, 10, pp. 423-530.