HAL Id: hal-00330845
https://hal.archives-ouvertes.fr/hal-00330845
Submitted on 1 Jan 2003HAL is a multi-disciplinary open access archive for the deposit and dissemination of sci-entific research documents, whether they are pub-lished or not. The documents may come from teaching and research institutions in France or abroad, or from public or private research centers.
L’archive ouverte pluridisciplinaire HAL, est destinée au dépôt et à la diffusion de documents scientifiques de niveau recherche, publiés ou non, émanant des établissements d’enseignement et de recherche français ou étrangers, des laboratoires publics ou privés.
riparian wetland zone of the Garonne, SW France:
nitrate inputs, bacterial densities, organic matter supply
and denitrification measurements
J. M. Sánchez-Pérez, P. Vervier, F. Garabétian, Stéphane Sauvage, M.
Loubet, J. L. Rols, T. Bariac, Philippe Weng
To cite this version:
J. M. Sánchez-Pérez, P. Vervier, F. Garabétian, Stéphane Sauvage, M. Loubet, et al.. Nitrogen dynam-ics in the shallow groundwater of a riparian wetland zone of the Garonne, SW France: nitrate inputs, bacterial densities, organic matter supply and denitrification measurements. Hydrology and Earth System Sciences Discussions, European Geosciences Union, 2003, 7 (1), pp.97-107. �hal-00330845�
Nitrogen dynamics in the shallow groundwater of a riparian
wetland zone of the Garonne, SW France: nitrate inputs, bacterial
densities, organic matter supply and denitrification measurements
J.M. Sánchez-Pérez
1, P. Vervier
1, F. Garabétian
1, S. Sauvage
1, M. Loubet
2, J.L. Rols
1, T. Bariac
3,
P. Weng
41Laboratoire d’Ecologie des Hydrosystèmes (LEH, FRE CNRS-UPS 2630), 29 rue Jeanne Marvig, F-31055 Toulouse Cédex, France 2Laboratoire de Mécanique des Transferts en Géologie (LMTG, UMR 5563 CNRS/UPS) 38 rue des trente-six ponts, 31000 Toulouse, France 3Laboratoire de Biogéochimie Isotopique (UMR 7618 CNRS-UPMC-INRA), Case 120 - 4, Place Jussieu, 75252 Paris, France
4BRGM Service EAU / RMD, 1039 rue de Pinville, F-34000 Montpellier, France
Email for corresponding author: sanchez@ecolog.cnrs.fr
Abstract
This study highlights the role of interactions between surface and sub-surface water of the riparian zone of a large river (the Garonne, SW France). Information is given about the role of surface water in supplying Dissolved Organic Carbon (DOC ) to the riparian zone for nitrate
removal processes. The densities of bacteria (up to 3.3106 cell m L-1) in groundwater are strongly conditioned by the water moving during
flood events. Total bacterial densities in groundwater were related to surface water bacterial densities. In sediment, total bacteria are attached mainly to fine particles (90 % in the fraction < 1 mm). Spatial variations in organic carbon and nitrate content in groundwater at the site studied are correlated with exchanges between the groundwater and the river, from the upstream to the downstream part of the meander. Total bacterial densities, nitrate and decressing organic carbon concentrations follow the same pattern. These results suggest that, in this kind of riparian wetland, nitrate from alluvial groundwater influenced by agricultural practices may be denitrified by bacteria in the presence of organic carbon from river surface water.
Key words: riparian zone, nitrate removal, spatial variations, alluvial groundwater
Introduction
Floodplains control large exchanges of nutrients and organic matter between aquatic and terrestrial ecosystems (Swanson et al. 1982, Peterson and Rolfe 1982, Brinson et al. 1983, 1984). These wetland areas limit the transfer of nutrients from groundwater to river water and play a major role in regulating nitrate of agricultural origin (Peterjohn and Correll, 1984; Pinay and Décamps, 1988; Cooper, 1990; Correll et al., 1992; Pérez et al., 1991a, b; Sánchez-Pérez and Trémolières, 1996, 1997).
Several studies have focused on the processes influencing nutrient retention or elimination from riparian systems. In wetland soils receiving large amounts of nitrogen, denitrification appears to be the most important process for the elimination of nitrate (Lowrance et al. 1984; Groffman and Tiedje, 1989; Zak and Grigal 1991, Haycock and Burt
1993; Cooper, 1990; Pinay et al., 1995). Denitrification capacities vary between 20 and 1600 kg N ha-1 year-1 (Brüsch
and Nilsson 1993). However, uptake by root-absorption or immobilization in soils also removes nitrate from groundwater and soils (Sánchez-Pérez et al. 1991a; Groffman et al. 1992). The role of vegetation in the protection of groundwater quality was demonstrated by Sánchez-Pérez et al. (1991b) in relation to seasonal changes and stages of vegetation of the alluvial forest succession. The reduction of phosphorus concentrations in groundwater by riparian forests has usually been attributed to root absorption (Sánchez-Pérez et al. 1991a), chemical precipitation and adsorption processes (Reddy and Rao 1983; Patrick 1990). Some other studies have documented the effects of factors as well as the interactions which regulate the transfer of nutrients to groundwater, for example
geomorphology (Pinay et al. 1995), catchment hydrology (Cooper 1990) and vegetation type (Takatert et al., 1999; Sánchez-Pérez and Trémolières, in press).
For large alluvial rivers, the origin of the organic matter that fuels the denitrification process is vegetation (Pinay and Décamps, 1988). Organic matter reaches porous aquifers by vertical fluctuations of groundwater level. For large alluvial rivers with a relatively permeable porous aquifer, horizontal fluxes are high even at low water periods when vertical fluctuations are low. For this situation, organic matter must originate from sources other than riparian leaf litter. The goal of this paper is to show the role of surface– subsurface water interactions on denitrification processes within the riparian zone of a large alluvial river.
Study site
The site studied which represents a surface area of 50 ha, is a riparian zone of 14 km2 located within a meander of the
Garonne river close to Monbequi village, 50 km north of Toulouse city in France (Fig. 1).
Because the focus is on the active hydrological zone due to the influence of the river hydrological conditions, the site is in a meander in the first 250 metres of the wetland.
The flow of the river is very variable (for a basin of 9 980 km2) at Toulouse: the highest discharge was 7000 m3s–1 (in
1875) and the lowest discharge was 40 m3s–1 and occurs
from August to September. The annual mean discharge is over 200 m3s–1 at Toulouse.
Maximal discharges of the river occur twice a year, during the spring as a result of snowmelt in the Pyrenees and again in late autumn following rainfall. The low water period generally lasts from August until October. Mean annual precipitation in the region is 660 mm and most precipitation occurs from April to October. Agriculture is the dominant land use is this part of the catchment.
Downstream of Toulouse, the Garonne river flows over coarse alluvium (sand and gravel) eroded from the Pyrenees Mountains during the past glacial periods and deposited in the floodplain. This coarse sediment is generally only 6 m thick, and rests on impermeable and indurate marl.
Throughout the floodplain, the groundwater flow is driven by (a) a longitudinal component governed by the slope of the valley (1:1000), and (b) a transverse compartment determined by groundwater levels in floodplain terraces and changes in the water level of the Garonne river. The relations between groundwater and the river are controlled by the geomorphology of the site. Almost all of the floodplain is
farmed. Fertilisation and irrigation sustain high production of corn, sunflower, sorghum, and fruit, but also generate high nitrogen inputs to groundwater. Hence, nitrate concentrations exceed 50 mg.NO3- L-1 in most aquifers.
The common riparian vegetation along this reach of the Garonne river is dominated by oak, ash and poplar plantations.
Material and methods
The site was equipped in 1994 with 20 piezometers located near the Garonne bank. The piezometer system was completed in 1999 by a further 27 piezometers. At the same time, 32 soundings showed that the total thickness of alluvium is spatially very heterogeneous. The alluvium ranges from between 2.5 to 7.5 m thick, with an arithmetic mean of 5.7 m. The piezometers were installed using a truck-mounted pneumatic hammer. They were screened over their entire length and penetrated to the underlying marl.
Groundwater level was measured at each water sampling. In eight piezometers, groundwater levels were recorded continuously using an Orphimedes system (OTT). In the Garonne river, the Verdun gauging station is located 3 km upstream of the study site.
WATER SAMPLING AND CHEMICAL ANALYSIS Samples were collected from each piezometer at the top of the water level after pumping. At the same time, one surface water sample was taken.
Groundwater samples were collected from all piezometers on 15-16/02/2000, 29-30/02/2000 and 21-22/01/2002 for chemical analyses (50 samples). The results of the three campaigns were similar so only the data from the campaign 29-30/02/2002 were used for the spatial plots. For bacterial analyses of both surface and groundwater, 13 piezometers and the Garonne river were sampled during different hydrological conditions from December 2000 to March 2001 (eight sampling days with a total of 28 water samplings and 18 sediment samplings).
Dissolved oxygen, temperature, pH, redox potential and electrical conductivity were measured using a specific probe (WTW Multiline P4). Redox potential measurements were made using platinum electrodes against Ag/AgCl-reference electrodes. Redox potentials were corrected for the Ag/ AgCl-reference electrodes by adding 217 mV for the field (for an average temperature of 10° C) as indicated by the manufacturer (Ingold GmbH, Frankfurt). The Eh measurements for pH were not corrected as suggested by Patrick et al. (1996). Water samples were collected in glass bottles and filtered through glass fibre filters (Whatman
GFF) for nitrate measurement. Nitrate (NO3--N) and
chloride (Cl-) were analysed by ion chromatography using
a DIONEX system. Water samples collected for dissolved organic carbon (DOC) were filtered using precombusted GFF filters (450°C for 4 h) and analysed using a platinum catalyser at 650°C (Shimadzu, Model TOC 5000).
Oxygen-isotope composition was measured by isotope ratio mass spectrometry after CO2 - H2O equilibration using the Epstein and Mayeda technique (1953). Results were expressed relative to a standard (V-SMOW, Gonfiantini, 1978) using delta notation (δ) where δ18O is given by :
-R = O 18 18 18 18 SMOW V SMOW V sample O R O R O − − δ where R18O
sample and R18OV-SMOW are the 18O/16O ratios for the
sample and V-SMOW, respectively. As the difference between samples and standard is small, the “δ-value” is usually expressed in parts per 1000.
ENUMERATION OF BACTERIA
Within 4 h of sample collection in a sterile vial, samples were sonicated (10 minutes with an ultrasonic cleaner ELMA model Transonic 460–35kHz) and aliquoted for total bacterial counts (storage of preserved sample with formalin at 4% final concentration) or for numeration of NH4+-oxidising bacteria by the most probable number
(MPN) method.
Total counts: counts were performed according to Porter and Feig (1980) using DAPI (4',6-diamidino-2-phenylindole) with a protocol described by Garabétian et al. (1999).
NH4+-oxidizing bacteria: inoculation and serial tenfold dilutions (50 µL per well) of 96 well microplates filled with 450 µL of NH4+ oxidiser enrichment medium (Schmidt and
Belser, 1994) were conducted for each sample allowing eight replicates, until a 1010 final dilution. Incubations were
performed at 28°C, in the dark, for more than eight weeks. Positive wells were assessed by nitrite concentration using Griess reagent ; according to the statistical method of McGrady (1915), the MPN of nitrifying bacteria per mL of sample was determined from computed scores according to Clarke and Owens (1983).
DENITRIFICATION MEASUREMENT
Denitrification rates in groundwater were measured in situ with a packer system using the acetylene block method (Sánchez-Pérez et al., 2003): bromide was used as a tracer of dilution and acetylene (10%) was used to block the
denitrification process at the nitrous oxide stage. During the test, dissolved oxygen, nitrate (NO3–), bromide (Br–),
nitrous oxide (N2O) and dissolved organic carbon (DOC) were measured.
Measurements were made from February to June 2002, in two piezometers in the riparian zone, two in the poplar plantation and two in agricultural land under two hydrological conditions : low water during the period from February to April with a river monthly mean discharge lower than 200 m3 s-1 without flood, and high water in May and
June with a river monthly mean discharge greater than 300 m3 s–1 with two floods (one flood up to 1700 m3 s–1 which
corresponds to a biennial flood). CARTOGRAPHY
To examine the evolution of the nitrogen transformations, the simple mixing of the river and aquifer waters was established using conservative elements: δ 18O and Cl–. The
mixing ratios of river and groundwater in each piezometer were calculated using Cl– concentrations in a 2-end-member
mixing model. The untransformed concentration transported in the groundwater was then calculated using this mixing model (δ 18O and Cl– were correlated, indicating the value
of a two-component mixing model). The difference between expected and measured concentrations must result from biological (for non-conservative concentrations) processes. Geochemical maps of the distribution of the differences between expected and measured concentrations were made for each concentration of nitrate, dissolved organic carbon and oxygen using kriging methods of extrapolation (Surfer software).
HYDROGEOLOGICAL MODELLING
A finite element groundwater flow model is used to identify the water fluxes in the groundwater and in the rivers. The hydrogeological modelling of the water fluxes of the area was performed with the MARTHE software package developed by BRGM (Thiery, 1990, 1993). MARTHE is a finite-difference hydrodynamic package that processes three-dimensional flow in both saturated and unsaturated environments.
Groundwater modelling is made for a surface of 12 km2
(Fig. 2). The mesh size is 100 m for the area outside the meander and 25 m in the meander. The average thickness of the aquifer in this section is 3.5 m. The hydraulic-conductivity values assigned to each mesh are derived from values measured on site during pumping tests and slug tests: the values thus obtained vary from 10-2 to 10-5 m s-1.
The hydraulic-conductivity values were used in the automatic calibration by employing the inverse method,
mesh by mesh and in steady state, to simulate the hydraulic heads measured in the field for an average and stable Garonne flow rate of 200 m3 s–1. The zoning thus obtained
reflects the geomorphological units observed in the field. Efficient-porosity values assigned to the meshes vary from 5 to 15% and were distributed according to previously identified hydraulic-conductivity units and on pumping tests when available.
The groundwater fluxes in the meander were represented in the Fig. 2c. Detailed results of the groundwater modelling are presented in Weng et al. (in press).
STATISTICAL METHODS
Analysis of Variance (ANOVA) was chosen to test for differences between the different hydrological conditions. Differences were considered significant at p < 0.05. Statistical calculations were made using the MINITAB computer package (Minitab Inc., USA).
Results
PHYSICO-CHEMICAL DATA
These data are presented in Table 1. Mean nitrate-nitrogen concentrations increased from river to agricultural land with values of 12.7 mg L–1 of N-NO
3– in surface water, 29.8 of
N-NO3– in gravel banks, 37.4 of N-NO 3
– in poplar
plantations, 53.2 of N-NO3– in the riparian zone and 60.4 of
N-NO3– in agricultural land. Mean concentrations in DOC
decrease from the river (2.61 mg L–1) to agricultural land (0.58
mg L–1). Mean concentrations of dissolved oxygen decrease
from the river (10.2 mg L–1) to riparian zone (4.2 mg L–1)
and increase from riparian zone to agricultural zone (6.4 mg L–1). Concentrations of Cl– increase from river to
agricultural lands.
SPATIAL PATTERNS OF NITRATE AND DOC
The biogeochemical functioning of the wetland is linked closely to the hydrological conditions. The hydrogeological model of Weng et al. (in press) was used to determine groundwater circulation and the water exchanges between the river and the groundwater in different hydrological conditions. The formation of bypasses between the upstream and downstream parts of meanders (Fig. 2) shows that meanders favour exchanges between the river and the alluvial aquifer.
Under stationary hydrological conditions, the water in the wetland circulates in the same direction as the river and groundwater. During a flood, the water flux from the river exceeds that from the groundwater.
Table 1.
Physico-chemical data from the samples taken in April 2002. DO = dissolved oxygen, EC = Electrical conductivity
. Substrate lev
els were the depth of the
substrate from the soil surface. W
ater levels were measured in the NGF system.
Site X Y Substrate W ater pH Temp EC DO DO Eh C l -N-NO 3 -DOC δ 18O Lambert Lambert level level (°C) (mS (mg l -1) (%) (mV) (mg l -1) (mg l -1) (mg l -1) (‰) (m) (m) cm -1) (m) G ARONNE RIVER G1 509417.1 177922.0 -87.91 7.94 11.2 354 10.0 94.5 556 13.1 11.7 2.43 -8.1 G3 509222.0 177883.0 -86.09 7.82 11.2 371 10.3 95.0 498 16.4 12.5 2.59 -8.1 Mean -7.88 1.05 337 1.02 94.8 527 14.6 12.7 2.61 –8.2 G R A VEL BANK BG 1 509191.3 177640.9 -86.63 7.15 10.0 558 11.3 10.4 394 15.6 5.4 2.20 -7.8 BG9 509232.1 177688.4 -7.00 10.9 599 2.9 26.5 396 20.2 3.6 1.78 -8.0 BG10 509225.8 177704.0 -86.55 7.06 11.0 500 9.5 87.7 415 16.4 18.0 1.83 -8.7 BG14t 509369.5 177790.3 -86.47 -11.0 960 -59.1 73.3 1.66 -7.0 BG16 509341.5 177818.6 -86.51 -10.0 903 -54.2 74.8 1.64 -6.8 B G17b 509285.8 177833.1 -86.44 -10.0 766 -35.5 30.6 2.53 -7.8 B G18n 509259.0 177861.1 -10.0 717 -29.4 29.3 2.55 -7.9 P6 509146.3 177557.1 4.6 86.84 6.93 11.4 443 2.1 19.6 165 16.7 3.7 1.20 -8.2 Mean -7.04 10.5 715 6.4 36.0 343 30.9 29.8 1.92 -7.8 P OPLAR PLANT A TION P1 509088.6 177145.4 6.3 86.95 6.90 10.9 418 7.2 66.0 321 16.1 17.3 1.65 -8.4 P2 509146.8 177304.8 6.6 86.97 6.68 13.4 573 7.5 73.5 261 17.5 14.8 0.58 -8.2 P3 509215.7 177263.7 5.6 86.89 6.83 13.3 626 5.3 51.4 357 23.5 14.4 0.57 -8.2 P4 509236.2 177136.6 6.6 87.03 6.78 13.9 617 3.7 35.5 295 18.1 7.4 0.53 -8.3 P5 509313.2 177258.2 4.9 86.93 6.67 13.4 946 4.0 38.0 299 55.1 32.4 0.77 -7.3 P7 509276.3 177370.4 5.5 86.88 6.62 12.8 1052 3.6 33.6 292 66.6 18.5 0.91 -7.4 P8 509342.6 177313.7 4.3 86.91 6.63 13.3 947 6.2 59.6 334 58.0 50.9 0.49 -7.2 P10 509302.8 177466.5 5.6 86.79 6.60 13.7 1029 4.5 43.1 323 66.2 55.6 0.62 -6.9 P1 1 509409.2 177584.2 7.7 86.70 6.72 13.2 1022 7.8 74.6 367 72.0 70.7 0.65 -6.7 P14 509409.5 177826.4 3.7 86.29 6.65 12.5 1209 0.6 5.5 440 67.2 121.0 1.31 -6.8 P15 509379.5 177790.5 4.4 86.42 6.71 12.8 1042 4.5 43.3 366 63.0 82.0 1.23 -6.9 P16 509514.1 177906.5 6.3 86.33 6.70 13.9 1027 7.4 73.3 373 73.6 73.9 0.87 -7.2 P17 509260.0 177024.0 6.7 87.06 6.96 14.1 475 4.1 40.1 273 14.1 3.7 1.32 -8.3 P18 509380.7 177023.1 7.4 87.09 6.74 13.5 444 3.4 33.0 316 15.7 5.2 0.63 -8.3 P19 509558.8 176970.2 6.8 87.58 6.68 13.4 390 6.7 64.8 352 14.2 10.2 0.70 -7.7 P20 509571.2 177076.3 6.0 87.03 6.65 14.1 779 4.8 47.1 313 37.5 20.8 0.89 -7.8 Mean 6.72 13.3 787 5.1 48.9 330 42.4 37.4 0.86 -7.6
Table 1 (Contd.).
Physico-chemical data from the samples taken in April 2002. DO = dissolved oxygen, EC = Electrical conductivity
. Substrate lev
els were the
depth of the substrate from the soil surface. W
ater levels were measured in the NGF system.
Site X Y Substrate W ater pH Temp EC DO DO Eh C l -N-NO 3 -COD δ 18O Lambert Lambert water level °C) (mS (mg l -1) (%) (mV) (mg l -1) (mg l -1) (mg l -1) (‰) level (m) cm -1) (m) R IP ARIAN ZONE P9 509214.6 177568.6 5.1 86.74 6.80 11.8 804 2.8 26.6 319 28.4 44.6 1.83 -7.5 P13 509315.1 177731.3 2.8 86.48 6.80 12.9 1289 2.6 24.8 242 94.9 40.3 2.00 -6.9 RI - 1 509199.3 177542.9 -87.57 6.78 12.3 766 2.1 20.5 308 28.2 27.6 1.15 -7.8 RI - 2 509299.0 177680.7 -87.32 6.80 11.8 865 5.2 49.5 306 59.3 97.5 1.45 -6.7 RI - 59 509282.5 177634.5 -87.43 6.79 12.7 870 5.0 48.3 455 60.4 78.1 1.01 -7.0 RI - 60 509264.5 177608.2 -87.54 6.89 12.0 737 7.7 71.8 363 56.1 62.2 0.97 -7.3 RI - 63 509231.0 177594.0 -87.47 6.81 11.9 800 3.9 36.3 333 39.0 42.3 0.33 -7.8 RI - 64 509224.0 177608.2 -87.20 6.84 11.8 776 3.7 35.5 332 26.7 42.0 1.61 -7.8 RI - 65 509220.0 177623.1 -87.35 6.85 11.6 735 2.3 21.2 323 37.5 17.6 1.92 -7.9 RI - 66 509241.7 177618.5 -87.54 6.88 11.7 730 5.2 48.3 310 35.9 44.6 1.61 -7.7 RI - 68 509273.3 177650.9 -87.43 6.73 12.8 890 6.0 57.0 289 54.4 88.1 1.55 -7.0 Mean -6.82 12.1 842 4.2 40.0 326 47.3 53.2 1.40 -7.4 AGRICUL TURAL ZONE P21 509922.2 177913.1 7.2 6.87 13.2 1037 6.8 66.8 510 77.6 76.4 0.57 -6.6 P22 509529.5 177529.4 5.0 86.94 6.79 12.3 1012 3.9 37.5 455 66.3 59.5 0.77 -6.9 P23 509970.0 178700.0 5.7 86.31 6.69 12.6 1100 1.3 12.6 398 76.3 48.6 0.70 -6.7 P24 510319.9 177973.2 6.2 6.94 11.9 956 7.8 73.3 521 65.0 57.0 0.56 -7.0 P26 510348.6 177258.3 5.1 88.33 6.86 11.9 928 8.0 75.8 415 75.9 82.0 0.53 -7.0 P28 510271.4 176572.9 7.6 88.28 6.70 13.5 980 6.4 62.2 405 75.2 58.5 0.51 -6.9 P30 51 1545.0 176384.7 7.1 89.83 6.91 13.1 864 7.6 80.0 400 56.0 45.1 0.56 -7.1 P31 51 1036.8 177273.2 7.1 6.96 12.6 919 7.7 74.1 523 66.3 63.3 0.56 -7.0 P32 510050.1 176873.5 6.5 88.01 6.78 13.2 933 8.5 82.3 336 63.9 53.7 0.48 -7.1 Mean -6.83 12.7 970 6.4 62.7 440 69.2 60.4 0.58 -6.9
Fig. 2. Hydrogeological model: Mesh of the model with topographic
map (a), cross section of the alluvial aquifer (b) and groundwater flow patterns for the mean annual river flow equal to 200 m3 s-1 (c).
Fig. 3. Cl- – δ 18O plot for the surface and groundwater samples.
Figure 3 shows the distribution of the water sampled in a δ18O–Cl– plot. All samples were distributed along a line
plotted between the surface water and the groundwater in the agricultural land. Figure 4 represents the percentage of the Garonne river water in each piezometer calculated by this mixing model; the distribution of surface water in groundwater was controlled by the geomorphology of the meander. The percentage of river water in groundwater, nearly 100 % at the entrance of the meander, decreases in the direction of groundwater flow to 0 %.
Figure 5 represents the variation rate of nitrate and DOC in the site after deduction of the river dilution rate. These variations are probably due to biological processes. Production of nitrate corresponds to dark zones and loss of nitrate corresponds to the white zone.
BACTERIAL DENSITIES IN GROUNDWATER
The bacterial densities in groundwater were conditioned strongly by the hydrological functioning of the zone (Table 2): the densities of total bacteria in groundwater rise significatively (p < 0.05) to 2.22 106 cell mL–1 at high water
and 0.39 106 cell m L–1 at low water. Total bacterial densities
in groundwater proved to be related to surface water bacterial numbers. The same pattern was observed for nitrifying bacteria (1.32 105 cell mL–1 at high water and 2.16
103 cell m L–1 at low water).
Conversely, numbers of bacteria associated with sediment remained stable in relation to hydrological conditions:
0.88 109 cell g-1 during high flow and 0.68 109 cell g–1 during
low flow (not statistically different at the 0.05 level). Moreover, in sediment, total bacteria are attached primarily to fine particles (90% in the fraction < 1 mm).
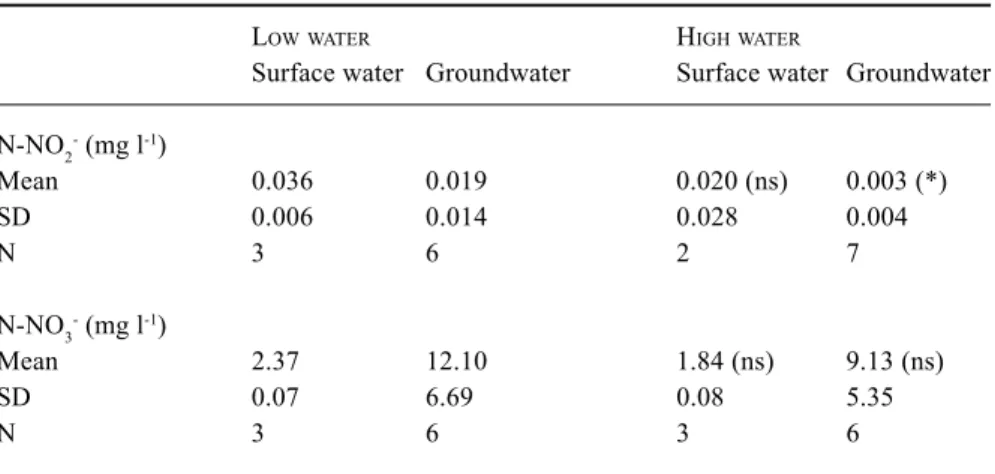
The nitrate-nitrogen concentrations measured in the same piezometers as the bacterial densities show a mean N-NO3–
concentration of 12.1 mg L–1 during low water and 9.13 mg
L–1 during high water. The nitrite-nitrogen concentrations
decrease from 0.019 mg L–1 during low water to 0.003 mg
L–1 during high waters (Table 3).
DENITRIFICATION MEASUREMENTS
Denitrification rate rises significatively (p < 0.05) at high water: 0.37 to 0.73 g N-NO3– L–1 h–1 in the riparian zone
and 0.08 to 0.76 g N-NO3– L–1 h–1 in the poplar plantation
zone. In agricultural land, the denitrification rate is lower than in the two other zones and any change with hydrology is not statistically significant: (p > 0.05) 0.02 to 0.04 g N-NO3– L–1 h–1 (Table 4).
Fig. 5. Spatial distribution of the rate of NO3- and DOC (Dissolved Organic Carbon) calculated by the two poles mixing model. Rate is
represented in % = 100 * (Measured – Calculated / Measured).
Fig. 4. Percentage of surface water in groundwater at the meander
Table 2. Total (DAPI) and nitrifying (MPN) bacteria in surface water, groundwater and sediments from two hydrological conditions.SD = standard deviation. (*) statistical significant at 0.05 level for the comparison Low water – high water. (ns) not significant statistically.
LOWWATER HIGHWATER
Surface water Groundwater Sediment Surface water Groundwater Sediment
(cell g1) (cell g1) (cell ml-1) (cell ml-1) (cell ml-1) (cell ml-1)
Number of total bacteria
Mean 2.48 106 0.39 106 0.68 109 6.32 106 (*) 2.22 106 (*) 0.88 109 (ns)
SD 0.36 106 0.30 106 1.03 109 0.10 106 1.09 106 1.29 109
N 7 11 11 2 7 7
Number of nitrifying bacteria
Mean 1.24 105 2.16 103 3.15 106 4.20 106 (ns) 1.32 105 (*) 2.04 106 (ns)
SD 2.00 105 3.96 103 7.15 106 5.45 106 2.49 105 5.34 106
N 3 6 6 2 7 7
Table 4. Denitrification rate in riparian zone, poplar plantation and agricultural zone in two hydrological conditions (Mean ± SE ). SE = standard error.(*) statistical significant at 0.05 level for the comparison Low water – high water (ns) not significant statistically.
LOWWATERS HIGHWATERS
(n = 6) (n = 4) N-NO3- 10-3 g l-1 h-1 N-NO 3- 10-3 g l-1 h-1 Riparian zone 0.37 ± 0.82 0.73 ± 0.92 (*) Poplar plantation 0.08 ± 0.08 0.76 ± 0.37 (*) Agricultural zone 0.02 ± 0.01 0.04 ±0.04 (ns)
Table 3. Nitrite and nitrate nitrogen in surface water and groundwater from two hydrological conditions. SD = standard deviation. (*) statistically significant at 0.05 level for the comparison Low water – high water. (ns) no statistical significant.
LOWWATER HIGHWATER
Surface water Groundwater Surface water Groundwater N-NO2- (mg l-1) Mean 0.036 0.019 0.020 (ns) 0.003 (*) SD 0.006 0.014 0.028 0.004 N 3 6 2 7 N-NO3- (mg l-1) Mean 2.37 12.10 1.84 (ns) 9.13 (ns) SD 0.07 6.69 0.08 5.35 N 3 6 3 6
Discussion
This study has highlighted the role of surface water in the denitrification processes within the riparian zone. By comparing the infiltration of surface water to the aquifer (Fig. 2c) and the maps of nitrate and DOC variations (Fig. 5), it is clear that nitrate concentrations decrease strongly at the riparian sites where the percentage of river-derived water within the porous aquifer is high and where DOC concentrations fluctuate strongly.
This phenomenon shows the difference between ‘true’ groundwater (the groundwater located far from the surface water) strongly influenced by agriculture and riparian groundwater that is characterised by high surface water inputs. It is hypothesised that the riparian water is enriched
in nitrate by groundwater coming from the agricultural zone. Riparian water has access to organic matter in surface water; DOC concentrations are in the same range in riparian and surface waters whereas organic carbon levels are very low in ‘true’ groundwater. That DOC originates in surface water is indicated in the temporal variation in the density of nitrifying bacteria (Table 2); these were low in the riparian water compared to surface water during the low water period. Therefore, the increase in nitrifying bacterial numbers within the riparian porous aquifer may be explained by the entrance of surface water. Comparing the total bacteria in fine sediment layers without floods with those measured during a flood in three representative piezometers, shows that temporal variations within a given piezometer are much lower than differences between piezometers. Conversely, the total number of bacteria in interstitial water is not much affected by the hydrological conditions (during a flood the concentration can increase by an order of magnitude).
Surface water enriches the riparian porous aquifer with organic matter and bacterial cells (Table 2). Denitrification occurs even though there are nitrifying bacteria, probably because of the widespread presence of biofilms within the porous aquifer. Denitrification can occur within biofilms in oxygenated water (Teissier et al., 2002). These biofilms can be enriched in bacteria cells by surface water inputs (Table 2). In consequence of these additional processes, the riparian zone is a very active zone for nitrate removal from groundwater before it enters the surface water. A previous study at the same site measured the denitrification rate in three compartments (Gravel, Riparian and Poplar) under high and low water hydrological conditions. The denitrification rate increased by a factor of five during high water in the riparian and poplar zone. This result confirms the importance of hydrological conditions on the densities of bacteria responsible for nitrate removal. The hydrology is the most important factor influencing the processes responsible for the removal of the nitrate resulting from agricultural practices.
The results agree with the conceptual model developed by Dahm et al. (1998); for this interface or ecotone zone (the riparian zone), this forecasts traits caused by interactions between the characteristics of surface and groundwater.
Concerning the management of large alluvial floodplains, this study confirms the need for ensuring hydraulic connectivity between surface water and adjacent ecosystems (groundwater, riparian zone, poplar plantations) (Haycock and Pinay, 1993). In large alluvial floodplains with porous aquifers of relatively high permeability, nitrogen fluxes from the floodplain are transported within the saturated zone. Therefore, it is important to maintain continuity between
the primary production zone (surface water) and groundwater to allow organic matter to fuel the denitrification processes.
Acknowledgements
These investigations were part of the ECOBAG program. The PNRZH (French National Programme of Research on Wetlands) and the Agence de l’Eau Adour-Garonne provided financial support for this project and the DIREN the discharge data. The authors wish to thank four anonymous referees for their valuable comments.
References
Brinson, M.M., Bradshow, H.D. and Holmes, R.N., 1983. Significance of floodplain sediments in nutrient exchange between a stream and its floodplain. In: Dynamics of Lotic
Ecosystems, T.D. Fontaine III and S.M. Bartel (Eds.). Ann Arbor
Science, Michigan. 199–220.
Brinson, M.M., Bradshow, H.D. and Kane, E.S., 1984. Nutrient assimilative capacity of an alluvial floodplain swamp. J Appl.
Ecol., 21, 1041–1057.
Brüsch, W. and Nilsson, B., 1993. Nitrate transformation and water movement in a wetland area. Hydrobiologia 251, 103–111. Clarke, K.R. and Owens, N.J.P., 1983. A simple and versatile
micro-computer program for the determination of ‘most probable number’. J. Microbiol. Met., 1, 133–137.
Cooper, A.B., 1990. Nitrate depletion in the riparian zone and stream channel of a small headwater catchment. Hydrobiologia, 202, 12–36.
Correll, D.L., Jordan, T.E. and Weller, D.E., 1992. Nutrient flux in a landscape: effects of coastal land use and terrestrial community mosaic on nutrient transport to coastal waters.
Estuaries, 15, 431–442.
Dahm, C.N., Grimm, N.B., Marmonier, P., Valett, H.M. and Vervier, P., 1998. Nutrient dynamics at interface between surface waters and groundwaters. Freshwater Biol., 40, 407–452. Epstein, S. and Mayeda, T., 1953. Variation of 18O content of waters
from natural sources. Geochim. Cosmochim. Acta, 4, 213. Garabétian, F., Petit, M. and Lavandier, P., 1999. Does storage
affect epifluorescence microscopic counts of total bacteria in freshwater samples? C. R. Acad. Sci., Paris 322, 779–784 Gonfiantini, R., 1978. Standards for stable isotope measurements
in natural compounds. Nature, 271, 534.
Groffman, P.M. and Tiedje, J.M., 1989. Denitrification in north temperate forest soils: relationships between denitrification and environment factors at the landscape scale. Soil. Biol. Biochem., 21, 621–626.
Groffman, P.M., Gold, A.J. and Simmons, R.C., 1992. Nitrate dynamics in riparian forests: Microbial studies. J. Environ.
Qual., 21, 666–671.
Haycock, N.E. and Burt, T.P., 1993. Role of floodplain sediments in reducing the nitrate concentration of subsurface run-off: A case study in the Cotswolds, UK. Hydrol. Process, 7, 287–295. Haycock, N.E. and Pinay, G., 1993. Nitrate reduction in grass and poplar vegetated riparian buffer strips during the winter. J.
Environ. Qual., 22, 273–278.
Lowrance, R.R., Todd, R.L., Fail, J. Jr., Hendrickson, O. Jr., Leonard, R. and Asmussen, L., 1984. Riparian forests as nutrient filters in agricultural watersheds. Bioscience, 34, 374–377.
McGrady, M.H., 1915. The numerical interpretation of fermentation-tube results. J. Infec. Dis., 17, 183–212. Patrick, W.H. Jr., 1990 Microbial reactions of nitrogen and
phosphorus in wetlands. The Utrecht Plant Ecology News
Reports, 11, 52–63.
Patrick, W.H., Gambrell, R.P. and Faulkner, S.P., 1996. Redox measurements of soils. Methods of soil analysis, Part 3. Chemical Methods. Soil Sci. Amer. Soc. Book Series no.5, Madison, WI, U.S.A. 1255–1273.
Peterjohn, W.T. and Correll, D.L., 1984. Nutrient dynamics in an agricultural watershed: observations on the role of a riparian forest. Ecology, 65, 1466–1475.
Peterson, D.L. and Rolfe, G.L., 1982. Seasonal variation in nutrients of floodplain and upland forest soils of central Illinois.
Soil Sci. Soc. Amer. J., 46, 1310–1315.
Pinay, G. and Décamps, H., 1988. The role of riparian woods in regulating nitrogen fluxes between the alluvial aquifer and surface water: A conceptual model. Regul. Rivers: Res. Mgmt, 2, 507–516.
Pinay, G., Ruffinoni, C. and Fabre, A., 1995. Nitrogen cycling in two riparian forest soils under different geomorphic conditions.
Biogeochemistry, 30, 9–29.
Porter, K.G. and Feig, Y.S., 1980. The use of DAPI for identifying and counting aquatic microflora. Limnol. Oceanography, 25, 943–948
Reddy, K. R. and Rao, P.S.C., 1983. Nitrogen and phosphorus fluxes from a flooded organic soil. Soil Sci., 136, 300–307. Sánchez-Pérez, J.M. and Trémolières, M., 1996. Influence de la
forêt sur la qualité de l’eau souterraine. Fonctionnement hydrogéochimique des écosytèmes forestiers alluviaux.
Documents du BRGM 256, 106–121.
Sánchez-Pérez, J.M., and Trémolières, M., 1997. Variation in nutrient level of the groundwater in the upper Rhine alluvial forest as a consequence of hydrological regime and soil texture.
Global Ecol. Biogeography Lett., 6, 211–217.
Sánchez-Pérez, J.M., Trémolières, M., 2003. Change in groundwater chemistry as a consequence of suppression of floods : the case of the Rhine floodplain. J. Hydrol., 270, 89– 104.
Sánchez-Pérez, J.M., Bouey, C., Sauvage, S., Teissier, S., Antiguedad, and I., Vervier, P., (2003). A standardized method for measuring in situ denitrification in shallow aquifers: Numerical validation and measurements in riparian wetlands.
Hydrol. Earth Syst. Sci., 7, 85–94.
Sánchez-Pérez, J.M., Trémolières, M. and Carbiener, R., 1991a. Une station naturelle d’épuration des phosphates et des nitrates apportés par les eaux de débordement du Rhin: la forêt alluviale à frêne et orme. C. R. Acad Sci. Paris, 112, 395–402.
Sánchez-Pérez, J.M., Trémolières, M., Schnitzler, A. and Carbiener, R., 1991b. Evolution de la qualité physico-chimique des eaux de la frange superficielle de la nappe phréatique en fonction du cycle saisonnier et des stades de succession des forêts alluviales rhénanes. (Querco-Ulmetum). Acta Oecol., 12, 581–601.
Schmidt, E.L. and Belser, L.W., 1994. Autotrophic nitrifying bacteria. In: Methods of soil analysis. Part 2, Microbiological
and biochemical properties, J.M. Bigham (Ed.). SSSA Book
series n°5, Madison, WI, USA. 159–177.
Swanson, F.J., Gregory, J.R., Sedell, J.R. and Campbell, A.G., 1982. Land-water interactions: the riparian zone. In: Analysis
of coniferous forest ecosystems in the Western US, R. Edmunds
(Ed.), Academic Press, New-York. 267–291.
Takatert, N., Sánchez-Pérez, J.M. and Trémolières, M., 1999. Spatial and temporal variations of nutrient level in groundwater under an alluvial flooded forest : effect of hydrology, vegetation and substrate. Hydrol Process, 13, 1511–1526.
Teissier, S., Garabétian, F., Torre, M., Dalger, D. and Labroue, L., 2002. Impact of an urban centre on the nitrogen cycle processes of epilithic biofilms during a summer low water period. River Res Applic., 18, 21–30.
Thiery, D., 1990. Logiciel MARTHE. Modélisation d’Aquifère par
un maillage Rectangulaire en régime Transitoire pour un calcul Hydrodynamique des Ecoulements - version 4.3. R32210 EAU
4S 90, BRGM.
Thiery, D., 1993. Résolution matricielle et nouvelles géométries
dans le logiciel MARTHE. R37762 EAU 4S 93, BRGM.
Weng, Ph., Sánchez-Pérez, J.M., Sauvage, S.,. Vervier, P. and Giraud, F., (in press). Hydrological modelling to characterise the riparian wetland of a large alluvial river (Garonne river, France). Hydrol. Process.
Zak, D.R. and Grigal, D.G., 1991. Nitrogen mineralisation, nitrification, and denitrification in upland and wetland ecosystems. Oecologia, 88, 189–196.