ECOLE DE TECHNOLOGIE SUPÉRIEURE UNIVERSITÉ DU QUÉBEC
THESIS PRESENTED TO
ÉCOLE DE TECHNOLOGIE SUPÉRIEURE
IN PARTIAL FULFILLMENT OF THE REQUIREMENTS FOR A MASTER’S DEGREE WITH THESIS IN RENEWABLE ENERGY
AND ENERGY EFFICIENCY M. Sc. A.
BY David HERZOG
COMPARATIVE PERFORMANCE ANALYSIS OF LI-ION AND NI-CD BATTERIES AT VARIABLE TEMPERATURES
MONTREAL, 22ND OF FEBRUARY 2016
This Creative Commons licence allows readers to download this work and share it with others as long as the author is credited. The content of this work may not be modified in any way or used commercially.
BOARD OF EXAMINERS
THIS THESIS HAS BEEN EVALUATED BY THE FOLLOWING BOARD OF EXAMINERS
Mr. Louis-A Dessaint, Thesis Supervisor
Département de génie électrique at École de technologie supérieure
Mr. Handy Fortin Blanchette, Chair, Board of Examiners
Département de génie électrique at École de technologie supérieure
Mr. Kamal Al-Haddad, Member of the jury
Département de génie électrique at École de technologie supérieure
THIS THESIS WAS PRESENTED AND DEFENDED
IN THE PRESENCE OF A BOARD OF EXAMINERS AND THE PUBLIC 17TH OF FEBRUARY 2016
ACKNOWLEDGMENTS
First of all, I would like to thank my supervisor M. Louis-A Dessaint, professor and researcher in the Electrical Engineering Department at ÉTS. This thesis project has allowed me not only to gain experience in energy storage and batteries, but also to apply my knowledge in solving practical problems. Thank you for giving me this great opportunity.
I would like to extend my gratitude to the aircraft manufacturer, for its interest in R&D and for having chosen ÉTS, as it is renowned as the leading engineering school in Quebec. Thank you for the funding, which you have provided for this project.
Finally, I would like to acknowledge the contributions of Ernesto Vilchez, Christian Talbot, Pierre Mercier and Alexandre Lupien-Bédard in this project.
COMPARATIVE PERFORMANCE ANALYSIS OF LI-ION AND NI-CD BATTERIES AT VARIABLE TEMPERATURES
David HERZOG
RESUME
L'industrie aérospatiale recherche actuellement des solutions pour créer des avions plus légers, plus sûrs et plus puissants. L’amélioration des batteries peut aider l’industrie à atteindre ces objectifs. Dans ce rapport, les tests ont été effectués sur la technologie de batterie Ni-Cd actuellement utilisée dans l’aéronautique et sur le Li-Ion, qui est en attente d'approbation pour une utilisation en vol. Les deux technologies sont comparées. Les conditions complètes de vol ont été recréées avec un banc d’essai, pour simuler ce que la batterie va rencontrer au cours de son utilisation dans un avion. Ces batteries servent à démarrer un moteur auxiliaire (APU). Les tests ont révélé que les températures froides impactent plus les performances de la batterie que les températures chaudes, soulignant ainsi l'importance d'examiner les limites opérationnelles. L’état de charge (SOC) est le deuxième facteur le plus important réduisant les performances de la batterie. Une recommandation serait d’ajouter un système chauffant autour des batteries, pour qu’elles ne soient jamais trop froides pour effectuer un démarrage d’APU.
Mots clés: Aérospatiale, avion, batterie, Li-Ion, lithium-ion, Ni-Cad, nickel-cadmium, banc d'essai, températures variables, APU, performance
COMPARATIVE PERFORMANCE ANALYSIS OF LI-ION AND NI-CD BATTERIES AT VARIABLE TEMPERATURES
David HERZOG
ABSTRACT
The aerospace industry has a major focus on solutions for lighter, safer, and more powerful aircraft. Improving battery technology can advance manufacturers towards these goals. In this report, tests have been carried out on the current Ni-Cad battery technology against a new Li-Ion battery pending approval for in-flight use. Complete flight conditions were recreated with a bench test, to simulate what an aircraft battery would encounter during its service time. The batteries are utilized to start the auxiliary power unit (APU). Tests revealed that cold temperatures impact battery performance more drastically than hot temperatures, thus highlighting the importance of examining operational limits. Insufficient state of charge (SOC) has the second-greatest impact. A recommendation for the Li-Ion and Ni-Cd batteries would be to add a heating device around the battery, thus the battery will never be too cold to perform an APU start.
Keywords: aerospace, aircraft, battery, Li-Ion, lithium-ion, Ni-Cad, nickel-cadmium, bench test, variable temperatures, APU, performance
TABLE OF CONTENTS
INTRODUCTION ...1
CHAPTER 1 Ni-Cd AND Li-Ion GENERAL CHARACTERISTICS ...3
1.1 Battery basic concepts ...3
1.1.1 Factors affecting battery performance ... 4
1.2 Test results from the literature ...6
1.2.1 Temperature ... 6
1.2.2 Discharge rate ... 10
1.2.3 Internal resistance ... 11
CHAPTER 2 REQUIREMENTS FOR THE TEST ...14
2.1 The purpose of the project ...14
2.2 Test Definition Sheet ...14
2.2.1 Algorithm for the batteries tests ... 16
2.2.2 Conditions for a successful APU start ... 17
2.2.3 APU start curves with DC starter motor ... 18
2.2.4 APU start curves with Starter Generator ... 19
2.3 Batteries characteristics ...20
2.3.1 Batteries characteristics comparison ... 20
2.3.2 Technical differences between Li-Ion and Ni-Cd ... 20
2.4 Bench test ...21
CHAPTER 3 NI-CD ...23
3.1 Ni-Cd Introduction ...23
3.2 Flight results at different temperatures ...23
3.2.1 Flight at -40°C ... 23 3.2.2 Flight at -20°C ... 26 3.2.3 Flight at 0°C ... 30 3.2.4 Flight at 20°C ... 31 3.2.5 Flight at 30°C ... 31 3.2.6 Flight at 50°C ... 32 3.2.7 Flight at 70°C ... 32
3.2.8 Summary of the flight results at different temperatures ... 33
3.3 Observations ...34
3.3.1 Temperature influence on the voltage ... 34
3.3.2 Temperature influence on the voltage during the APU starts ... 35
3.3.3 SOC influence on the voltage ... 36
3.4 Statistics about the flights results ...37
3.4.1 Statistic: SOC VS Temperature ... 37
3.4.3 Statistic: Success rate VS SOC ... 38
3.5 Ground phase of 20 minutes ...39
3.5.1 Result of the tests with a ground phase of 20 minutes ... 40
3.6 Flights with 80%+ SOC ...41
3.7 Capacity check after 32 flights ...41
3.7.1 Procedure used for the capacity check ... 42
3.8 Conclusion ...43
CHAPTER 4 LI-ION ...45
4.1 Li-Ion Introduction...45
4.2 Observations ...45
4.2.1 Temperature influence on the voltage ... 45
4.2.2 Temperature influence on the voltage during an APU ... 46
4.2.3 Voltage drop during an APU start at different SOC ... 48
4.2.4 SOC drop during APU starts at different temperatures ... 49
4.2.5 Charging time after the APU starts at different temperatures ... 50
4.2.6 Thermal transfer ... 51
4.3 Statistics about flights results...52
4.3.1 S1 Battery... 52
4.3.2 S2 Battery... 53
4.3.3 S2N Battery ... 54
4.4 Issues ...55
4.4.1 Transit flight of 20 minutes ... 55
4.4.2 Temperature alarm ... 58
4.4.3 Low temperature ... 59
4.4.4 SOC instability ... 62
4.4.5 SOC reliability test ... 66
4.4.6 Behaviour comparison ... 66
4.5 Temperature results ...67
4.5.1 Test at -40°C ... 67
4.5.2 Test at -20°C ... 67
4.5.3 Test between 0°C and 50°C ... 69
4.5.4 Test at 70°C ... 69
4.6 Recommendations ...70
4.7 Conclusion ...70
CHAPTER 5 COMPARATIVE PERFORMANCE ANALYSIS OF LI-ION AND NI-CD BATTERIES ...73
5.1 Introduction ...73
5.2 Flight results at different temperatures ...73
5.2.1 Flight at -40°C ... 73
5.2.2 Flight at -35°C, -30°C and -25°C ... 74
5.2.3 Flight at -20°C ... 75
5.2.4 Flight at 0°C ... 77
5.2.6 Flight at 30°C ... 80
5.2.7 Flight at 50°C ... 82
5.2.8 Flight at 70°C ... 83
5.2.9 Summary of the flight results at different temperatures ... 84
5.3 Observations ...85
5.3.1 Temperature influence on the voltage ... 85
5.3.2 Temperature influence on the voltage during the APU starts ... 87
5.3.3 SOC influence on the voltage during the APU starts ... 87
5.4 Ground phase of 20 minutes ...88
5.5 Flights with 80%+ SOC ...90
5.6 Statistics about the flight results ...91
5.7 Number of flight tested ...92
5.8 Behaviour comparison ...93 5.8.1 Recharging temperatures ... 93 5.8.2 SOC ... 93 5.8.3 Recharging current ... 93 CONCLUSION ...95 RECOMMENDATIONS ...97 APPENDIX I Ni-Cd ...99 APPENDIX II Li-Ion ...105 LIST OF REFERENCES ...127
LIST OF TABLES
Table 2-1 Batteries characteristics (Source: Manufacturer user manual) ...20
Table 3-1 Flight results at different temperatures ...33
Table 3-2 Battery voltage at different SOC and 50°C ...36
Table 3-3 Success rate of each SOC level according to the surrounding temperature (If there is an empty cell in the table, this means no tests have been carried out at this temperature and SOC level) ...37
Table 3-4 Internal temperatures of the battery at the end of the flight sequence at -56°C ...40
Table 3-5 Battery capacity - New VS after 32 flights ...41
Table 4-1 Battery S1 - Success rate of each SOC level according to the surrounding temperature (If there is an empty cell in the table, this means no tests have been carried out at this temperature and SOC level.)52 Table 4-2 Battery S2 - Success rate of each SOC level according to the surrounding temperature (If there is an empty cell in the table, this means no tests have been carried out at this temperature and SOC level.)53 Table 4-3 Battery S2N - Success rate of each SOC level according to the surrounding temperature (If there is an empty cell in the table, this means no tests have been carried out at this temperature and SOC level.)54 Table 4-4 SOC reliability test ...66
Table 5-1 Flight results at -40°C ...73
Table 5-2 Flight results at -35°C, -30°C and -25°C ...74
Table 5-3 Flight results at -20°C ...75
Table 5-4 Flight results at 0°C ...77
Table 5-5 Flight results at 20°C ...79
Table 5-6 Flight results at 30°C ...80
Table 5-7 Flight results at 50°C ...82
Table 5-9 Flight results at different temperatures ...84 Table 5-10 Battery voltage at different temperatures (SOC at 70%) ...85 Table 5-11 Voltage difference between two temperatures for each battery ...86 Table 5-12 Voltage during the APU starts at different temperatures (SOC at 70%) ...87 Table 5-13 Voltage during the APU starts at different SOC (Temperature at 30°C) ..88 Table 5-14 Flight results at different SOC with a ground phase of 20 minutes ...89 Table 5-15 Internal temperatures of the batteries at the end of the flight sequence
at -56°C ...89 Table 5-16 Flight results with 80%+ SOC ...90 Table 5-17 Number of flight tested for each battery ...92 Table 5-18 Ni-Cd - Success rate of each SOC level according to
the surrounding temperature ...91 Table 5-19 Li-Ion S1 - Success rate of each SOC level according to
the surrounding temperature ...91 Table 5-20 Li-Ion S2 - Success rate of each SOC level according to
the surrounding temperature ...91 Table 5-21 Li-Ion S2N - Success rate of each SOC level according to
LIST OF FIGURES
Figure 1-1 Comparison of the energy density of batteries ...4
Figure 1-2 CCCV charge curves of a LiFePO4 cell at various temperatures ...6
Figure 1-3 C-rate discharge curves of a LiFePO4 cell at various temperatures ...6
Figure 1-4 Charge and discharge capacity of a LiFePO4 cell at various temperatures .7 Figure 1-5 Discharge capacity at 60°C as a function of discharge rate. Saft Li-Ion cells ...8
Figure 1-6 Discharge curve of two cells in series at –40°C and 1000A (200C). The black curve is voltage and the red curve is exterior cell temperature. Cells: Saft UHP (VL5U) ...9
Figure 1-7 Discharging curves of 50A (1C) constant current ...10
Figure 1-8 Voltage and discharge capacity as a function of rate of discharge at 20°C ...11
Figure 1-9 Ohmic resistance curves of discharge under different SOC and temperatures ...12
Figure 1-10 Ohmic resistance curves of charge under different SOC and temperatures12 Figure 2-1 Medium-haul flight mission profile ...15
Figure 2-2 Algorithm of a flight simulation (Process to test the battery) ...17
Figure 2-3 APU start current curve for S1, S2 and Ni-Cd batteries (DC starter motor)18 Figure 2-4 Zoom-in APU start current curve for S1, S2 and Ni-Cd batteries ...18
Figure 2-5 APU start current curve in use for S2N battery (Starter Generator) ...19
Figure 2-6 Zoom-in APU start current curve in use for S2N battery ...19
Figure 2-7 Equipment for the tests ...22
Figure 3-1 Voltage curve during the APU starts (-40°C, 70% SOC) ...24
Figure 3-3 Current curve during the APU starts (-40°C, 70% SOC) ...25
Figure 3-4 Current curve during the APU starts (-40°C, 40% SOC) ...25
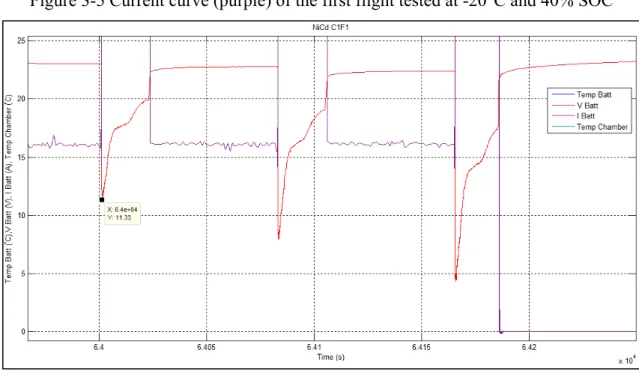
Figure 3-5 Current curve (purple) of the first flight tested at -20°C and 40% SOC....27
Figure 3-6 Voltage curve (red) of the first flight tested at -20°C and 40% SOC ...27
Figure 3-7 Current curve (purple) of the last flight tested at -20°C and 40% SOC ....28
Figure 3-8 Voltage curve (red) of the last flight tested at -20°C and 40% SOC ...28
Figure 3-9 Current curve during the APU starts (-20°C, 70% SOC) ...29
Figure 3-10 Voltage curve during the APU starts (-20°C, 70% SOC) ...29
Figure 3-11 Voltage curve during the APU starts (-20°C, 90% SOC) ...30
Figure 3-12 Voltage curve during the APU starts (0°C, 80% SOC) ...31
Figure 3-13 Voltage curve during the APU starts (70°C, 40% SOC) ...32
Figure 3-14 Battery voltage at different temperatures (SOC at 70%) ...34
Figure 3-15 Voltage during the APU starts at different temperatures (SOC at 70%) ...35
Figure 3-16 Battery voltage at 40% SOC and 50°C ...36
Figure 3-17 Battery voltage at 80% SOC and 50°C ...36
Figure 3-18 Battery voltage at 90% SOC and 50°C ...36
Figure 3-19 Success rate of each SOC level according to the surrounding temperature (some data are not visible on the chart because they are superimposed) ...37
Figure 3-20 Success rate VS Temperature ...38
Figure 3-21 Success rate VS SOC ...38
Figure 3-22 Internal temperature during a transit flight of 20 minutes at -20°C (cycle 3, flight 10) ...39
Figure 3-23 Voltage curve during the APU starts after a transit flight of 20 minutes (80% SOC, internal temp -20°C) ...40
Figure 4-1 Battery voltage at different temperatures (SOC at 70%) ...46
Figure 4-2 Voltage during an APU start at different temperatures (SOC at 40%) ...47
Figure 4-3 Voltage drop during an APU start at different SOC (ambient temperature at 0°C) ...48
Figure 4-4 SOC drop during the APU starts at different temperatures ...49
Figure 4-5 Charging time after the APU starts at different temperatures ...50
Figure 4-6 Thermal transfer at different temperatures (SOC at 70%) ...51
Figure 4-7 Battery S1 - Success rate of each SOC level according to the surrounding temperature (some data are not visible on the chart because they are superimposed) ...52
Figure 4-8 Battery S2 - Success rate of each SOC level according to the surrounding temperature (some data are not visible on the chart because they are superimposed) ...53
Figure 4-9 Battery S2N - Success rate of each SOC level according to the surrounding temperature (some data are not visible on the chart because they are superimposed) ...54
Figure 4-10 Internal temperature during a transit flight of 20 minutes at 20°C (cycle 1, flight 11) ...55
Figure 4-11 Current, voltage, temperature and SOC during an APU start failure (cycle 1, flight 11: -20°C and 80% SOC) ...56
Figure 4-12 Current, voltage, temperature and SOC during an APU start (cycle 2, flight 9) ...57
Figure 4-13 Test at 70°C with an SOC at 80% ...59
Figure 4-14 Voltage during APU, SOC at 40% and chamber temperature at -20°C (In blue: cycle 1, flight 1; in red: cycle 3, flight 1) ...60
Figure 4-15 Battery voltage during an AP3U start at different temperatures (SOC at 70%) ...61
Figure 4-16 SOC unstable – S2 battery ...62
Figure 4-17 Flight sequence at negative temperature (Cycle 1, Flight 1) ...63
Figure 4-19 Ground phase of 10h at negative temperatures (Cycle 1 Flight 1) ...65 Figure 4-20 Ground phase of 10h at positive temperatures (Cycle 2 Flight 2) ...65 Figure 4-21 Communication lost after three successful APU starts ...69 Figure 5-1 Moving average filter applied to the voltage measurement (Li-Ion S1) ....86
LIST OF ABREVIATIONS
APU Auxiliary Power Unit
ARINC Aeronautical Radio Incorporated BMS Battery Management System
CC Constant Current
CV Constant Voltage
DOD Depth of Discharge Li-Ion Lithium
Ni-Cd Nickel-Cadmium OCV Open Circuit Voltage
PXI PCI eXtensions for Instrumentation SOC State of charge
TDS Test Definition Sheet TRU Transformer Rectifier Unit
LIST OF SYMBOLS AND UNITS OF MEASUREMENTS
I Battery current (A) V Battery voltage (V)
SOC Battery State of Charge (%) C Battery capacity (Ah) Temp Temperature (°C)
INTRODUCTION
The first objective of this project was to set up a bench test in order to recreate the complete flight conditions the battery would encounter in an aircraft. The second objective is the analysis of the performance of a nickel-cadmium (Ni-Cad) battery compared to a lithium-ion (Li-Ion) battery. Both types of battery are utilized to start the auxiliary power unit (APU) of an airplane. Both types underwent tests at variable temperatures to observe their potential to meet the industrial customer’s requirements under such conditions. By developing more reliable batteries, improvements can be made to the safety of both aircraft and electrical vehicles. The results of this paper aim to aid the industrial customer when making strategic decisions with battery choice.
Many industries, especially the aerospace industry, are currently interested in replacing aging Ni-Cad battery technology with the more recent, lighter Li-Ion technology. As Li-Ion batteries have a higher energy density compared to Ni-Cad, the overall weight of the aircraft can be reduced.
The Li-Ion batteries are equipped with a battery management system (BMS), which allows the display of the state of charge (SOC) in real time. Contrastingly, SOC of a Ni-Cad battery is not readily available in real time. The BMS also protects the cells, prevents thermal runaway, and measures the voltage, current and temperature. Because the BMS allows greater control of energy storage, Li-Ion batteries are a major interest to the aerospace industry and are currently being tested for in-flight use. The tests ensured that the battery can be used in dynamic, onboard operations in addition to stationary operations.
For use in flight, a battery must be able to deliver high currents, up to 800A, over a short period of time at temperatures between -40°C and +70°C. Extreme temperatures have the greatest impact on aircraft battery performance. Insufficient SOC has the second-greatest impact. Both of these factors contribute to the chance of starting the APU; if a battery cannot start the APU within three attempts, the aircraft will be barred from take-off. The tests in this
report are designed to examine the operating range and limits of Li-Ion and Ni-Cad batteries and determine if they meet these criteria. The batteries have been tested in the following order: First the Li-Ion S1, then the Li-Ion S2, followed by the Ni-Cd and to finish the Li-Ion S2N.
CHAPTER 1
Ni-Cd AND Li-Ion GENERAL CHARACTERISTICS
1.1 Battery basic concepts
This report focuses on the Ni-Cd and Li-Ion batteries. A battery is a device that converts chemical energy into electric energy. A battery is composed of several cells. These cells can be connected in series to increase the voltage or in parallel to increase the capacity (Ah). The cells can also be connected in serial/parallel to achieve a specific voltage and current. The capacity of a battery is expressed in ampere-hour (Ah) and it represents the available energy of the battery. The charge and discharge current of a battery are measured in C-rate, e.g. for a 50Ah battery, 1C rate corresponds to 50A.
SOC
The state of charge (SOC) represents the remaining energy available in the battery, expressed in percentage. When the SOC is at 100% the battery is fully charged and at 0% the battery is empty. The depth of discharge (DOD) represents the percentage of the battery capacity that has been discharged compared to the maximum capacity.
BMS
The Li-Ion has the advantage of having a battery management system (BMS) compared to the Ni-Cd. The BMS controls the charge and discharge, optimize the performance, enhance safety and provide live data on the battery condition. The voltage of each individual cell in the battery is continuously monitored, allowing the cell to be balanced. A short-circuit protection device is embedded in the battery, to avoid any damage to the cells. The internal temperature is controlled, if the battery go over or below a threshold, the charge current will be limited or the battery will activate the protection mode by disconnecting itself. The SOC of the battery can be calculated and displayed in real time.
Specific energy
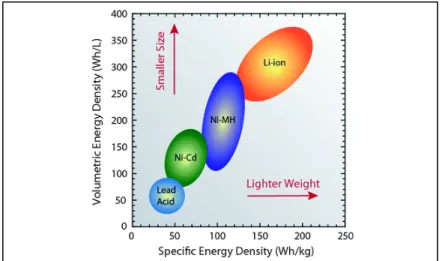
The Figure 1-1 compares the specific energy of the Ni-Cd and the Li-Ion. The Li-Ion has a higher energy density compared to the Ni-Cd. In the figure 1-1, the energy is represented as an area to show the difference in performance that a battery can have under different conditions of use.
Figure 1-1 Comparison of the energy density of batteries Taken from Landi et al. (2009, p. 640)
1.1.1 Factors affecting battery performance
Discharge rate
When there is a high discharge current, the battery voltage can drop extremely low. Therefore, the battery can be disconnected even if there is still energy inside it, because the voltage goes under the minimum threshold of the battery (cutoff voltage). Once the load is removed from the battery, the voltage slightly increase after a resting period. The capacity of the battery decreases with increasing discharge current. The service life of the battery is reduced when discharged at high current. Moreover, discharging at high rates may heat up the battery above the surrounding temperature.
Temperature
The temperature is one of the key factor affecting the battery performance. The temperature has a direct impact on the energy that the battery is able to deliver. Lowering of the discharge temperature will result in a reduction of capacity, therefore the battery will reach the cutoff voltage faster. At low temperatures, there is a reduction in chemical activity and an increase of the battery internal resistance. At high temperatures, the performance is reduced due to self-discharge or chemical deterioration. Furthermore, high temperatures accelerate the aging of the cells.
Aging and service life
There are two types of aging for a battery. The aging of the battery corresponds to a loss in energy storage capability. The first one, is related to the length of storage period, calendar life. When the battery is stored for a long time with no activity, the following parameters are affecting the battery life: the self-discharge, the temperature variations and the electrochemical system. The second one, is influenced directly by the number of cycle charge/discharge performed by the battery. The service life of the battery is specified in number of cycles. Batteries have a predetermined number of cycles before the overall capacity drops, in other words, the charge retention is reduced. Every cycle slowly reduces the battery life expectancy.
Design
The hardware used for the design of the battery will directly influence the battery performance. It will impact the thermal exchange, size and weight of the battery. These components are, for example, container material, spacing between the cells, electrical circuits, insulation and protection devices.
1.2 Test results from the literature 1.2.1 Temperature
The graphs 1-2 and 1-3 show the impact of the temperature on lithium iron phosphate (LiFePO4) cells from Lishen Co. LTD. As show in the charts 1-2 and 1-3, when the temperature is between 10°C and 40°C, the impact of temperature on the charge/discharge is not that important. However, at 0°C, the performances start to be reduced and then at -15°C the performance of the cells is significantly reduced. The 25°C curve can be used as a reference. In can be seen that during the discharge, the voltage drops rapidly with the decrease in temperature and for the charge, the voltage rises rapidly with decreasing temperature.
Figure 1-2 CCCV charge curves of a LiFePO4 cell at various temperatures Taken from Li Yong et al. (2014, p. 2)
Taken from Li Yong et al. (2014, p. 2)
The graph 1-4 puts into perspective the charge and discharge capacity of a LiFePO4 cell at various temperatures. At -15°C, the useable energy of the cell is at 22.2% and at 25°C it’s at 91.7%, showing again the impact of temperature on the cells performance. At 40°C, the SOC is exceeding 100%. “These phenomena are due to the change of both polarization and inner resistance at different temperatures” Li Yong et al. (2014, p. 2).
Figure 1-4 Charge and discharge capacity of a LiFePO4 cell at various temperatures Taken from Li Yong et al. (2014, p. 2)
The high temperatures have less effect on the Li-Ion cells performance (Saft UHP VL5U). As shown in the graph 1-5, the performance remain relatively similar regardless of the discharge rate.
Figure 1-5 Discharge capacity at 60°C as a function of discharge rate. Saft Li-Ion cells Taken from Allen et al. (2009, p. 8)
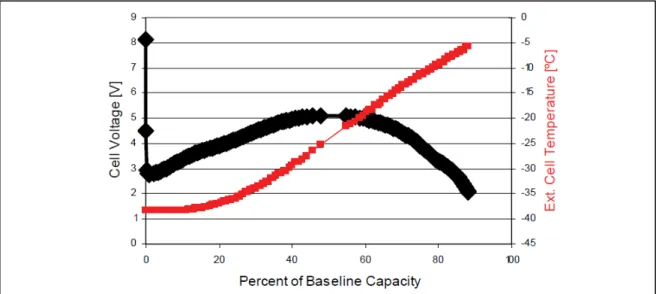
The chart 1-6 is here to showcase the influence of the cells self-heating on the cells temperature and voltage. In this case, two Li-Ion cells wired in series have been used, no battery pack around. At the beginning of the test at -40°C, discharged at 1000A (200C), there is a drop in the voltage from 8.1V to 4.5V. Then the phenomenon is observed, the cells start to self-heat, therefore their temperature rises, increasing at the same time the voltage of the cells. Reaching a voltage of 5.11V around the middle of the discharge sequence, before sloping back down, since the battery is starting to run out of energy. The difference with the tests carried out in this thesis on the Ni-Cd and the Li-Ion batteries is, the current peaks at 800A only last for a few seconds to conduct the APU starts, compared to the chart 1-6 where the cells are discharged at 1000A until they run out of energy. This means, the Ni-Cd and the Li-Ion batteries do not have the time to self-heat as described below, since their current peaks only last for a few seconds. However, the effects of this phenomenon needs to be known in order to better understand the behaviour of the battery voltage.
Figure 1-6 Discharge curve of two cells in series at –40°C and 1000A (200C). The black curve is voltage and the red curve is exterior cell temperature. Cells: Saft UHP (VL5U)
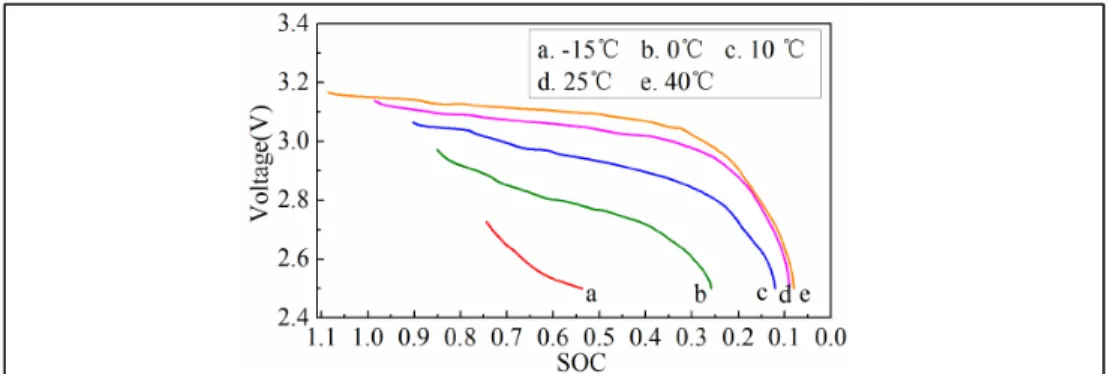
The graph 1-7 is presented here, since the test used equivalent temperature conditions and battery capacity compared to tests carried out in this thesis. The battery is a 50Ah lithium-ion phosphate. The graph 1-7 shows the impact of the temperature on the battery performance during discharge. Starting from 0°C and lower, the battery performances are really limited. At -40°C, the battery is unable to work. The battery was discharged at constant currents of 50A (1C) and the cutoff voltage was 2.5V.
Figure 1-7 Discharging curves of 50A (1C) constant current under different temperatures
Taken from Zang et al. (2014, p. 2)
1.2.2 Discharge rate
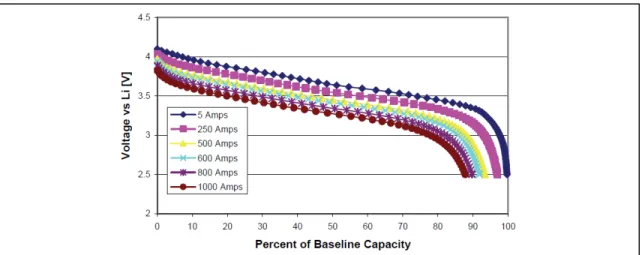
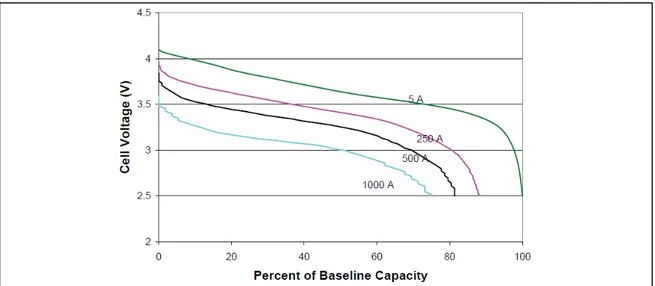
Another test on Li-Ion cells have been made on Saft Ultra High Power (VL5U), ratted at ~5Ah and ~20Wh. These cells were subjected to high rate discharge, up to 1000A (200C). The graph 1-8 displays the discharge capacity of a single cell at 20°C with different currents. The higher the current withdrawn, the lower the voltage. The baseline capacity is 5A. “The cell is able to deliver about 75% of the 1C (5A) discharge capacity while discharging at the 200C (1000A) rate” Allen et al. (2009, p. 3).
The same report also shows that at 1000A discharge current, the battery can deliver an energy of 36 Wh/kg and a power of 8.7 kW/kg while at 5A discharge current, the battery has an energy of 57 Wh/kg and a power of 0.052 kW/kg.
Figure 1-8 Voltage and discharge capacity as a function of rate of discharge at 20 °C The baseline capacity is ~5 Ah at room temperature
Taken from Allen et al. (2009, p. 3)
The report concludes as following regarding the temperature and the discharge rate: “Cycling at different conditions suggests that high rate cycling degrades the cell faster than high temperature cycling, which implies that significant self-heating occurs at high rates of discharge.” Allen et al. (2009, p. 14).
1.2.3 Internal resistance
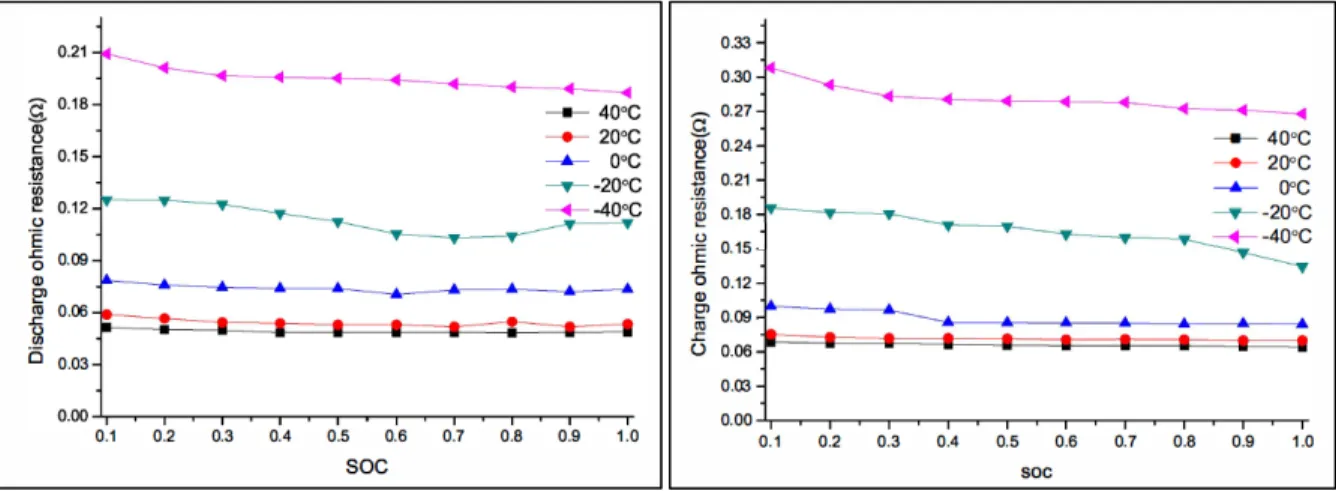
For the following statement, a 50Ah lithium-ion phosphate battery has been used. “The lower the temperature is, the greater the resistance is. Meanwhile, the increase of resistance is obvious when the temperature is below O°C, which is much more obvious for temperature under -20°C” Mengyan Zang et al. (2014, p. 8). On the other hand, the SOC shows less effect on the ohmic resistance of the battery. The battery charge resistance is
significantly higher than discharge resistance, this difference is increased at temperatures below 0°C, as shown in the two charts 1-9 and 1-10.
Figure 1-9 Ohmic resistance curves of discharge under different SOC and
temperatures
Taken from Zang et al. (2014, p. 4)
Figure 1-10 Ohmic resistance curves of charge under different SOC and
temperatures
CHAPTER 2
REQUIREMENTS FOR THE TEST 2.1 The purpose of the project
The purpose of this project was to study the performance of the Li-Ion and Ni-Cd batteries designed for the aerospace industry, to assess their abilities to meet all the requirements from the test definition sheet (TDS) emitted by the aircraft manufacturer. The Li-Ion and Ni-Cd batteries are tested at different temperatures and different SOC. The batteries have been tested in the following order: First the Li-Ion S1, then the Li-Ion S2, followed by the Ni-Cd and to finish the Li-Ion S2N. Complete flight conditions were recreated to simulate what an aircraft battery would encounter during its service time. To recreate these conditions a bench test has been built.
2.2 Test Definition Sheet
The test definition sheet (TDS) has been emitted by the aircraft manufacturer. Complete flight conditions were recreated with an environmental chamber to simulate what an aircraft battery would encounter during its service time.
The flight tests are composed of two parts:
• Ground step: the aircraft (battery) stays on the ground for 20 minutes or 10 hours at a designated temperature. The 10h period is named cold soak and the 20min period is named time on ground between flights. At the end of the ground phase, three APU starts are performed. The APU starts are presented later in the report.
• Flight step: during this sequence the aircraft (battery) is surrounded by temperature of -56°C for 10 hours (long flight), 3.48 hours (medium flight) or 1.6 hours (short flight).
The figure 2.1 shows a typical profile of medium-haul flight. At the beginning, the battery is on the ground at a designated temperature. Then, the aircraft takes off to reach the cruising altitude, at this moment the battery is surrounded by a temperature of -56°C. To finish, the aircraft (battery) is landing at a new destination, with a new surrounding temperature.
Figure 2-1 Medium-haul flight mission profile
At the beginning of each test, a specific temperature and SOC level are chosen according to the requirements from the TDS. The temperature is ranging from -40°C to +70°C and the SOC from 40% to 90%. The different temperatures in use are -40°C, -20°C, 0°C, 20°C, 30°C, 50°C and 70°C. The different SOC for the tests are 40%, 70%, 80% and 90%. This report will present the influence of the temperature and the SOC on the performances of the battery, by analysing its behaviour and limits.
2.2.1 Algorithm for the batteries tests
The following flowchart, figure 2-2, explains the normal mode process of a test on the batteries.
Start
Set the surrounding temperature and the SOC of the battery Wait for 20min or 10h
Measure and record I, V and Temperature
Withdraw current from the battery: 20A during 5minutes (Power on the aircraft)
Measure and record I, V and Temperature
3 consecutive
APU starts
1st APU start for 20s
Measure and record I, V and Temperature
2nd APU start for 20s
Measure and record I, V and Temperature
3rd APU start for 20s
Measure and record I, V and Temperature
ΔT = 60s ΔT = 60s
Charge the battery until 80% SOC
When SOC=80%
Measure and record I, V and Temperature
End Start the flight
Figure 2-2 Algorithm of a flight simulation (Process to test the battery)
2.2.2 Conditions for a successful APU start
Two different APU start curves have been used. The Li-Ion S1, Li-Ion S2 and Ni-Cd batteries used the model based on the DC starter motor. The Li-Ion S2N used the model based on the Starter generator.
The following conditions only apply to the S1, S2 and Ni-Cd batteries. For an APU start to be considered successful it has to meet the following criteria:
• Minimum voltage at the battery connector: 12V; • Inrush current: minimum 500A and maximum 1100A.
The following conditions only apply to the Li-Ion S2N battery. For an APU start to be considered successful it has to meet the following criteria:
• Minimum voltage at the battery connector: 17V; • Inrush current: minimum 200A and maximum 500A.
2.2.3 APU start curves with DC starter motor
Figure 2-3 APU start current curve for S1, S2 and Ni-Cd batteries (DC starter motor)
2.2.4 APU start curves with Starter Generator
Figure 2-5 APU start current curve in use for S2N battery (Starter Generator)
Figure 2-6 Zoom-in APU start current curve in use for S2N battery
The differences with the previous APU curve used for the S1, S2 and Ni-Cd batteries are a lower current peak at the beginning with an APU lasting longer. The APU start is now lasting
60s for the S2N battery. The APU max current is now 376A instead of the previous 750-800A.
2.3 Batteries characteristics
Presentation of the batteries characteristics and differences.
2.3.1 Batteries characteristics comparison
Table 2-1 Batteries characteristics (Source: Manufacturer user manual)
Definition Ni-Cd Li-Ion
Rated capacity at 1-hour rate 43Ah 45Ah
Nominal Voltage 24V 25V Operating Temperature -40°C to +70°C -15°C to +71°C Weight 38.4kg (84.7lb) 30.2kg (66lb) Height 262.1mm (10.325in) 336mm Width 305.5mm (12.03in) 350mm Length 268.4mm (10.57in) 339mm
2.3.2 Technical differences between Li-Ion and Ni-Cd
The following sentences will explain the major differences between the Li-Ion and the Ni-Cd, it is not an in-depth review of the differences. The Li-Ion is equipped with a BMS (Battery Management System), one of its features, is to know in real time its SOC (State of Charge). The Li-Ion has also a higher energy density compared to the Ni-Cd, implying lighter weight for the same embedded energy. On the other hand, the decades long use of the Ni-Cd battery, still currently in use, shows its reliability as a technology.
The data available in the table 2-1 shows that the Li-Ion is 8kg lighter than the Ni-Cd. Despite the higher energy density of the Li-Ion, the fact that it has to add the BMS on the top
of the cells, makes the Li-Ion battery bigger than the Ni-Cd battery. The data also show a smaller temperature operating range for the Li-Ion compared to the Ni-Cd.
2.4 Bench test
To recreate the conditions the battery will encounter during its service time, a bench test has been built.
This bench test is composed of: 1) Battery,
2) Monitoring software (LabVIEW). During the APU starts, the data are recorded at a frequency of 4kHz and during the regular phases at 1Hz;
3) Environmental test chamber: creates the surrounding temperatures that the batteries will encounter inside the aircraft, ranging from -56°C to 70°C (Thermotron XSE-600-15-15); 4) Data acquisition system: this computer allows the measure, control and save the data
from the tests (NI PXI 1078);
5) TRU (Transformer Rectifier Unit): used to recharge the battery ;
6) Programmable DC load: used to simulate the APU start of the aircraft (AMREL PLW24K 120-1500);
7) Several current, voltage and temperature sensors to know the exact values at every important points of the bench test.
Figure 2-7 Equipment for the tests
6
1
3
5
4
2
CHAPTER 3 NI-CD 3.1 Ni-Cd Introduction
The purpose of this chapter is to present the performance test results of the Ni-Cd battery. All the details about the test procedure are available in chapter 2.
3.2 Flight results at different temperatures 3.2.1 Flight at -40°C
None of the 5 tested flights succeeded. At -40°C, two SOC levels have been tested: 40% and 70%.
• For the flights at 70% SOC:
They all failed because the voltage was too low, on average around 2V at the lowest point. The voltage should be above 12V during the APU starts to be considered realistic in real operation. On the other hand, the current peaks were above the required minimum 500A. See charts 3-1 and 3-3 for more details.
• For the only flight at 40% SOC:
It failed because both the voltage and current were below the minimum threshold. See charts 3-2 and 3-4 for more details.
The chart 3-1 shows the voltage drop during the three APU starts (red curve) for the 70% SOC level. On the third APU start, the voltage reaches 2.7V. The voltage of the three APU starts is below the minimum threshold of 12V.
Figure 3-1 Voltage curve during the APU starts (-40°C, 70% SOC)
The chart 3-2 shows the voltage drop during the three APU starts (red curve) for the 40% SOC level. On the third APU start, the voltage reaches 0.2V. The voltage of the three APU starts is below the minimum threshold of 12V.
The chart 3-3 shows the current curve during the three APU starts (purple curve) for the 70% SOC level. All three APU starts are above 750A. The three APU starts are successful from a current point of view only.
Figure 3-3 Current curve during the APU starts (-40°C, 70% SOC)
The chart 3-4 shows the current curve during the three APU starts (purple curve) for the 40% SOC level. The first current peak only reaches 400A and then decreases for the last two APU starts. The current of the three APU starts is below the minimum threshold of 500A, therefore it is a failure.
3.2.2 Flight at -20°C
At this temperature, 10 flights have been tested at three different SOC levels: 40%, 70% and 90%.
• Flight at 40% SOC and -20°C:
Five flights at 40% SOC have been carried out, all of them have failed. The first flight failed only because of the voltage, which was below the minimum threshold. On the other hand, the current peaks met the requirements of the TDS, minimum 500A. The last flight tested at -20°C and 40% SOC failed because both the current and the voltage during the APU starts were below the minimum threshold. As the tests advanced, the battery had more and more difficulty to do an APU start at -20°C and 40% SOC. See the charts from 3-5 to 3-8 for more details.
The two charts 3-5 and 3-6 show the first flight tested at -20°C and 40% SOC (Cycle 1 flight 1), which successfully passed the APU starts from a current point of view. On the other hand, it failed the APU starts from a voltage point of view. The voltage of the three APU starts is below the minimum threshold of 12V.
Figure 3-5 Current curve (purple) of the first flight tested at -20°C and 40% SOC
Figure 3-6 Voltage curve (red) of the first flight tested at -20°C and 40% SOC
The two charts 3-7 and 3-8 show the last flight tested at -20°C and 40% SOC (Cycle 3 flight 6), which failed to conduct the APU starts from a current and voltage point of view, both were below the minimum threshold.
Figure 3-7 Current curve (purple) of the last flight tested at -20°C and 40% SOC
• Flight at 70% SOC and -20°C:
Four flights at 70% SOC have been carried out, all of them have failed. The tests request to conduct three consecutive APU starts, during the tests at -20°C and 70% SOC the failure happens at the 2nd or 3rd APU start, when the voltage goes under the 12V threshold. See graphs 3-9 and 3-10 for more details. The current peaks are always above 500A.
Figure 3-9 Current curve during the APU starts (-20°C, 70% SOC)
• Flight at 90% SOC and -20°C:
At -20°C, only the flight at 90% SOC succeeded to pass the three APU starts. As shows the chart 3-11, the voltage level is above the minimum threshold, between 17V and 18V, therefore the voltage is not a parameter causing a failure in this scenario.
Figure 3-11 Voltage curve during the APU starts (-20°C, 90% SOC)
3.2.3 Flight at 0°C
At this temperature, 3 flights have been tested at three different SOC levels: 70%, 80% and 90%. One of them has failed.
• Flight at 70% and 90% SOC: both flights successfully started the APU.
• Flight at 80% SOC: this test failed. However, this flight almost succeeded because the voltage was at 11.9V and 10.9V during the 2nd and 3rd APU start respectively. The failure happened during the 2nd APU because the voltage was below the minimum threshold of 12V. See graph 3-12 for more details.
The reason why only the flight at 80% SOC failed, is coming from the internal temperature which was at -20°C and not at 0°C as for the two other flights. The flight at 80% SOC stayed on the ground only for 20min and not the usual 10h before the APU starts, therefore the battery did not have the time to sufficiently heat up to reach an internal temperature of 0°C.
Figure 3-12 Voltage curve during the APU starts (0°C, 80% SOC)
3.2.4 Flight at 20°C
Only one flight has been tested at this temperature with a SOC of 70%. This flight successfully passed the three APU starts.
3.2.5 Flight at 30°C
Two flights have been tested at this temperature with a SOC of 70% and 90%. Both flights successfully passed the three APU starts.
3.2.6 Flight at 50°C
At this temperature all the flights successfully passed the three APU starts. The following SOC have been tested at 50°C: one flight at 40%, three flights at 80% and four flights at 90%.
3.2.7 Flight at 70°C
One of the three flights tested at 70°C failed to successfully pass the three APU starts. • Flight at 70% and 80% SOC: both flights successfully started the APU.
• Flight at 40% SOC: this flight failed to pass the 3rd APU start, since the voltage was below the minimum threshold of 12V. See graph 3-13 for more details.
3.2.8 Summary of the flight results at different temperatures
In the table 3-1, the columns failure current and failure voltage mean the current and/or the voltage were below the minimum threshold, therefore leading the test to a failure. See the previous chapter for more details on each result presented in the table 3-1.
Table 3-1 Flight results at different temperatures
Temperature SOC Result Failure current Failure voltage
-40°C 40% Failure Yes Yes
70% Failure No Yes
- 20°C
40% Failure No / Yes Yes
70% Failure No Yes 90% Success No No 0°C 70% Success No No 80% Failure No Yes 90% Success No No 20°C 70% Success No No 30°C 70% Success No No 90% Success No No 50°C 40% Success No No 80% Success No No 90% Success No No 70°C 40% Failure No Yes 70% Success No No 80% Success No No
3.3 Observations
3.3.1 Temperature influence on the voltage
The chart 3-14 displays the battery voltage at different temperatures with a 70% SOC. The higher voltage 26.32V is at -20°C and the lower voltage 25.3V is at 70°C. The nominal voltage of the battery is 24V. Between the hottest and the coldest flights, -40°C and 70°C respectively, there is difference of 1V. The voltage at 70°C is 1V lower than the voltage at -40°C.
3.3.2 Temperature influence on the voltage during the APU starts
The chart 3-15 displays the battery voltage during the APU starts at different temperatures with a 70% SOC. The lower the temperature, the lower the voltage during the APU starts. Each line going down represents an APU start, there are three APU starts per temperature level. The flights at -40°C and -20°C have failed.
3.3.3 SOC influence on the voltage
The charts from 3-16 to 3-18 display the battery voltage at different SOC level with a temperature of 50°C. The higher the SOC level, the higher the voltage. At 40% SOC the voltage is at 25.2V and at 90% the voltage is at 26.2V. The nominal voltage of the battery is 24V.
Table 3-2 Battery voltage at different SOC and 50°C
SOC level Voltage
40% 25.2V 80% 25.9V 90% 26.2V
Figure 3-16 Battery voltage at 40% SOC and 50°C
Figure 3-17 Battery voltage at 80% SOC and 50°C
3.4 Statistics about the flights results 3.4.1 Statistic: SOC VS Temperature
The table 3-3 presents the data about the success rate to conduct three consecutive APU starts. The test at 80% SOC and 0°C failed because the aircraft only stayed grounded for 20min. When the aircraft is on the ground only for 20min, the battery does not have the time to heat up and its internal temperature was -20°C. Therefore, the battery capabilities to start the APU are limited by its internal temperature and failures can happen. More details about this flight are available in the chapter Flight results at different temperatures, section Flight at 0°C. Detailed statistics are available in appendix.
Table 3-3 Success rate of each SOC level according to the surrounding temperature (If there is an empty cell in the table, this means no tests have been carried out at
this temperature and SOC level) Ni-Cd: Success (%) Temperature (°C) -40 -20 0 20 30 50 70 SOC (%) 40 0 0 100 0 70 0 0 100 100 100 100 80 0 100 100 90 100 100 100 100
The chart 3-19 displays the data of the previous table.
Figure 3-19 Success rate of each SOC level according to the surrounding temperature (some data are not visible on the chart because they are superimposed)
3.4.2 Statistic: Success rate VS Temperature
The graph 3-20 displays the success rate of each temperature used for the tests, without taking into account the SOC. It is another way to display the data from the section 3.4.1.
Figure 3-20 Success rate VS Temperature
3.4.3 Statistic: Success rate VS SOC
The graph 3-21 displays the success rate of each SOC level used for the tests, without taking into account the different temperatures. It is another way to display the data from the section 3.4.1.
3.5 Ground phase of 20 minutes
During the ground phase, the aircraft can stay on the ground for 20 minutes or 10 hours at a designated temperature. Therefore, when the aircraft is staying on the ground for only 20min at a new surrounding temperature, the internal temperature of the battery does not have the time to significantly change. For example, during the cycle 3 flight 10, the internal temperature of the battery was at 22.6°C at the beginning of the 20min period on the ground and at 16.3°C at the end, while the surrounding temperature was at -20°C. Thus, it can be observed that during this short period of time, the battery has only decreased its internal temperature by 6.3°C. See the chart 3-22 for more details.
Figure 3-22 Internal temperature during a transit flight of 20 minutes at -20°C (cycle 3, flight 10)
The main point to remember in this chapter is, in real conditions, after a flight at -56°C the internal temperature of the battery will only increase by a few degrees while staying on the ground for only 20min. Therefore, the battery can have difficulties to conduct three APU starts, since it is known that the battery performances are reduced at low temperatures.
The table 3-4 presents the internal temperatures of the battery at the end of the flight sequence at -56°C.
Table 3-4 Internal temperatures of the battery at the end of the flight sequence at -56°C
Flight sequence Flight time Internal temperature at the end Short 96 min Between 0°C and 10°C
Medium 210 min -20°C
Long 618 min -45°C
3.5.1 Result of the tests with a ground phase of 20 minutes
At 90% SOC, all the flights successfully passed the three consecutive APU starts.
At 80% SOC, the flight almost succeeded to pass the three APU starts, it failed because the voltage was slightly below the 12V threshold. During the 2nd APU start the voltage was at 11.9V and during the 3rd APU at 10.9V. The internal temperature of the battery was -20°C. See graph 3-23 for more details.
Figure 3-23 Voltage curve during the APU starts after a transit flight of 20 minutes (80% SOC, internal temp -20°C)
At 40% SOC, all the flights failed. For this case, one of the potential reasons for failure is coming from the SOC, not the temperature, because the battery does not have enough energy to fulfil the demand. The internal temperature of the battery was at 25°C while the surrounding was at a -20°C. More details about these flights are available in the chapter Flight results at different temperatures, section Flight at -20°C.
3.6 Flights with 80%+ SOC
For the flights with “real” SOC of 80% and 90%, 12 flights have been tested and only 1 flight has failed to pass the three APU starts (flight at 80% SOC and 0°C). Furthermore, only one flight has been tested at -20°C, all the other tested flights were at 0°C and above, up to 70°C. These flights are characterised as real because the TDS says “No take-off unless SOC is 80% (rule in STD DO311)”.
3.7 Capacity check after 32 flights
The battery has lost 17.3% of its capacity after 32 flights. With a discharge current of 43A, the battery now last 2977s instead of 3600s. Which gives the battery a capacity of 35.57Ah instead of 43Ah. The table 3-5 compares the data of the brand new battery and the same battery after 32 fights with no maintenance.
Table 3-5 Battery capacity - New VS after 32 flights
Brand new battery Battery after 32
flights
Capacity (Ah) 43 35.57
Capacity (%) 100 82.72
The graph 3-24 presents the capacity checks of the new battery, directly after unpacking it and the same battery after 32 flights. The battery is considered empty once it goes under 20V.
Figure 3-24 Capacity check- New battery VS After 32 flights
3.7.1 Procedure used for the capacity check
The capacity check has been done according to the procedure available in the component maintenance manual from the battery manufacturer. First, the complete discharge, the residual capacity is discharged down to 20V, then the battery is placed with shorting resistors overnight. After this step, the charge starts, which means charging first at 21.5A until the battery reaches 31V and then for the second step, the battery had been charged for 3h30 at 4.3A. At the end of the second step the battery was at 33.5V, equivalent to 1.675V per cell.
3.8 Conclusion
During the flight simulations, the Ni-Cd battery has executed 32 flights, 16 were successful and 16 failed. Among the failed tests, three of them failed with less than 1V below the minimum threshold. The main source of failure for all the flights was the voltage.
The cold temperatures reduce the battery performances at almost any level of SOC. The battery can handle the hot temperatures more easily, from 0°C to 70°C.
The battery has lost 17.3% of its capacity after 32 flights. Now, if the fact that the battery has lost capacity over time is put aside and if just the tests with a SOC of 80% and more are considered; it can be seen that only one flight has failed to conduct three consecutive APU starts. This flight which failed, almost succeeded to pass the three APU starts. This means, even with this capacity loss, the battery has still enough energy to conduct three consecutive APU starts, since for the take-off it is mandatory to have a minimum of 80% SOC.
One of the potential reasons to explain the loss in capacity is that the battery is aging faster with the high currents used to start the APU and the extreme temperatures.
According to the test results, a recommendation for the Ni-Cd would be to add a heating device around the battery, thus the battery will never be too cold to start an APU. Since, after a flight at -56°C followed by a transition period of only 20min on the ground, the battery does not have the time to sufficiently heat up to start an APU.
CHAPTER 4 LI-ION 4.1 Li-Ion Introduction
The purpose of this chapter is to present the performance test results of the Li-Ion battery. The Li-Ion batteries have been tested in the following order: First the S1, then the S2 and to finish the S2N battery. This chapter on the Li-Ion battery has been started by Romain Bonnin, with the Li-Ion S1 & S2, during his master thesis and then I, David Herzog, took over the Li-Ion project with the S2N. I have continued and updated the content of the complete Li-Ion study, with the test results of the three Li-Ion batteries.
4.2 Observations
The observations made in this chapter can be applied to the S1, S2 and S2N batteries.
4.2.1 Temperature influence on the voltage
The tests have showed the great influence of the temperature on the battery voltage. According to the internal temperature of the battery, the voltage changes. In the figure 4-1, 5 different voltages are displayed. For each curve the SOC of the battery is fixed at 70%. The battery has spent 10 hours (cold soak) at a designated temperatures before the measurement. The figure 4-1 compares 5 different temperatures.
Figure 4-1 Battery voltage at different temperatures (SOC at 70%)
According to the graph 4-1grap, the voltage dropped of 0.8V between 0°C and -40°C. A voltage drop of 0.8V means a drop of 114mV per cell (VL30P cell operates between 4000mV and 3300mV). This greatly reduces the capacity of the cell and represents more than 16% of its charge state (1mV = 0.143 % SOC of a cell).
4.2.2 Temperature influence on the voltage during an APU
The temperature influences significantly the performance of the battery. If the battery is used at high temperatures, it will accelerate the reaction of cells and can cause an exothermic reaction. On the other hand, if the cells work at excessively low temperatures, the electrolyte may begin to crystallize and depolarization could happen. The figure 4-2 shows the voltage during an APU start. The battery spend 10h on the ground at a specific temperature before the APU starts are performed. All tests were made with a battery charged at 40% SOC. Only 2 APU starts are displayed, since the chart 4-2 is only here to show the influence of the
Temps (s) 104 3.25 3.3 3.35 3.4 3.45 3.5 3.55 V 25.5 26 26.5 27 C1V6(-40°C) C1V10(-20°C) C3V2(0°C) C1V18(20°C) C1V2(30°C) Time (s)
temperature on the voltage for each test at different temperatures. For all the tests, the current peak corresponding to the lowest voltage value is 745A. The blue line below 20V is corresponding to the flight at 70°C.
Figure 4-2 Voltage during an APU start at different temperatures (SOC at 40%)
These voltage curves illustrate the influence of the temperature on the performance of the battery. Before the APU starts, there is a difference of 5.7V between the flight at 70°C and the flight at -40°C. During this period, the battery was discharged at 20A for 5 min. During the APU starts, the battery behavior is relatively similar to when the battery was at 20°C and above. Between 30°C and 70°C there is a small difference of 0.35V. It can be seen that it is
more difficult to perform an APU start at negative temperatures. When the battery is tested at -20°C, the voltage drops by 7V when the discharge current peak reaches its max value of
745A. On the other hand, for a flight at 30°C, the voltage drop is 3.13V. Moreover, the test at -40°C failed. At negative temperatures, the cells impedance significantly increase, which
result in high voltage drop across the battery cells. Time (s)
4.2.3 Voltage drop during an APU start at different SOC
Figure 4-3 Voltage drop during an APU start at different SOC (ambient temperature at 0°C)
The open circuit voltage changes according to the battery state of charge. However, it is interesting to see the voltage difference when the same current peak is applied at different SOC. The figure 4-3 shows the battery voltage drop during an APU start with an ambient temperature at 0°C and with four different SOC: 40 %, 70 %, 80% and 90%. During the APU start, with an initial SOC of 90 %, the battery voltage dropped by 5.07V while at 40% SOC it dropped by 5.11V. Therefore, the voltage drop difference is negligible between the different SOC during an APU start. Furthermore, the internal temperatures of each SOC test differ from 1 or 2°C, which can explain the small difference in the voltage drop. However, the influence of the SOC on the voltage can be seen before the APU start. There is a 1.34V voltage difference between the battery charged at 90% and the one at 40 %.
V
4.2.4 SOC drop during APU starts at different temperatures
Figure 4-4 SOC drop during the APU starts at different temperatures (initial SOC at 40%)
According to the figure 4-4, the SOC drop is more substantial when the battery is at high temperatures. After the three APU starts, the flight at -20°C lost 14% of SOC whereas at 70°C, the battery has lost 20 %. For all temperatures, the APU starts were completed entirely. It was found previously, that the voltage is increasing at high temperature, above the reference voltage. Therefore in this test, the voltage is artificially increased by the temperature at 70°C, which makes the voltage drop more important at high discharge rate. This can explain why the SOC drop is more important at 70°C compared to -20°C.
Temps (s) 104 3.6 3.61 3.62 3.63 3.64 3.65 SOC 20 25 30 35 40 45 C2V1(-40°C)C1V1(-20°C) C2V21(0°C) C3V5(30°C) C1V5(50°C) C2V5(70°C) X: 3.601e+04 Y: 39 X: 3.601e+04 Y: 41 X: 3.65e+04 Y: 19 X: 3.649e+04 Y: 27 Start 1 Start 2 Start 3 Time (s)
4.2.5 Charging time after the APU starts at different temperatures
As mentioned earlier, before the takeoff, the pilot has three attempt to start the APU otherwise the aircraft will be barred from take-off. Once started, the batteries must be recharged to 80 % SOC. This period must be as short as possible. According to the standards, a battery must be able to be recharged to 80% in less than 1 hour with an initial SOC of 20%.
Figure 4-5 Charging time after the APU starts at different temperatures (initial SOC: 70%)
The figure 4-5 shows that the battery charging time lasted longer during the test at -20°C. At -20°C, charging the battery takes 85 minutes for the SOC to increase by 23%, while for a flight higher than 0°C it takes only 18 minutes to increase the SOC by 30%. The difference in charging time, is due to the charging current. During a flight at -20°C the battery is charged with a current of 10A, while for higher temperatures, the charging current starts at 60A and gradually decreases when reaching the end of the charge. During our tests, we charged at constant voltage and the battery BMS controlled the charging current.
Time (s)
4.2.6 Thermal transfer
The graph 4-6 shows the thermal transfer of the battery at different temperatures. Staple curves represent the temperature of environmental chamber and the continuous curves represent the internal temperature of the battery. For each temperature level, it takes more than 8 hours for the internal temperature of the battery to be close to the chamber temperature at + or -4°C. The battery has a high thermal inertia.
Figure 4-6 Thermal transfer at different temperatures (SOC at 70%)
Température (°C)
4.3 Statistics about flights results 4.3.1 S1 Battery
The table 4-1 presents the data about the success rate to perform three APU starts for the battery S1. For the 20°C and 30°C temperatures, the success rate was not 100% everywhere since the aircraft was only staying grounded for 20min. When the aircraft is on the ground only for 20min, the battery does not have the time to heat up and its internal temperature stays between -14°C and -26°C. Therefore, the battery capabilities to perform three APU starts are limited by its internal temperature and failures can happen.
Table 4-1 Battery S1 - Success rate of each SOC level according to the surrounding temperature (If there is an empty cell in the table, this means no tests have been
carried out at this temperature and SOC level.)
S1 - Success (%) Surrounding temperature (°C)
-40 -20 0 20 30 50 70 SOC (%) 40 28 100 80 70.8 100 70 100 100 100 100 80 100 80 80 100 90 100 100 100 100
The chart 4-7 displays the data of the previous table.
Figure 4-7 Battery S1 - Success rate of each SOC level according to the surrounding temperature (some data are not visible on the chart because they are superimposed)
4.3.2 S2 Battery
The table 4-2 presents the data about the success rate to perform three APU starts for the battery S2. The test spectrum has been broadened on the S2 battery. Therefore, more tests have been carried out at -35°C, -30°C and -25°C. However, several tests have been carried out only once, thus, some results in the table 4-2 must be taken with precaution. More details are available in appendix.
Table 4-2 Battery S2 - Success rate of each SOC level according to the surrounding temperature (If there is an empty cell in the table, this means no tests have been
carried out at this temperature and SOC level.) S2 - Success (%) Surrounding temperature (°C)
-40 -35 -30 -25 -20 0 20 30 50 70 SOC (%) 40 0 57.14 100 0 70 0 100 100 100 80 100 100 80 100 100 0 90 100 100 100 100
The chart 4-8 displays the data of the previous table.
Figure 4-8 Battery S2 - Success rate of each SOC level according to the surrounding temperature (some data are not visible on the chart because they are superimposed)
4.3.3 S2N Battery
The table 4-3 presents the data about the success rate to perform three APU starts for the battery S2N. The tests for the S2N battery have been made specifically to assess the cold temperatures. For the S2N battery, the APU start curve has been changed and the max APU current is lower compared to the APU curve used for the S1 and S2 batteries.
Table 4-3 Battery S2N - Success rate of each SOC level according to the surrounding temperature (If there is an empty cell in the table, this means no tests have been
carried out at this temperature and SOC level.) S2N Success (%) Surrounding temperature (°C) -40 -20 0 20 30 50 70 SOC (%) 40 70 0 57.14 100 80 100 90 100 100
The chart 4-9 displays the data of the previous table.
Figure 4-9 Battery S2N - Success rate of each SOC level according to the surrounding temperature (some data are not visible on the chart because they are superimposed)
ATTENTION about the statistics results: Each SOC level has not been tested under the same conditions, thus, not the same amount of flights at the same temperatures. See annex for more details.
4.4 Issues
4.4.1 Transit flight of 20 minutes
On landing, a new room temperature is set and the aircraft can stay on the ground for 10 hours or 20 minutes (transit flight) according to the flight mission. In case of a ground time of 20 minutes after a previous test at negative temperature, this ground time period is not long enough for the battery internal temperature to get closer to the new room temperature. For example, during a flight at -20°C and 70% SOC, the aircraft was on the ground for 10 hours at -20°C and in flight for 3h40 at temperatures between -56°C and -20°C. Once the flight finished, the environmental chamber was set at 20°C to start the next flight. The figure 4-10 shows that the internal temperature of the battery on landing was -33°C and increased by 6°C during the 20 minutes of ground time at 20°C, to reach an end temperature of -26°C. During the next flight, after the first APU start, the battery was disconnected. This failure occurred since the internal temperature of the battery was too low, limiting its performances.
Figure 4-10 Internal temperature during a transit flight of 20 minutes at 20°C (cycle 1, flight 11) 0 500 1000 1500 2000 2500 -33 -32 -31 -30 -29 -28 -27 -26 X: 63 Y: -33 T em per atur e (° C) Temps (s) X: 1408 Y: -26 Time
The figure 4-11 shows an APU start stopped by the BMS at 440A after 3 seconds. When the current peak reached 744A, the battery voltage decreased to 11.89V, with an internal temperature of -26°C. The internal resistance increases significantly when the battery is at a low temperature. Moreover, the SOC was high (80%) and it could not be a reason which generated the voltage drop. This scenario was executed many times but never succeeded. Then, according to the results, when the internal temperature of the battery is below -18°C, it is difficult for the battery to perform three APU starts. Other transit flights with different scenario also did not succeed. More results are available in appendix.
Figure 4-11 Current, voltage, temperature and SOC during an APU start failure (cycle 1, flight 11: -20°C and 80% SOC)
1505 1505.5 1506 1506.5 1507 1507.5 1508 1508.5 1509 0 100 200 300 400 500 600 700 C our an t ( A ) T ens ion (V ) , S O C & TB atte ry °C Temps (s) X: 1506 Y: 744.6 X: 1508 Y: 441.1 X: 1508 Y: -26 X: 1508 Y: 73 X: 1506 Y: 11.89 X: 1508 Y: 14.66 Current Tin Voltage SOC Time (s)