HAL Id: tel-01508650
https://tel.archives-ouvertes.fr/tel-01508650
Submitted on 14 Apr 2017
HAL is a multi-disciplinary open access archive for the deposit and dissemination of sci-entific research documents, whether they are pub-lished or not. The documents may come from teaching and research institutions in France or abroad, or from public or private research centers.
L’archive ouverte pluridisciplinaire HAL, est destinée au dépôt et à la diffusion de documents scientifiques de niveau recherche, publiés ou non, émanant des établissements d’enseignement et de recherche français ou étrangers, des laboratoires publics ou privés.
applications spatiales et professionnelles
Loïc Braun
To cite this version:
Loïc Braun. Composants à ondes élastiques de surface pour le filtrage à gabarits maîtrisés aux fréquences radios pour applications spatiales et professionnelles. Acoustique [physics.class-ph]. Uni-versité de Franche-Comté, 2015. Français. �NNT : 2015BESA2020�. �tel-01508650�
Thèse de Doctorat
é c o l e d o c t o r a l e s c i e n c e s p o u r l ’ i n g é n i e u r e t m i c r o t e c h n i q u e s
U N I V E R S I T É D E F R A N C H E - C O M T É
TH
`ESE pr´esent´ee par
C
ARINE
C
AROLINE
CRIDELICH
pour obtenir le
Grade
de Docteur de
l’Universite´
de Franche-Comt´e
Sp ´ecialit ´e : Sciences pour l’ing´enieur
Influence
of restraint systems during an automobile
crash
Prediction
of biomechanical injuries for frontal impact sled tests based on
data
mining
Thèse soutenue le 17 décembre 2015
V ´ERONIQUEBERGE-CHERFAOUI Rapporteur Maˆıtre de conf ´erences HDR,
Universit ´e de Technologie de
Compi `egne
LATIFAOUKHELLOU Rapporteur Directrice de recherche, IFSTTAR
NICOLASM ´EGER Examinateur Maˆıtre de conf ´erences HDR, Universit ´e de Savoie, IUT d’Annecy
SERGEFENET Examinateur Maˆıtre de conf ´erences, Universit ´e
Claude Bernard Lyon 1
NADINEPIAT Examinateur Professeur des Universit ´es, ENSMM, Besanc¸on
HERVE´ GUYENNET Examinateur Professeur des Universit ´es, UFC,
Besanc¸on
NOURREDINEZERHOUNI Directeur de th `ese Professeur des Universit ´es, ENSMM, Besanc¸on
EMMANUELRAMASSO Co-directeur de th `ese Maˆıtre de conf ´erences, ENSMM, Besanc¸on
Thèse de Doctorat
é c o l e d o c t o r a l e s c i e n c e s p o u r l ’ i n g é n i e u r e t m i c r o t e c h n i q u e s
U N I V E R S I T É D E F R A N C H E - C O M T É
n
Influence of restraint systems
during an automobile crash
Prediction of biomechanical injuries for frontal impact sled
tests based on data mining
In this section, I would like to thank all my colleagues and managers who contributed to my thesis but also the persons who were indirectly involved, sometimes without knowing it.
First of all, my gratitude goes to my supervisor, Prof. Dr. Noureddine ZERHOUNI, for giving me the chance to write this project with some specials conditions imposed by my actual situation (engineer post in Germany, thesis in parallel). And also many thanks to Dr. Emmanuel RAMASSO for his supervision and for having trusted me in spite of my rather little knowledge in Data Mining. But also for his devotion and his patience in spite of my frustrations.
The opportunity to write this thesis in an unknown field, the Data Analysis, came from Dr. Konrad ELSASSER¨ , Senior Manager System Engineering Application & Simulation Global (TRW Automotive GmbH Alfdorf), who accepted that I worked on this subject in parallel to my current engineering post, but also (I hope) who supported me for believing in my chances to conduct this project to the end. I am thankful for the help and support offered by Dr. ELSAESSERin his role of ”permanent” supervisor.
Many thanks also to Christophe DIELEMANS(ENSMM Besanc¸on), who helped me find a fitting French team for my thesis, to Ralf WAELDCHENand Torsten SASSMANNSHAUSEN,
respectively former and actual TRW Managers Systems Engineering, to Dr. Swen
SCHAUB, TRW Senior Manager Engineering Strategy & Communication, for his helpful comments about the papers and to Manfred PREHN, TRW European Patent Counsel, for his help in the issuing of the contract and papers. I would also like to thanks my German tutors, Dr. Bernd WEILERund Dr. Michaela KOLBEfor their contribution and their advices. And this thesis would not be finished without the help of Pablo JUESAS CANO, Mehdi EL HANOUNE and Kuevi EKUE-HETTAH(Fabrice for those who know him), who actively participated in the Matlab programming. A wink at Pablo who adjusted himself to my feminine wishes for the design of the Graphical User Interface. Also thanks to Tobias BEISSWENGERfor doing the laborious work by raising all the parameters data of the sled tests.
I would also like to thank the E2/A assistant engineering, Tanja DITTBRENNER, with whom I had some laughs booking my hostel in Island. She succeeded in managing all the administrative problems that I gave her (strange invoices from Island, airline strike,...) And I do not agree with her, I am sure that these type of problems do not just happen to me !
Finally, I would like to thank Lorraine MC CORMACK-HERKOMMER, who proof read my thesis to correct all my English errors and to try to understand what I wanted to say. I hope I did not make too many spelling mistakes on this page of acknowledgments.
To begin this thesis, I present inChapter 1: Introduction and research objectives the general context of the research. We will see some generalities about passive safety and legislation which allow the evaluation of the safety car. After that, a presentation about the crash tests in general, then the dummies used in order to simulate the injury severity of the car occupants during a frontal impact crash. The dummy instrumentation that helps measure this injury severity will be also explained. The last section is focused on the requirements of the firm and thus of the thesis’ objectives.
I then present the literature inChapter 2: State-of-the-art. After a review of the current researches in automobiles crashes, the literature review is focused on the Knowledge Discovery in Databases (KDD) process and especially the clustering and classification methods. The literature review for these two methods has been focused on the auto-mobile domain, especially safety systems and reduction of the injury severity during a road accident. It will help understand the state-of-the-art in data analysis, data mining methods, clustering and classification applying in the field of automobile safety.
I finally present the core of this thesis fromChapters 3 until 6.
As the benefits of the KDD has been described, I continue with the application of this process on the crash tests data through Chapter 3: Sled tests classification through k-NN method. Firstly, a short explication of the available data will be done. In fact, we have to differentiate the inputs (parameters of the restraints systems available during the crash) and the outputs (dummy biomechanical values measured through high tech sensors in order to evaluate the injury severity of the car occupant). The KDD process will be applied on the inputs, i.e. on the parameters of the airbags, seat belts and dummy position. These parameters have been chosen for their eventual influence on the outputs. A data mining method, the k nearest neighbour, has been also applied in order to find the nearest sled test included in the database to a new sled test. Section 2 regroups the validation for the different used algorithms. The first one helps replace some parameters missing values and the following validations are focused on for the k-nearest neighbour which allows to have a first idea of the expected score inEURO NCAPand FMVSS NR.208. The next chapter,Chapter 4: Clustering of the dummy biomechanical values, is fo-cused on the outputs, i.e. the dummy biomechanical values. In order to find correlations between the inputs and outputs, the outputs have been ranged into clusters. I present in Section 1 the outputs’ clustering obtained on the passenger side for the EURO NCAP rating. The results for the driver side will be also resumed but the graphs are gathered in Appendix D. I continue with the next section, Section 2 which is based on the first section but for theFMVSS NR.208legislation. This section also presents only one configuration for the passenger side (HIII 50th dummy belted) and the results for the others configurations and the driver side. The additional graphs can be found in Appendixes E and F.
Chapter 5: Parameters’ influence through decision trees proposes an analysis of the parameters’ influence for the two ratings: the EURO NCAPand the US NCAP. After a
data description, the methodology is discussed and the CART algorithm is applied, using the parameters as inputs and the clusters obtained in Chapter 4 as outputs. Only the relevant dummy parts are studied in this chapter, it means that only the results for the dummy chest for the EURO NCAPare presented and those for the dummy head and neck are resumed in Appendix G. The dummy femurs are for this test configuration not relevant because of the absence of a knee bag. All the four parts of the HIII 5th dummy influence the U.S. rating score and for this reason, is widely discussed in this Chapter.
Finally Chapter 6: General conclusion summarises the results obtained during this thesis and their benefits for the passive safety engineers in their daily work. Some per-spectives with the application of Variational Bayesian methods are also discussed in order to improve the data clustering and the results. This project aims at being a starting point for the engineers in their objectives to improve the car safety through the amelioration of the restraint systems.
1 Introduction and research objectives 1
1.1 Background on passive safety . . . 1
1.1.1 Passive safety and accident’s causes . . . 1
1.1.2 Legislation and ratings . . . 2
1.1.2.1 ECE regulations and Euro NCAP rating . . . 4
1.1.2.2 FMVSS Nr.208 regulation and US NCAP rating . . . 5
1.1.3 Crash tests dummies and injuries criteria . . . 10
1.1.3.1 Description of the sled test facility and measured data . . . 10
1.1.3.2 Crash test dummies and instrumentation . . . 10
1.1.3.3 Description of the injuries criteria for the dummy body parts 13 1.1.3.4 Passive restraint systems . . . 17
1.2 Research objectives . . . 18
2 State-of-the-art 21 2.1 Methods for crash data analysis . . . 21
2.1.1 Current researches in automobile crashes . . . 21
2.1.1.1 Clustering methods . . . 22
2.1.1.2 Classification methods . . . 24
2.1.2 Synthesis of the research bibliography . . . 26
2.2 The KDD process and data mining methods . . . 26
2.2.1 Description of the KDD process . . . 27
2.2.2 Unsupervised learning through the clustering . . . 29
2.2.2.1 The Gustafson-Kessel algorithm as unsupervised learning 31 2.2.2.2 Fuzzy clustering . . . 31
2.2.2.3 The GK algorithm . . . 35
2.2.2.4 The Davies Bouldin Index . . . 37
2.2.2.5 Generalities . . . 37
2.2.2.6 Davies-Bouldin Index . . . 39
2.2.3 Supervised learning through the classification . . . 40 ix
2.2.3.1 Background of the basic tree model . . . 41
2.2.3.2 CART as supervised learning . . . 43
2.2.3.3 Notations . . . 43
2.2.3.4 The growing process . . . 44
2.2.3.5 Splitting criteria and impurity measures . . . 44
2.2.3.6 Stopping rules and evaluation of the tree . . . 47
3 Sled tests classification through k-NN method 49 3.1 Application of the Knowledge Discovery in Databases . . . 49
3.1.1 Step 1: Data selection . . . 49
3.1.2 Step 2: Data pre-processing . . . 49
3.1.3 Step 3: Data transformation . . . 52
3.1.4 Step 4: Data Mining Method: k-nearest neighbours classification . . 53
3.1.5 Step 5: Data classification . . . 53
3.2 Validation of the k-NN classification . . . 54
3.2.1 Algorithm for missing data . . . 54
3.2.2 The sled tests classification . . . 56
3.2.3 Estimation of the Euro NCAP score with all known parameters . . . 57
3.2.4 Estimation of the Euro NCAP score with unknown parameters . . . 58
3.3 Discussion on the k-NN classification . . . 59
4 Clustering of the dummy biomechanical values 61 4.1 Outputs’ clustering Euro NCAP . . . 61
4.1.1 Clustering for the HIII 50th dummy (passenger side) . . . 61
4.1.1.1 Generalities . . . 61
4.1.1.2 Dummy head: clusters’ formation and evaluation . . . 62
4.1.1.3 Dummy neck: clusters’ formation and evaluation . . . 64
4.1.1.4 Dummy chest: clusters’ formation and evaluation . . . 66
4.1.2 Clustering for the 50th dummy (driver side) . . . 68
4.1.3 Conclusion for the Euro NCAP rating clustering . . . 68
4.2 Outputs’ clustering FMVSS Nr.208 sled tests . . . 68
4.2.1 Clustering for the FMVSS Nr.208 legislation . . . 69
4.2.2 Clustering for the HIII 50th dummy belted (passenger) . . . 70
4.2.2.1 Dummy head: cluster’s formation and evaluation . . . 70
4.2.2.2 Dummy neck: cluster’s formation and evaluation . . . 72
4.2.2.4 Dummy femurs: cluster’s formation and evaluation . . . 74
4.2.3 Clustering for the HIII 50th dummy unbelted (passenger) . . . 74
4.2.4 Clustering for the HIII 5th dummy unbelted (passenger) . . . 76
4.2.5 Clustering for the HIII 5th dummy belted (US NCAP rating, passenger) 77 4.2.6 Clustering on the driver side . . . 79
4.3 Overview of the clustering results . . . 80
5 Parameters’ influence through decision trees 89 5.1 Data description and methodology . . . 89
5.2 Euro ncap rating: analysis of the dummy chest . . . 91
5.3 US ncap rating: hiii 5th belted dummy (passenger) . . . 102
5.3.1 Dummy head . . . 102 5.3.2 Dummy neck . . . 109 5.3.3 Dummy chest . . . 115 5.3.4 Dummy femurs . . . 125 5.4 Conclusion . . . 130 6 General conclusion 133 I Annexes 155 A Complement to chapter 1 157 B Legal requirements for the ece legislation 163 B.1 Euro NCAP rating: attribution of the points . . . 163
C Panels of the Graphical User Interface 165 C.1 Configuration’s panel . . . 165
C.2 General panels . . . 166
C.2.1 Panel for the driver and passenger airbag . . . 166
C.2.2 Panel for the kneebag . . . 166
C.2.3 Panel for the seat belt . . . 167
C.2.4 Panel for the sled test’s general parameters . . . 168
C.2.5 Overview panel . . . 169
C.3 Sled test’s results . . . 169
D.1 Dummy head . . . 171
D.2 Dummy neck . . . 171
D.3 Dummy chest . . . 172
D.4 Dummy femurs . . . 172
E Complement to Chapter 4.2 (FMVSS Nr.208, passenger side) 177 E.1 Passenger side : HIII 50th dummy unbelted . . . 177
E.1.1 Dummy head . . . 177
E.1.2 Dummy neck . . . 179
E.1.3 Dummy chest . . . 179
E.1.4 Dummy femurs . . . 179
E.2 Passenger side : HIII 5th dummy unbelted . . . 179
E.2.1 Dummy head . . . 179
E.2.2 Dummy neck . . . 179
E.2.3 Dummy chest . . . 180
E.2.4 Dummy femurs . . . 180
E.3 Passenger side : HIII 5th dummy belted (rating) . . . 180
E.3.1 Dummy head . . . 181
E.3.2 Dummy neck . . . 181
E.3.3 Dummy chest . . . 181
E.3.4 Dummy femurs . . . 181
F Complement to Chapter 4.2 (FMVSS Nr.208, driver side) 183 F.1 Driver side : HIII 50th dummy unbelted . . . 183
F.1.1 Dummy head . . . 183
F.1.2 Dummy neck . . . 183
F.1.3 Dummy chest . . . 184
F.1.4 Dummy femurs . . . 184
F.2 Driver side : HIII 5th dummy unbelted . . . 185
F.2.1 Dummy head . . . 185
F.2.2 Dummy neck . . . 186
F.2.3 Dummy chest . . . 186
F.2.4 Dummy femurs . . . 187
F.3 Driver side : HIII 50th dummy belted (rating) . . . 187
F.3.1 Dummy head . . . 188
F.3.3 Dummy chest . . . 189
F.3.4 Dummy femurs . . . 189
F.4 Driver side : HIII 5th dummy belted . . . 190
F.4.1 Dummy head . . . 190
F.4.2 Dummy neck . . . 190
F.4.3 Dummy chest . . . 191
F.4.4 Dummy femurs . . . 191
G Decision trees Euro NCAP 193 G.1 Dummy head . . . 193
I
NTRODUCTION AND RESEARCH
OBJECTIVES
W
orldwide road accidents kill 1.2 million persons per year and hurt forty timesmore [80]. Government and international associations campaign since many years for safe roads and their actions have already proved their efficiency, without being able to influence the inequalities between countries. Indeed, more than 90% of the deaths take place accidentally in low-income or in developing countries, which have less developed active and passive safety systems compared to Europe or North America.Since several years, the automobile safety is one of the priorities of all countries and is of increasing customer anxiety. The automobile manufacturers continually develop new re-straint systems to help improve occupant protection during a vehicle collision. The active safety regroups all the elements connected to the vehicle and to the environment, which thanks to their presence or functionality can avoid the occurrence of an accident. This is always on call before the accident whilst the passive safety occurs during the accident and aims at minimizing the gravity of an accident. The development of the new safety systems involves the execution of crash tests based on the use of specific dummies. The test configuration depends on the legislation of the country. The injuries imposed on the dummies are estimated through the measurement of biomechanical criteria. 28 000 sled tests data, including frontal, side and rear impact crashes have been collected by auto-motive suppliers. A part of them will be used to discover correlations between all the sled tests. These correlations will help engineers to understand the relationships between the input’s parameters (test configuration, restraint systems) and the outputs (injury severity) and also to reduce the daily amount of sled tests.
1.1/
B
ACKGROUND ON PASSIVE SAFETY1.1.1/ PASSIVE SAFETY AND ACCIDENT’S CAUSES
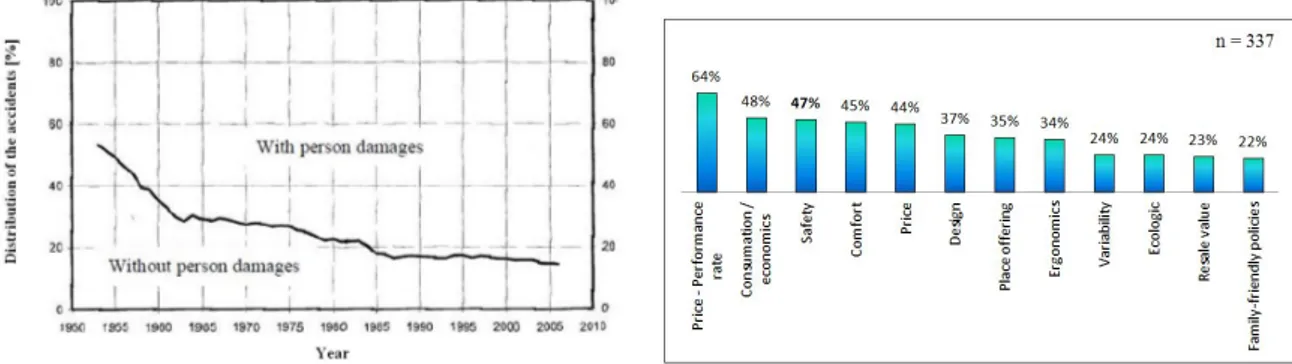
The automobile is nowadays the most often used mean of transport. Safety had to be developed during the last years to reduce the accidents that this popularity engenders. In 2003, 6.613 people died in Germany in an automobile accident and, mainly thanks to the development of active and passive safety, this number has been reduced in 2011 by almost 42% (3.648 deaths) [73]. As shown in Fig. 1.1(a) [43], the percentage of accidents was decreasing during the years but also the proportion of accidents which caused not
damages, even if automobile buyers take safety into consideration before choosing their car (Fig. 1.1(b)).
(a) Repartition of the accidents in Germany (with and without damages) from 1950 until 2010
(b) Repartition of the factors influencing the buy of a car (survey 2013) [61]
Figure 1.1: Reduction of accidents and consideration of the car safety
The reasons explaining an automobile accident are multiple, but driver behaviour is often the main cause. Passive safety aims at ”repairing” human errors. It was established (Fig. A.1) that driver mistakes by turn or priority mistakes are the main causes responsible of an accident. Seat belt and airbags cannot avoid an accident (this is the objectives of active safety) but aim at protecting car occupants during the crash. Without passive safety systems, humans errors would have irreversible effects. Fig. 1.2 presents the repartition of collision’s impact and most exposed occupants to injuries (i.e. the driver and passenger seated on the first row). According to Johannsen [65], the most common impact direction on the German roads is the frontal collision, with 53% of the total number of accidents (Fig. 1.2(b)). The remaining 47% are separated between right side, left side and rear evenly. The data was collected by the German In Depth Accident Study (GIDAS) between July 1999 and June 2013. The driver and passenger are the most sensitive occupants (Fig. 1.2(a)) because of the predominance of frontal impact crashes. There are good arguments to focus this doctoral research on frontal impact sled tests, especially on the driver and passenger occupants.
1.1.2/ LEGISLATION AND RATINGS
In the last thirty years, lots of new legislation and programmes have been established in order to test the car safety, but also to support the customer’s choice with the help of released passive safety results.
Legislation and ratings have to be differentiated. The legislation has to be completed to enable a new car model to go on the market. It regroups many test configurations for frontal, side and pedestrian safety (Fig. 1.3). The most famous legislation is the Economic Commission for Europe (ECE) regulations and for the American market the Federal Motor Vehicle Safety Standards (FMVSS).
All new car models must pass certain safety tests before they are sold. The test configu-ration (dummies, initial velocity, direction of the impact crash) is defined by the legislation of the country and depends on the restraint systems that have to be validated.
Addi-(a) Repartition of the accidents’ frequency according to the occupant position in car
(b) Repartition of the collision’s impacts - Dominance of frontal impact crashes
Figure 1.2: Preponderance of frontal impact crashes with driver and passenger as most exposed car occupants
Figure 1.3: Main crash regulations in Europe and USA
tionally customer ratings are executed independently of the customer and legislation to provide a minimum safety for new cars. European New Car Assessment Program (EURO NCAP) evaluates the car safety for Europe, US NCAP for the U.S.A. and LATIN NCAP for South America. New Car Assessment Program (NCAP) is a non government program based on the ”Allgemeine Deutsche Automobil-Club” (ADAC) programm which regroups methods of tests, automobile designs and others tests relating to the automobile. The first one NCAP has been created in America by the United States National Highway Traf-fic Safety Administration (NHTSA) in 1979. Its methods have been continually improved during the years by adapting it to the new technologies and restrictions. ADAC is yet
an active member of the EURO NCAP, as other famous associations like the ”F ´ed ´eration Internationale de l’Automobile” (FIA). Each rating stipulates the test setup (rigid barrier, overlap), impact velocity and dummy type. This independent assessment evaluates the occupants damages and informs the customer on the car safety level (star evaluation).
1.1.2.1/ ECE REGULATIONS ANDEURO NCAPRATING
The United Nations Economic Commission for Europe (UNECE or ECE) regulations are European vehicle requirements initiated by the legislation for car safety, lighting and envi-ronment protection. Five main rules regulate frontal impact crashes. ECE-R94is in charge of the occupant protection for a frontal collision which is defined as an impact between two cars. This collision is simulated through an automobile crash against a deformable barrier with an overlap of 40%. The impact velocity is fixed at 56 km/h and the driver and passenger occupants must be HIII 50th dummies belted. This dummy corresponds to the supposed median adult male drivers (based on U.S. data).
Since 1997, EURO NCAPis a programme based in Brussels, Belgium which is in charge in Europe to evaluate the passive and active safety on cars and which attributes a stars number corresponding to the obtained score in the test. Table 1.1 resumes the safety performance’s definition according to EURO NCAP[72].
Table 1.1: Definition of the safety performance for theEURO NCAPrating Definition of the safety performance according toEURO NCAP
? ? ? ? ? Overall good performance in crash protection. Well equipped with robust crash avoidance technology
? ? ?? Overall good performance in crash protection; additional crash avoidance technology may be present
? ? ? Average to good occupant protection but lacking crash avoidance technol-ogy
?? Nominal crash protection but lacking crash avoidance technology
? Marginal crash protection
Since 2009, EURO NCAP gives one overall star rating per vehicle. This score takes four sections into consideration:
q Section I: Adult occupant protection q Section II: Child occupant protection q Section III: Pedestrian protection q Section IV: Safety assistance
For the offset frontal impact crash, the EURO NCAP rating test depicts that the driver and the passenger have to be a HIII 50th Percentile dummy. The impact velocity is 64 km/h against a deformable barrier (with an overlap of 40%), the crash velocity for the rating is thus higher as for the ECE-R94 regulation. Fig. 1.4 resumes the crash configuration for ECEregulation andEURO NCAPrating.
Figure 1.4: European regulation andEURO NCAPrating for frontal impact
For each section of the rating, a weight factor is applied on the score. These weights are continually updated from time to time. Table 1.2 summarises the weight factors for the period 2013-2015 [59] and confirms the importance of the adult occupant protection in
EURO NCAPrating.
Table 1.2: Weight factors for theEURO NCAPsections
Year 2013 2014 2015
Section I: Adult occupant protection 50% 40% 40%
Section II: Child occupant protection 20% 20% 20%
Section III: Pedestrian protection 20% 20% 20%
Section IV: Safety assistance 10% 20% 20%
Table 1.3 explains the overall calculation of theEURO NCAPrating score including all four sections with their weights from 2014 [75]. It specifies for example that for adult occupant protection (Section I), the offset frontal impact crash represents 16 points out of 38. The Section I is additionally weighted at 40% for the whole rating score calculation. The rating score is then deduced from the four sections score.
For the frontal occupants, the maximal points that can be reached by the driver and the passenger is 16 points each, allocated evenly between the four dummy regions : head/neck, chest, knee/femur/pelvis and leg/foot (Table 1.4). Only the half score (i.e. 8 points) is considered for the overall score calculation, which explains the 16 points (driver and passenger) of the Section I adult occupant protection (Table 1.3).
TheECE-R94regulation and theEURO NCAPrating control the car safety intended for the European market. Their equivalence for the U.S.A. are theFMVSSregulation (in particular the section 208 for occupant crash protection) and theUS NCAPrating, which represent an additional challenge for the passive safety engineers because of the variety of dummies type and test configurations.
1.1.2.2/ FMVSS NR.208REGULATION AND US NCAPRATING
Federal Motor Vehicle Safety Standard (FMVSS) are the regulations provided by the U.S. legislation, specifying the design, construction and safety requirements for the
automo-Table 1.3: Calculation of the overallEURO NCAPrating score (2014)
Section I: Section II: Section III: Section IV: Adult occupant protection Child occupant protection Pedestrian protec-tion Safety assistance
Offset frontal impact : 16
Dyn. tests frontal:
16
Head impact: 24 Seat belt reminder :
3 Side impact (MDB) :
8
Dyn. tests side : 8 Leg impact : 6 Speed assistance
system: 3 Side impact (Pole) :
8
Installation of CRS : 12
Upper leg impact : 6 ESC
Whiplash front : 2 Vehicle : 13 LDW / LKD : 1
Whiplash rear : 1 AEB interurban : 3
AEB city : 3
Max. score 38 49 36 13
Normalised score (2)
Actual score / 38 Actual score / 49 Actual score / 36 Actual score / 13
Weighting (2014) 40% 20% 20% 20% Weighted score (4) Normalised score*40% Normalised score*20% Normalised score*20% Normalised score*20%
Rating Min. normalised score (2) by box for the respective star rating
? ? ? ? ? 80% 75% 60% 65%
? ? ?? 70% 60% 50% 55%
? ? ? 50% 30% 40% 30%
?? 30% 25% 20% 20%
? 20% 15% 10% 10%
Table 1.4: EURO NCAP rating score repartition for the driver and passenger
Maximal of points Dummy region (worst performing region) Driver Passenger
Head / Neck 4 points 4 points
Chest 4 points 4 points
Knee / Femur/ Pelvis 4 points 4 points
Leg / Foot 4 points 4 points
Total score 16 points 16 points
Half score forEURO NCAPcalculation 8 points 8 points
Offset frontal impact 16 points
bile. The FMVSS NR.208 regulation is focused on the occupant crash protection. The tests are executed with and without seat belts (Fig. 1.5) and the HIII 50th and HIII 5th dummies are used as frontal car occupant (both dummies tested on both sides). The HIII 50th dummy represents the median adult male and the HIII 5th dummy corresponds with females, which are larger than the supposed smallest 5th. The velocity impact for the belted test is 56 km/h (35 mph) and for the unbelted configuration, 40 km/h (25 mph), both against a full-width rigid barrier.
The US NCAPrating is based on this regulation. As for theEURO NCAPrating, it enables the evaluation of the car through a stars evaluation. The U.S. rating depicts that the
Figure 1.5: The four FMVSS NR.208 test configurations (in-position and full-width test)
driver has to be a HIII 50th dummy and the passenger a HIII 5th dummy. Both have to be belted, i.e. the impact velocity against the full-width rigid barrier is fixed at 56 km/h (35 mph), instead of 64 km/h against a deformable barrier (overlap of 40%) for theEURO NCAP rating. The stars number is defined according to the Relative Risk Score (RRS) (Table 1.5). This parameter is based on the combined probability Pcomb, which evaluates
the whole injury severity of the occupant by taking the single probabilities of the dummy part into account. The single probabilities are based on the Abbreviated Injury Scale (AIS), a coding system created to describe the injury severity and to symbolize the risk (from 1 to 6) to life associated with the injury. For example, AIS 1 regroups minor injuries and AIS 6 fatal injuries. AIS 1+ regroups all risk injuries from the minor one. Generally AIS 3+ injury risk curves are taken into account (it corresponds to serious to fatal injuries), except for the femur forces which use AIS 2+ (moderate to fatal injuries).
The injury criterion measured by the dummy sensors during the crash enables the calcu-lation of the single injury probability which is expressed differently for the HIII 50th dummy (Table. 1.6) and HIII 5th dummy (Table 1.7) [42]. The single probabilities of the head are calculated with the cumulative normal distribution defined as:
Φ(x) = √1 2π Z x −∞ e−12t 2 dt (1.1)
The combined probability Pcombis calculated according to Eq. 1.2 (valid for the driver and
passenger side):
Table 1.5: Star rating according to the injury probability and/or the Relative Risk Score (RRS) Probability RRS ? ? ? ? ? Pcomb < 0, 10 RRS < 0, 667 ? ? ?? 0, 10 ≤ Pcomb< 0, 15 0, 667 ≤ RRS < 1, 0 ? ? ? 0, 15 ≤ Pcomb< 0, 20 0, 10 ≤ RRS < 1, 33 ?? 0, 20 ≤ Pcomb< 0, 40 1, 33 ≤ RRS < 2, 667 ? 0, 40 ≤ Pcomb 2, 667 ≤ RRS
Table 1.6: Injury criteria and probabilities for the HIII 50th dummy (driver side)
Dummy part Injury criterion Single injury probability
Head HIC 15 (-) Phead(AIS 3+) = Φ(ln(HIC15)−7,452310,73998 )
whereΦ is the cumulative normal distribution (Eq. 1.1)
Neck Ni jand tension/compression PNeckNi j(AIS 3+) = 1+exp (3,2269−1,9688∗N1
i j)
(in kN) PNeckT ension(AIS 3+) = 1+exp (10,9745−2,375∗NeckTension)1
PNeckCompression(AIS 3+) = 1+exp (10,9745−2,375∗NeckCompression)1
⇒ PNeck= max(PNeckNi j, PNeckTension, PNeckCompression)
Chest Deflection (in mm) Pchest(AIS 3+) = 1+exp (10,5456−1,568∗(ChestDe f lection)1 0,4612)
Femur Force left and right (in kN) Pf emur(AIS 2+) = 1+exp (5,7949−0,5196∗(FemurForce))1
Table 1.7: Injury criteria and probabilities for the HIII 5th dummy (passenger side)
Dummy part Injury criterion Single injury probability
Head HIC 15 (-) Phead(AIS 3+) = Φ(ln(HIC15)−7,452310,73998 )
whereΦ is the cumulative normal distribution (Eq. 1.1),
Neck Ni jand tension/compression PNeckNi j(AIS 3+) = 1+exp (3,2269−0,7619∗N1
i j)
(in kN) PNeckT ension(AIS 3+) = 1+exp (10,958−3,770∗NeckTension)1
PNeckCompression(AIS 3+) = 1+exp (10,958−3,770∗NeckCompression)1
⇒ PNeck= max(PNeckNi j, PNeckTension, PNeckCompression)
Chest Deflection (in mm) Pchest(AIS 3+) = 1+exp (10,5456−1,7212∗(ChestDe f lection)1 0,4612)
Femur Force left and right (in kN) P(AIS 2+) = 1
1+exp (5,7949−0,7619∗(FemurForce))
Once Pcomb is determined, the ratio called Relative Risk Score is deduced from it, set to
15%. This percentage is imposed by NHTSA and allows an eventual adaptation of the values’ conditions for reaching 5 stars.
Each measured criterion influences the rating score differently. Fig. 1.6 represents the single probability of each dummy part and their influence on the rating for the HIII 50th dummy (driver side) and for the HIII 5th dummy (passenger side) (graphical logarithmic representation through the curves −100 ∗ log(1 − Pdummypart)).
TheFMVSS NR.208regulation as well as theUS NCAPandEURO NCAPratings are consid-ered in this study. Because of a lower velocity in comparison with the rating, theECE-R94 regulation is not taken into consideration. Dummies enable the validation of these regula-tions with the evaluation of the occupant injury severity measured with high tech sensors.
Figure 1.6: Injury criteria and their logarithmic representation using for the U.S. rating score calculation
1.1.3/ CRASH TESTS DUMMIES AND INJURIES CRITERIA
The level of injury severity of the car occupant is simulated with the help of sled test facilities and calibrated devices. These high tech dummies are composed of sensors which measure in real time the biomechanical values during the frontal sled test.
1.1.3.1/ DESCRIPTION OF THE SLED TEST FACILITY AND MEASURED DATA
For the development and dynamical testing of frontal airbags as well as seat belt systems, the automotive suppliers are equipped with a servo hydraulic HyG-Sled-facility from MTS Systems Corporation. The sled facility with the test setup is accelerated by a hydraulic shock piston from the standstill on the given speed. Besides, a defined acceleration is considered. The required impulse energy to reach the aimed acceleration is provided by compression and storage of nitrogen gas in hydro pneumatic pressure warehouses.The hydro system liquid is passed on to the three-stage servo-ventilation system which steers the oil flow in dependence of the wished acceleration to the concentric ordered working cylinder. The shock piston in the working cylinder accelerates the sled test platform with the test setup applied to it. For the simulation of a frontal impact, a massive reinforced buck of a certain vehicle type is fixed on the sled test facility with all system components, required dummies and measurement instrumentation (Fig. 1.7(a)). This type of facility, which acceleration can reach 110 g with a weight of the buck of maximal 2500 kg, is intended to reproduce a realistic, repetitive, and as a rule non-destructive way, the effects of a real automotive crash. With the given acceleration-time, the buck is implemented against the original direction of the traffic of the real vehicle. The facility is composed of:
q a jack of push with a force between 1500 and 4000 kN (or more) equipped with a servo valve of which the last floor has a flow of more than 100 000 L/min (Fig. 1.7(b));
q a trolley of shocks as a support of the reinforced buck which slips on a rail equipped with an autonomous braking system;
q a track with rails from 30 to 40 meters long, necessary for the braking of the buck.
The dummies used in the sled test are retained by the restraint systems, the dummy biomechanical values are recorded and all data and videos are documented and stored. Since 2000, a large amount of data coming from the frontal sled test facility have been collected by some automotive suppliers. The number of available data is estimated at approximately 28,000 data (2001-2014).
1.1.3.2/ CRASH TEST DUMMIES AND INSTRUMENTATION
The Anthropomorphic Test Devices (ATD), or crash test dummies, are used by automotive companies as occupant to test the safety of any type of vehicle. There are different types of dummies, according to the kind of collision being checked. The most famous are:
(a) Sled test sequence (b) Principle of a sled test facility Figure 1.7: Description of a sled test facility (HyG)
q SID: Side Impact Dummy. As its name suggests, it is used for side collisions; q BioRID: Biofidelic Rear Impact Dummy. It is used for rear impact crashes;
q CRABI: Child Restraint Air Bag Interaction. This 12-month-old child is used to test forward and rear facing car seats.
For frontal impact crashes, three types of adult Hybrid dummies have been determined based on the characteristics of the people working in the American army:
q Hybrid III 95th Percentile Large Adult Male: it corresponds to the supposed males larger than 95th of the male drivers;
q Hybrid III 50th Percentile Middle Adult Male: median adult male;
q Hybrid III 5th Percentile Small Adult Female: it corresponds with females, which are larger than the supposed smallest 5th.
Table 1.8: Characteristics of the three Hybrid III Percentile dummies (weight and size)
Hybrid III 5th Percentile Hybrid III 50th Percentile Hybrid III 95th Percentile
Weight 50 kg 77 kg 100 kg
Size 152 cm 175 cm 188 cm
All these dummies are calibrated devices which simulate the physical properties of a human. The high tech sensors measure the injury potential during a sled test like the velocity of impact, deceleration rates of various body parts, impact forces, etc. A modern dummy has over 200 sensors.
These sensors are able to acquire lots of data and are regrouped into three types of instrumentation:
q Accelerometers (Fig. 1.8(a)): they measure the rate at which speed the body part moves during the collision, in a particular direction. They are available for the dummy head, chest, pelvis, legs and eventually feet;
q Load sensors (Fig. 1.8(b)): they measure the amount of force applied on differ-ent body parts during the collision and convert this input mechanical force into an electrical output signal (i.e. force-time curves);
q Motion sensors (Fig. 1.8(c)): they are fitted in the dummy chest to measure its deflection during a collision.
(a) Position of the accelerometers in the dummy head
(b) Position of the load cells in the dummy neck
(c) Position of the motion sensors in the dummy chest
Figure 1.8: Dummy sensors
Table 1.9 and Table 1.10 present the different sensors available for respectively HIII 5th and HIII 50th dummies constructed by the company ”Humanetics”:
Table 1.9: Instrumentation’s description of the HIII 5th dummy
Location Description Channels
Head 3 Accelerometers in a triax pack Ax, Ay, Az (used for HIC)
Neck Six-Axis Upper Neck Load Cell Fx, Fy, Fz, Mx, My, Mz
Five-Axis Lower Neck Load Cell Fx, Fy, Fz, Mx, My
Thorax 3 Accelerometers in a triaxial array Ax, Ay, Az
Chest Displacement Potentiometer Std Equipment
Fixe-Axis Thoracic Spine Load Cell Fx, Fy, Fz, Mx, My
Lumbar Spine Fixe-Axis Lumbar Spine Load Cell Fx, Fy, Fz, Mx, My
Pelvis 3 Accelerometers or 1 Triax pack Ax, Ay, Az
A.S.I.S. Load Cell (Iliac Wings) Fx, My (per side)
Femur Uniaxial Femur Load Cell Fx (per leg)
Six-Axis Femur Load Cell Fx, Fy, Fz, Mx, My, Mz (per leg)
Knee Shear Displacement Dx (per knee)
Lower legs Biaxial Knee Clevis Load Cells Fx, Fz (per leg)
Four Axis Upper Tibia Load Cells Fx, Fz, Mx, My (per leg)
Four Axis Lower Tibia Load Cells Fx, Fz, Mx, My (per leg)
All these sensors - but also other measurements like the acceleration of the buck - are connected to one or two mini-Data Analysis Units (mini-DAU) which are able to capture each 16 gigabytes of data. The computers can record 20.000 data points per second for every sensor during a full 300-millisecond-long sled test but this recording can record up to 70.000 data points (Fig. 1.9(a)).
Table 1.10: Instrumentation’s description of the HIII 50th dummy
Location Description Channels
Head 3 Accelerometers in a triax pack Ax, Ay, Az (used for HIC)
Up to 15 Accelerometers 5X Ax, Ay, Az Head Rotation
Neck Six-Axis Upper Neck Load Cell Fx, Fy, Fz, Mx, My, Mz
Six-Axis Lower Neck Load Cell Fx, Fy, Fz, Mx, My, Mz
Clavicle Biaxial Load Cell (left and right) Fx, Fz
Humerus Four-Axis Load Cell (left and right) Fx, Fy, Mx, My
Thorax 3 Accelerometers in a triaxial array Ax, Ay, Az (Chest Accel)
Chest Displacement Transducer Dx (Stnd. Equipment)
Four-Axis Rib/Spine Load Cells Fx, Fy, Fz, My
Fixe-Axis Thoracic Spine Load Cell Fx, Fy, Fz, Mx, My
Lumbar Spine Three-Axis Lumbar Spine Load Cell Fx, Fz, My
Pelvis 3 Accelerometers (or triax pack) Ax, Ay, Az
Submarining Load bolts Fx (3 per side)
Femur Uniaxial Femur Load Cell Fx (per leg)
or Six-Axis Upper Femur Load Cell Fx, Fy, Fz, Mx, My, Mz (per leg)
Knee Knee Displacement Dx (per knee)
Lower legs Biaxial Knee Clevis Load Cell Fz (per leg)
Four Axis Upper Tibia Load Cell Fx, Fz, Mx, My (per leg)
Four Axis Lower Tibia Load Cell Fx, Fz, Mx, My (per leg)
Ankle Fixe-Axis Load Cell Fx, Fy, Fz, Mx, My (per leg)
Toe Toe Load Cell Fz (per foot)
After measuring the injuries through the sensors, the data is converted and stored digital, which enables the representation and vizualisation for the analysis of the biomechanical values (Fig. 1.9(b)).
(a) Dummy connection with mini-DAU
(b) Preparation of the measured data for the analysis
Figure 1.9: Data measurement and transformation
These measurements are analysed in order to determine the level of injury severity of the car occupant.
1.1.3.3/ DESCRIPTION OF THE INJURIES CRITERIA FOR THE DUMMY BODY PARTS
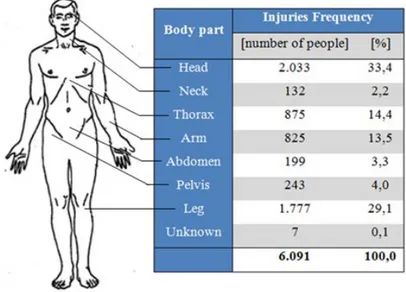
With the help of the data coming from theGIDASdatabase, the German In-Depth Accident Study, Florian Kramer [65] studied the injuries on each body part of the occupant during a collision. The head is the body part which is the most exposed, as shown in Fig. 1.10, with 33,4% of rugged people who had head injuries.
Figure 1.10: Injuries frequency for each dummy part
The neck, chest and lower extremities are also very sensitive parts and are measured during any sled test. The injuries suffered by the dummy parts are calculated directly from the measurements coming from the dummy sensors.
Head: the injuries on the dummy head are estimated with the help of the criterion ”Head Injury Criterion” (HIC) [39], which is the standardized maximum integral value of the head acceleration: HIC(t2−t1) = supt1,t2 1 t2− t1 Z t2 t1 a(t).dt !52 (t2− t1) (1.3) a= q a2x+ a2y + a2z (1.4)
The European and American legislation impose a maximal value for the HIC:
q EURO NCAP: HIC36 <1000. The length of the time interval (t2-t1) is here 36 ms;
q FMVSS NR.208: HIC15 <700. The length of the time interval (t2-t1) is here 15 ms.
The acceleration (ax, ay, az) are measured by the three head accelerometers. The US
legislation and EURO NCAP rating take the head acceleration a3ms under consideration,
which is the maximum 3ms-average of the resulting acceleration:
a3ms= 1 ∆t Z t2+∆t t1 a(t).dt ∆t = 3ms (1.5)
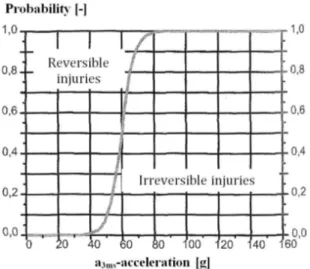
Fig. 1.11 shows the risk’s function for the head during a frontal impact, with the limit between reversible and irreversible damages [43]. It concludes that from HIC = 1000, the risk to have irreversible damages is 50%.
Figure 1.11: Repartition of the damages’ gravity for the head (HIC criterion)
Neck: the injuries on the dummy neck are estimated through the criterion ”Normalized Neck Injury Criterion” (Ni j) [39]. This is a combination of the forces and bending moment
around a lateral axis at the transition from the head to the neck:
Ni j= Fz Fzc + MOCy Myc (1.6) with
q Fzforce at the transition from head to neck;
q Fzccritical force;
q MOCy total moment =My− (D.Fx) with D the distance between the force sensor axis
and the condyle axis; q Myccritical moment.
The neck criterion is thus defined by four possible neck movements (Table 1.11):
q NT E: tension - extension (Fzpositive, MOCy negative);
q NT F: tension - flexion (Fzpositive, MOCypositive);
q NCE: compression - extension (Fznegative, MOCynegative);
q NCF: compression - flexion (Fznegative, MOCy positive).
Chest: for this body part, there are two criteria to consider: the acceleration and the deflection. The chest acceleration, measured by the accelerometers only for the FMVSS NR.208test, may not excess the value of 60 g. The maximal value of the chest deflection depends on the regulation and the dummy type. For the EURO NCAP rating, the Vis-cous Criterion (VC) is also a parameter to be considered. This value corresponds to the
Table 1.11: Description of the four neck movements using for the points calculation inFMVSS NR.208regulation
Tension - Extension Tension - Flexion Compression - Extension Compression - Flexion
maximum crush of the momentary product of the thorax deformation speed and thorax deformation (Eq. 1.7): VC= Scaling factor. YCFC180 Defconst. dYCFC180 dt (1.7) with q Y [m] : thoracic deformation;
q dYCFC xxx/dt [m/s] : deformation velocity,CFC xxxcorresponds to the filter class applied
on the data;
q De f const [mm] : dummy constant that is depth or width of half the rib cage.
As for the dummy head, Kramer [43] proposed a representation of the chest acceleration delimiting reversible and irreversible damages (Fig. 1.12). We can remark that the maxi-mal value for the acceleration imposed by the FMVSS NR.208(60 g) corresponds to 50% of the cases to have irreversible damages during a frontal impact.
Lower extremities: the Tibia Index (TI) and tibia compression, which is directly measured by the sensors, are used in order to evaluate the damages on the dummy legs. The TI is only taken into account for the EURO NCAP rating and is determined by the following formula (Eq. 2.4): T I= MR (MC)R + Fz (FC)z (1.8) MR= q (Mx)2+ (My)2 (1.9) with
q Mx : bending moment [Nm] around the x-axis;
q My: bending moment [Nm] around the y-axis;
q (MC)R: critical bending moment [Nm];
Figure 1.12: Repartition of the damages’ gravity for the chest through its accelera-tion
q (FC)z: critical compression force [kN] in z-direction.
The high tech dummies enable the evaluation of the occupant damages during a frontal sled test. Their measured biomechanical values are continually improved by modifying passive safety systems such as airbags and seat belts.
1.1.3.4/ PASSIVE RESTRAINT SYSTEMS
The passive safety occurs during the accident and aims at minimizing its gravity. The main passive safety systems for the frontal occupants are the airbags including kneebag and the seat belts. Each restraint system is adapted according to the customer’s wishes and legislation. For that, some parameters can be modified such as the volume of the airbag or the type of forces applied on the dummy (constant, degressive, regressive, switchable). An expert elicitation conducted with passive safety experts enabled to select 57 parameters on the driver side and 46 parameters on the passenger side which seem to have a significant influence on the dummy biomechanical values. Input parameters selected by the experts and considered in this research for studying their influence on the biomechanical values are regrouped into 5 categories:
q Driver airbag: volume, vent holes, tethers, inflator, steering wheel and column; q Passenger airbag: divided panel, volume, vent holes, tethers, inflator;
q Knee bag: volume, tethers, inflator;
q Seat belt: pretensioners (retractor, buckle and anchor), angle shoulder/D-ring, web-bing on spool, height adjustment, dynamic locking tongue;
q General: dummy temperature, dummy neck constellation, pulse evaluation, car classification.
Sohr [49] resumed in his publication ”Benefit of adaptive occupant restraint systems” the benefits of advanced passive technologies on the biomechanical values of the occupant. His study is focused on the US NCAP rating requirements and based on valid occupant crash simulations. He showed that the integration of advanced restraint systems can reduce considerably the biomechanical criteria of the occupant. On the driver side, the introduction of an adaptive seat belt load limiter with double pretensioning, a knee airbag and an advanced airbag shape leads to the reduction of the biomechanical values of more than 60% for theUS NCAPrating requirements. The crash pulse also influences the injury severity of the driver.
On the passenger side, as on the driver side, the knee airbag has a positive influence on the head and chest and its use can also reduce the chest deflection up to 40%. The adaptive seat belt load limitation and an adaptive airbag system load lead to the reduction of the head criterion by 70%. The Japanese firm Takata developed a so-called ”Twinbag”, a bag with two parallel pockets connected with a horizontal tube, which aims at reducing the neck injury probability (Ni j) up to 30%. The American firm TRW Automotive also
developed a new generation of passenger airbag called ”Dual Contour Bag” which can adjust its volume according to the dummy type and which reduces the Ni j values and the
chest deflection, mainly for the HIII 5th dummy. As on the driver side, the harder the crash pulse is, the higher the biomechanical values are.
Sohr summarized the benefits of the advanced passive safety very well.
This first chapter resumed the context of the doctoral researches. Passive restraint sys-tems (inputs) and dummy biomechanical values (outputs) have been presented and the relationships between both inputs and outputs are studied, independently of the customer and vehicle.
1.2/
R
ESEARCH OBJECTIVESThese researches are based on an industrial demand coming from a passive safety sup-plier.
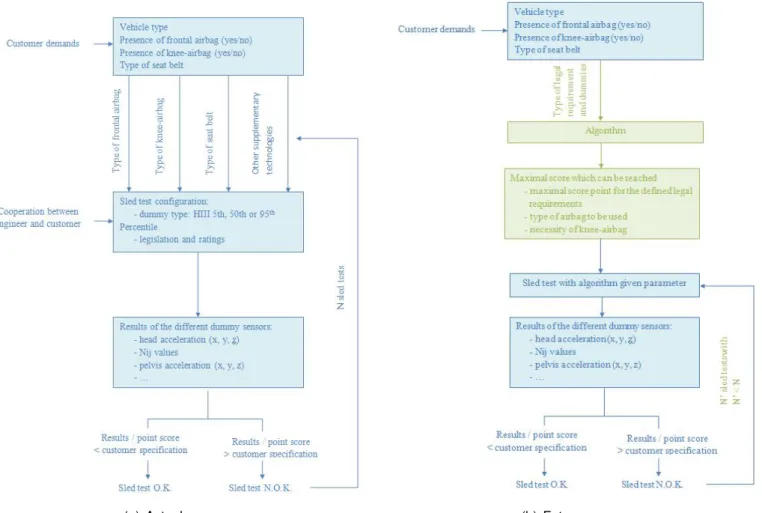
Currently each passive restraint system (airbag, seat belt) are developed for each cus-tomer independently of one another, and the relationship between restraint system pa-rameters and results have not yet been studied. After taking the customer demands into account (type of restraint system, presence or not of a kneebag, cost, etc.), the engineers develop the desired passive technologies according to the legislation and/or ratings. The biomechanical values of the dummy are measured and the results have been analysed. The sled tests are iterated until the results are either under the legal limits as well as the customer’s limits or sufficient for getting the maximal rating score. These development steps are resumed in Fig. 1.13(a).
These researches aim at reducing the number of repeated sled tests through the op-timisation of the passive safety configuration, and in particular through the discovering of relationships between the inputs parameters of the restraint systems and the outputs (biomechnical values). For that, data coming from the existing sled tests are studied independently of the vehicle and customer. A database containing all relevant data (airbag’s parameters, seat belt parameters, dummy position) has been constructed for each dummy and legislation/ratings, thereby 5 databases have been created for each occupant side:
q EURO NCAP;
q FMVSS NR.208with a belted HIII 5th dummy; q FMVSS NR.208with a belted HIII 50th dummy; q FMVSS NR.208with an unbelted HIII 5th dummy; q FMVSS NR.208with an unbelted HIII 50th dummy.
The researches are focused on the discovering of pattern / muster between the restraint system parameters and the dummy biomechanical values of each dummy part. The found pattern will help create an algorithm which will work before running a sled test, present the parameter’s influence and finally propose a new solution based on the maximisation of the score. The engineers will thus be able to adapt the sled test’s configuration before running it by learning on the already sled tests. It help reach better results while reduce the number of sled tests (which involves the reduction of time and cost). A representation of the new process including the discovered pattern / musters is proposed in Fig. 1.13(b). In order to find such a model, a previous work on the crash data should be carried out. Firstly, in comparison with the researches on the road safety, it seems to be difficult to obtain a large among of data because of the lack of information for earlier sled tests. This reduced number of data causes a modification of the first thinking and produces some difficulties to work with methods specifying a large database. Moreover, once the sled tests have been selected, the first task will consist in preparing it, i.e. in researching the missing values or in replacing it principally. A big work should be thus done first on the data preparation and conversion in order to have anyway a enough big database containing clear information. The aim is here to obtain any useful information out of them. After preparing and cleaning the database, two tasks have to be differentiated: the first one will be focused on the dummy biomechanical values, i.e. the outputs. A discretization of the data in order to gather it into classes (clustering methods) could eventually help define the level of injury severity that could be then useful for the second step. The next task is focused on the inputs of the model, i.e. the parameters of the restraints systems (airbags, knee bag, seat belt), especially on the links between the inputs and the outputs. Because of the gathering of the outputs into classes, classification methods seem to be appropriate. The created model will help the engineers understand the relationships between some parameters and the test results. They can thus take into account these links before choosing / modifying a parameter. This learning on previous data will increase the understanding of the restraint systems and their influence on the car occupant.
(a) Actual process (b) Future process Figure 1.13: Actual and future processes for the development of passive systems
S
TATE
-
OF
-
THE
-
ART
In this chapter, a literature review focused on automobile crashes is presented. It aims at understanding the current state-of-the-art for crash data and defining the best appropriate methods/algorithms for the database used in this doctoral thesis.
2.1/
M
ETHODS FOR CRASH DATA ANALYSIS2.1.1/ CURRENT RESEARCHES IN AUTOMOBILE CRASHES
Many researches are focused on the prediction of collisions or of injury severity according to external factors (lighting, seat belt wearing, etc.). The common used techniques are data mining methods which help find out relationships between factors and crash severity. Data mining technology can be used to predict and describe the driver’s behaviour in order to understand and reduce the injury severity during an automobile crash. Many studies are being conducted in order to evaluate and to control the injury severity with the help of data mining methods. The most popular methods in this domain are the decisions trees and the neural networks. Fayyad et al. [13] enumerated some data mining methods:
1. Decision trees and rules: the decision tree is a binary tree in which a parameter is compared to some constants at each node;
2. Non linear regression and classification methods: the classification method uses a set of parameters to characterise each object. They regroup the techniques for prediction like neural networks or nearest-neighbour classifiers;
3. Example-based methods: it is a method which consists of using representative examples from the database to approximate a model;
4. Probabilistic graphical dependency models: the probabilistic model uses a graph which denotes the conditional dependence structure between random variables; 5. Relational learning models: also called ”inductive logic programming”, it uses the
more flexible pattern language of logic ;
6. rough set theory: this theory is based on the study of the formal approximation of a set which gives the lower and upper approximations of the original set.
7. Theory of association rules : it allows the discovery of correlations and patterns in a database;
8. Clustering: grouping of objects in a same group (called cluster) which present more similarities between them rather than with others objects belonging to another clus-ter.
This literature review is separated according to the data mining techniques: the unsuper-vised learning (grouping of set objects and discovery of relationships between objects) through the clustering and the supervised learning (grouping of predefined classes and classification of new object affiliated to these classes) through the data classification. Both of them can be here applied on the input’s parameters (classification) and on the outputs (clustering).
2.1.1.1/ CLUSTERING METHODS
The clustering is one of the data mining techniques that aims at describing and finding similarities between data. This technique can be applied on the dummy biomechanical values (outputs) in order to form groups of values (clusters) which present some similari-ties and then to classify the input’s parameters.
Mohamed et al. [67] applied two partitioning clustering methods (i.e. which divide the data into k clusters) on data from crashes involving pedestrian and vehicle. The data has been collected in New York City, U.S.A. and in Montreal, Canada. For the first city, they applied the latent class analysis as unsupervised method used for multivariate categorical data. Different numbers of clusters from one to eleven have been tested and the BIC, AIC and CAIC criteria, combined with the entropy calculation and the R-squared criterion, helped at determining the optimal number of clusters. For each discovered cluster, the distribution of the variable allows a better analysis of the data set and help at finding the variables influencing the most the injury severity of the pedestrian. The authors preferred the k-means algorithm, an other unsupervised method, on the Montreal data set because the latent class algorithm regrouped 90% of the data in the first two clusters, regardless of the selected clusters number. Both methods are conclusive and provide information on the link between the pedestrian injury severity and the factors that caused the collision (traffic, lighting conditions, environmental conditions). Throughout this publication, the authors putted forward the importance of the data set segmentation and the analysis of contributing factors.
Furthermore, Geurts et al. [28] analysed crash data from the National Institute of Statis-tics in Belgium to discover patterns. They divided the traffic accident data into clusters by using a latent class clustering, which is in this case more effective as the Poisson distribution. Each cluster gives a indication of the accident risk factor. The profile of the clusters of traffic roads is conduced with the association algorithm in order to discover the most interesting patterns. Wherewith, the authors defined the roads circumstances which mainly involve an accident on the Belgian roads and their frequency through the clusters. The comparison between the clusters helped at finding the frequent patterns and at improving the knowledge on the accident characteristics.
Magidson et al. [22] have also studied particularly this type of clustering and compared it to the k-means method, by demonstrating the key and weak points of the latent class clus-tering. They used a simulated data favourable to k-means method. They demonstrated
that when the true group membership is known, it outperforms the k-means technique. Additionally, the latent class clustering presents more advantages in comparison with the k-means methods: it allows a better determination of the number of clusters by using diverse diagnostics (such as the BIC statistic) and does not need to standardise the vari-ables. Without the variable standardization, the variance between the clusters can differ and the scale difference produces clusters with diverse variation. The clusters having the most variation will automatically dominate the others.
Finally, Babuska et al. [24] focused their study on the Gustafson-Kessel (GK) clustering algorithm and on its fuzzy covariance matrix (see Chapter 2.2 Section 2.2.2.3). They described two techniques for improving the calculation of the fuzzy covariance matrix of the GK algorithm by using a small number of data. The authors focused their theory on the singularity of the covariance matrix and overfitting problem. If the covariance matrix is singular (i.e. an eigenvalue which defines the shape of the cluster is equal to zero or the ratio between the minimal and maximal eigenvalue is very large), the inverse of the covariance matrix Fidefined in Eq. 2.30 cannot be calculated. In this case,
the algorithm is sometimes not able to compute a correct partitioning of the data. The first proposed technique which should avoid this problem is focused on the limitation of the ratio between the maximal and minimal eigenvalues of the covariance matrix. The second technique aims at avoiding the problem of overfitting which occurs when the number of data in a cluster is too low. Additionally to the limitations of the ratio between the maximal and minimal eigenvalues, another method is proposed by the authors: the add of a scaled identity matrix to the covariance matrix. Both modifications have been included in the GK algorithm and applied on chemist data (enzymes) with of the aim of improving GK performance for small data sets. For the crash data, the GK algorithm presents an advantage in comparison with other clustering methods: the adaptation of the distance between a point and the clusters centre for the creation of the clusters does not restrict the clusters to a circular shape. The implementation of the two above men-tioned modifications should not be necessary for the collected data for this doctoral thesis.
Independently of the chosen clustering method, the clusters have to be validated. Many validity indexes have been developed during the last years. Xie et al. [9] benchmarked some current validity indexes used with fuzzy algorithms, such as the Dunn and Davies-Bouldin validity criteria. The last one presents the particularity that the distance used for calculating the compactness and the separation of the clusters can be adapted to an Euclidean or Mahalanobis distance. The performance of four validity indices have been evaluated by Maulik et al. [23]: the Davies-Bouldin, the Dunn’s, the Calinski Harabasz Indices and the Index I. For that, three clustering methods (k-means, single link and simulated annealing) have been applied on artificial data sets and for each method, the four validity indices have been tested. This experimentation demonstrated that the Index I indicated the correct number of clusters, independently of the clustering technique but one of its disadvantage is the use of the Euclidean distance to form the clusters, what influences the clusters shape. The DBI provided also good results even if the number of clusters was not always optimal. Its advantage is its adaptability to the clustering method through the distance’s calculation (Euclidean or Mahalanobis distance).
The clustering can be applied on the dummy biomechanical values, especially the GK algorithm which is able to detect different cluster’s shapes. After the output’s clustering, a classification method could help find relationships between the restraint system
param-eters (inputs) and the occupant damage (outputs).
2.1.1.2/ CLASSIFICATION METHODS
In the recent years, the classification methods became one of the most commonly su-pervised learning methods applied on traffic accident data. They allow the extraction of knowledge on factors responsible of severe injuries.
In point of fact, Chong, Abraham and Paprzycki [30] compared two classification methods, the artificial neural networks and the decision trees, concerning their ability to predict the drivers’ injury severity in head-on front impact point collisions. The data set contains reports of 6,4 million police accidents in the U.S.A. and includes information about the accidents happened between 1995 and 200 (e.g. the year, the vehicle model and the travel speed). The experiments showed the most important factors in fatal injury: driver’s seat belt usage, light conditions on the road and alcohol consumption of the driver. They also demonstrated that in this very severe case, the decision tree outperforms the artificial neural networks in accuracy, independently of the injury class. The difference between the neural network and the decision trees can reach until 14% in the case of fatal injury. The performance of the decision trees is confirmed in another publication [34].
In fact, in this study [34], they presented some models using four machine-learning ap-proaches: neural network, decision trees, hybrid model involving decision trees and neu-ral network and support vector machines. The aim of this comparison is to find the best model that classifies the injury severity (separated in 5 categories) more accurately. this study is focused on the same data set as in their precedent publication [30]. After trying all 4 methods, the authors concluded that the decision trees outperforms the neural net-work for the 5 injury classes and shows similar results as the hybrid model in accuracy, what confirms the performance of the decision trees with crash data.
As the decision trees, the rough set theory is also frequently used in research to identify factors and to predict the injury severity during a crash. Tian, Yang and Zhang [53] applied two data mining methods with the aim of analysing road traffic accidents on crash data containing the factors responsible of an accident as physiological factors (e.g. fatigue, alcohol, etc.) or mental factors (e.g. driving habits, mental, etc.). The first method is the rough set theory which allows an approximation of a set through an upper and a lower approximation sets. The second one is the theory of association rules which identifies relationships between variables. By using both methods together, they define a standard model set for analysing road traffic accidents. This study shows the advantages of the data mining when the amount of data is relatively important and explained a simple way to identify the key factors in order to prevent and reduce the road traffic accidents. Another data mining used with crash data is the Principle Component Analysis (PCA) method. It helps find relationships between variables. This technique consists of trans-forming a number of correlated variables into a number of uncorrelated variables called principal components in order to reduce the number of variables. Hilmann [46] used this method in his thesis on the structural optimization in the automobile passive safety. Af-ter applying the PCA to reduce the number of variables and to find some relationships between the variables, he used the decision trees, especially the CART, to identify the design variables having an influence on the crash car performance. The authors present this method as containing various advantages over the others, such as the little data preparation and the handling of both continuous and categorical data. The decision trees
are also simple to understand and interpret.
More recently, in 2013, Chang and Chien [62] were focused on the non-parametric regres-sion models in order to discover the factors that influence the driver injury severity during a crash. The study explores the truck accidents data collected in the Taiwan area for 2005 and 2006: the data base regroups 705 cases of truck collisions. The data contains information about the injury severity level of each occupant, the occupant himself (age, gender, degree of sobriety), the time of the accident and the type of vehicle involved in the collision. All these data produced a database of 1620 observations (after the deletion of missing data). Two types of non-parametric tree-based methods are practicable: the classification and the regression trees (depending of the target value). In this publication, the driver injury severity is separated into 3 categories (no injury, injury and fatal), and for this reason the classification tree has been developed (categorical target value). The Gini Index criterion has been chosen to evaluate the node impurity and to build the decision tree. The analysis of the classification tree showed that the main factors influencing the driver injury severity are the drinking-driving, the seatbelt use and the vehicle type. Few years ago, Chang and Wang [38] already applied non-parametric classification tree techniques on traffic injury severity data. The data was supplied by the Taiwan Ministry of Transportation and Communications and regrouped the same information type as in their publication in 2013 [62]. They concluded that the vehicle type is the most important variable associated with an accident.
The next publication confirms the popularity and the potential of the Classification and Regression Trees (CART) in the road safety field. According to Lopez et al. [66], the CART combined with the Gini Index is the most commonly applied algorithm with traffic accident data. They first preferred to test three decision trees methods (CART, ID3 and C4.5) to compare their performance. The database contains information about the level of occupant injury severity, the factors that occur (factors based on the original dataset but also on others studies) such as the context of the collision (lighting) and the driver characteristics (age and gender). The data has been collected during 7 years (2003-2009) in Spain and is focused on the accidents happened on two-lane rural highways. Even if the CART showed higher values in the precision and specified parameters, they did not want to privilege a method to the other because the C4.5 algorithm also produced very good results (only the ID3 presented worst results). The C4.5 algorithm seems to be more comfortable for studying the influence of a specific category on the injury severity because of its non-binary structure. The CART becomes more familiar for an overall study.
In a similar publication, Abellan, Lopez and al. [60] studied the decision trees, especially the extraction of their rules, in order to extract more knowledge from data. The selected data is the same as in the precedent publication of Lopez [66]. The standard decision tree is based on a selected split criterion which allows the separation of a non terminal node into branches. The structure is formed with the help of decision rules, defined as ”I f AthenB”. A represents one of the variables (here the factors that occur, the driver characteristics) and B gives the consequences of the accident (here the occupant injury severity). Each rule begins at the root node of the tree, and each variable that intervenes in the tree division engenders an ”I f ”. The rule ends in terminal nodes with ”T hen” and presents the results. Independent of the number of variables, only one decision tree is formed. The authors preferred to compile a method which develops a decision tree for each variable in order to extract more knowledge. Two split criteria have been applied: the GIx based on the Gini Index (see Eq. 2.41) and the Information Gain Ratio based on