Characterization of group B streptococcus (GBS) strains
isolated from neonatal invasive diseases in Belgium, 2015.
OBJECTIVES
Early-onset and Late-onset Diseases (EOD, LOD)
Despite advances in preventive strategies, Group B Streptococcal (GBS) disease is still a leading cause of severe neonatal infections. The Belgian National Reference Centre (NRC) routinely performs surveillances of GBS invasive strains.
To provide an overview of bacteriological characteristics of GBS causing early and late onset invasive diseases in infants during the year 2015, in Belgium.
• To characterize relevant epidemiological
markers of the isolated GBS strains.
• Determination of their capsular-polysaccharide (CPS) types and distribution. • Determination of their pili types and
distribution.
• Determination and description of their antimicrobial susceptibility profile. • Determination and distribution of macrolide
/lincosamide (MLS) resistance genotypes
.
In Belgium, GBS invasive infection is not a notifiable disease; but a regular surveillance of diseases and characterization of GBS isolates is performed by the Belgian National Reference Centre (NRC) for Streptococcus agalactiae (GBS).
Antimicrobial susceptibility profile
§
In Belgium, GBS invasive disease is not a notifiable disease. Surveillance is organized by the NRC and strains are provided by Belgian
laboratories belonging to a surveillance network. During the last decade, number of participating laboratories has increased impacting
the number of reported cases.
§
Bacteriological characteristics of GBS isolated from newborns with invasive disease (early and late-onset), CPS type distribution, pili
type distribution, rate and type of resistance to macrolide/lincosamide, were consistent with reported data among European countries
and North America.
STUDY POPULATION AND METHODS
RESULTS
DISCUSSION & CONCLUSION
Pili characterization:
PI1, PI2a & PI2b • Multiplex PCR(Springman, AC. et al.2014 BMC Microbiol. 19;14:159 )
Antimicrobial susceptibility testing
(EUCAST 2017)• Disk diffusion, categorization S.I.R.
• Dtest screening for inducible resistance to lincosamide. • Screening for reduced susceptibility to beta-lactams,
using oxacilline, ceftizoxime and ceftibuten disks according to Kimura et al (2009, J. Clin. Microbiol. 47, 4154–7) • Determination of MICs • Etest diffusion method • Microdilution method, using Sensititre® system with customized microplates
Molecular characterization of MLS resistance
• Multiplex PCR for ErmB, ErmTr, MefA and LSaC genesPopulation:
• Overall during the year 2015, on a voluntary base, laboratories belonging to the national surveillance network sent to the NRC a total of44 GBS strainsisolated from bloodculture or cerebro-spinal fluid of newborns with invasive disease.
• Laboratories were asked to fill a short Case Report Form for each reported case.
CPS Typing:
types Ia, Ib,II to IX• Serotyping, Latex agglutination (Strep B Latex, Statens Serum Institut, Denmark)
• Genotyping, PCR.
• Multiplex PCR, Types Ia, Ib, II to VIII, Poyart, C. et al. 2007 J. Clin. Microbiol. 45, 1985–8
• PCR type IX, Kong, F. et al. 2008 J. Clin. Microbiol. 46, 2745–50.
Distribution of CPS types and pili types
• A CPS type was assigned to all isolates:• The most prevalent CPS type was type III either among EOD cases (43.3%) or LOD cases (65.4%).
See Figure 2.
• Every isolate of GBS harboured at least one pili gene or a combination of genes.
• Pili genes were not evenly distributed among strains isolated from EOD or LOD.See Figure 3.
• Among the EOD cases, the pili genes PI2a (33.3%) and the combination PI1,PI2a (33.3%) were predominant, closely followed by PI1, PI2b (23.8%).
• Among the LOD cases, strains harboured mainly the combination of pili genes PI1,PI2b (45.8%).
Figure 1: Overview of the
yearly distribution of GBS EOD and LOD cases (2002 – 2015).
§ Susceptibility to beta-lactams
• All isolates were fully S to penicillinwith MICs ranging from 0.03 to 0.125 mg/L. • According to Kimura’s procedure and interpretative criteria, no decreased
susceptibility to beta-lactams was detected. § Susceptibility to macrolide-lincosamide
• Out of 44 isolates,10 (22%) were resistant to erythromycinandclindamycin.
• As shown in Figure 4 themajor phenotype of resistance was cMLS(90% of resistant isolates), the constitutive resistant phenotype. The inducible, iMLS, phenotype was demonstrated in one resistant GBS; no isolate showed isolated resistance to erythromycin (M phenotype) or the L phenotype, isolated resistance to clindamycin).
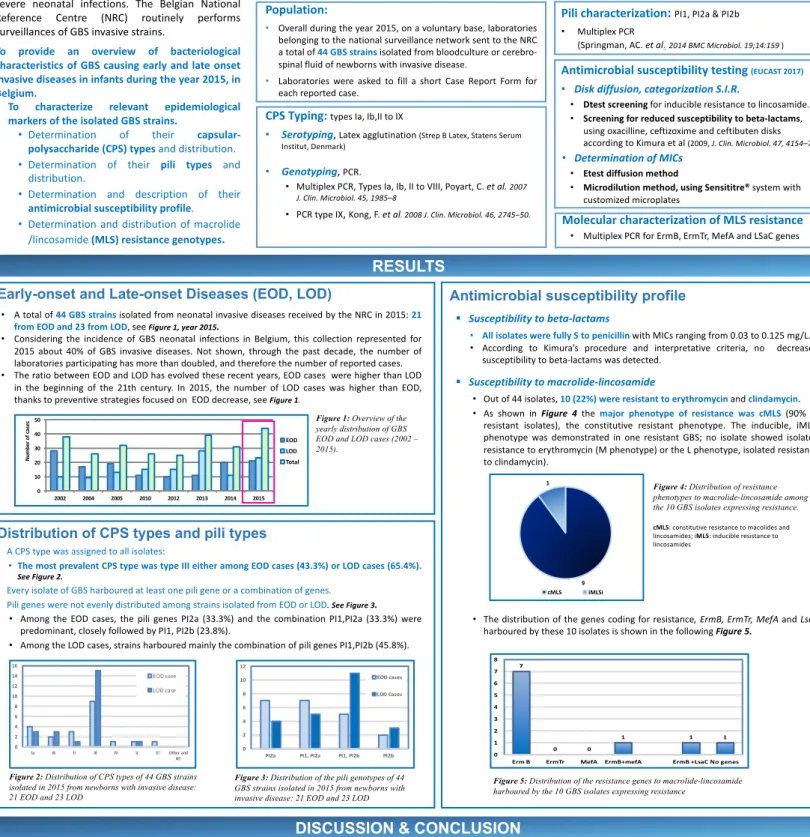
• The distribution of the genes coding for resistance, ErmB, ErmTr, MefA and LsaC harboured by these 10 isolates is shown in the following Figure 5.
Figure 5: Distribution of the resistance genes to macrolide-lincosamide
harboured by the 10 GBS isolates expressing resistance
cMLS: constitutive resistance to macolides and lincosamides; iMLS: inducible resistance to lincosamides
20-23 February 2018, CapeTown, South Africa
Rosalie Sacheli
1, Cécile Meex
2, Julie Descy
2, Pascale Huynen
2, Marie-Pierre Hayette
2, Pierrette Melin
1,2(1) National Reference Centre Streptococcus agalactiae, Clinical microbiology, University Hospital of Liege, CIRM, Liege, Belgium (2) Clinical microbiology, University Hospital of Liege, CIRM, Liege, Belgium
Corresponding author’s E-mail: r.sacheli@chu.ulg.ac.be
Figure 3: Distribution of the pili genotypes of 44
GBS strains isolated in 2015 from newborns with invasive disease: 21 EOD and 23 LOD
Figure 2: Distribution of CPS types of 44 GBS strains
isolated in 2015 from newborns with invasive disease: 21 EOD and 23 LOD
Figure 4: Distribution of resistance
phenotypes to macrolide-lincosamide among the 10 GBS isolates expressing resistance.
9 1
cMLS iMLSi
• A total of44 GBS strainsisolated from neonatal invasive diseases received by the NRC in 2015:21 from EOD and 23 from LOD, seeFigure 1, year 2015.
• Considering the incidence of GBS neonatal infections in Belgium, this collection represented for 2015 about 40% of GBS invasive diseases. Not shown, through the past decade, the number of laboratories participating has more than doubled, and therefore the number of reported cases. • The ratio between EOD and LOD has evolved these recent years, EOD cases were higher than LOD
in the beginning of the 21th century. In 2015, the number of LOD cases was higher than EOD, thanks to preventive strategies focused on EOD decrease, seeFigure 1.
0 10 20 30 40 50 2002 2004 2005 2010 2012 2013 2014 2015 Nu m be rof c as es EOD LOD Total 0 2 4 6 8 10 12
PI2a PI1, PI2a PI1, PI2b PI2b EOD cases LOD Cases 0 2 4 6 8 10 12 14 16 Ia Ib II III IV V VI Other and NT EOD case LOD case 7 0 0 1 1 1 0 1 2 3 4 5 6 7 8