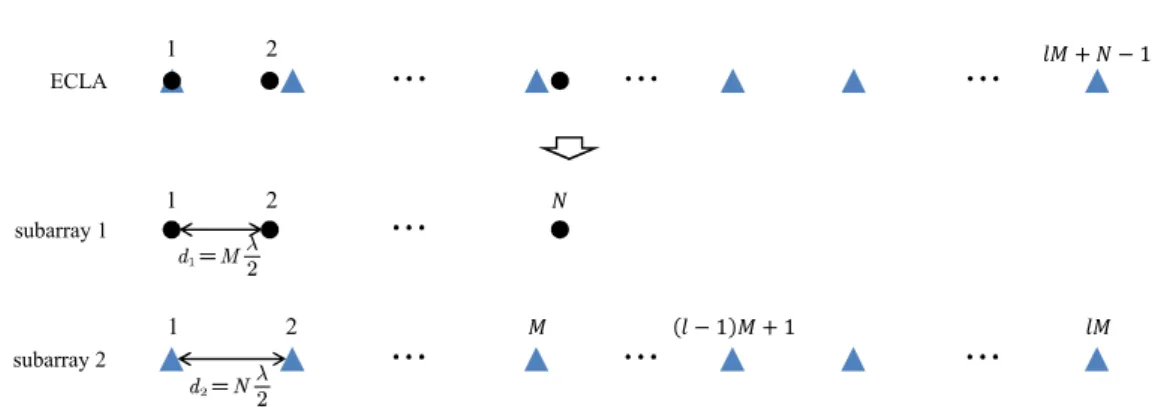
Direction of Arrival Estimation with Coprime Arrays
Texte intégral
Figure
Documents relatifs
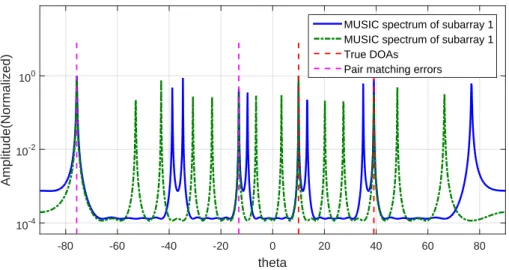
4) For a small number of sensors and for closely spaced DOA associated with block-diagonal source covariance, the P-MUSIC, the WP-MUSIC, and the P-MUSIC (SI) algorithms outperform
Characterization and comparison of French and Brazilian Potato virus Y (PVY) isolates collected from PVY-susceptible or -resistant tobacco plants carrying the recessive resistance
Next, to identify genes most strongly dependent on MYCN for their expression among all direct targets of LMO1, we performed RNA-seq after MYCN knockdown (Supplementary Fig. 3c, d)
The first two columns of this table confirm the pattern shown in Figure 2 in the Introduction; real output grows faster in high capital intensity sectors, while employment grows
Coté rotor, pendant que le champs magnétique rotorique rejoint le champs magnétique statorique, les courants rotoriques induits diminuent pour atteindre une valeur nulle. A ce
Enfin le dernier chapitre est consacré à la mise en œuvre clinique pour deux qualités de faisceaux de photons (6 et 18 MV) du contrôle qualité dosimétrique
Comme nous l'avons montré en 5.2.1., les indices d'expression de la saillance activés dans le début du récit du chat perdu sont, en français, la construction relative
( f ) By considering the true position of the tunnel, the maximum uncertainty in the surface settlement in a given zone is of the order of 9.6% when the autocorrelation distance
