A 3000-year Record of Surface Rupturing Earthquakes at Gunalan;
1
Variable Fault Rupture Lengths on the 1939 Erzincan Earthquake
2
Rupture Segment of the North Anatolian Fault, Turkey
3
Short title: Paleoseismology Gunalan Turkey 4
AUTHORS: 5
Fraser, J. G.*1, Hubert-Ferrari, A.1, Verbeeck, K.1, Garcia-Moreno, D.1, Avsar, U.1, 6
Maricq, N.2, Coudijzer, A.3, Vlamynck, N. 3 Vanneste, K.1 7
*Corresponding author is Dr. Jeff Fraser (jeph4e@gmail.com, Ph: 00447523567585, no fax) 8
1 Royal Observatory of Belgium 9 Seismology Section 10 Avenue Circulaire 3 11 1180 Brussels 12 Belgium 13
2 Université Libre de Bruxelles 14
Départment des Sciences de la Terre et de L‘Environnement 15 Avenue F.D. Roosevelt 50 16 B-1050 Brussels 17 Belgium 18 3 University of Gent 19
Department of Geology and Soil Science 20 Krijgslaan 281 21 9000 Gent 22 Belgium 23 24 Aurelia.Ferrari@ulg.ac.be nathaliemaricq@gmail.com koen.verbeeck@oma.be alexander.coudijzer@gmail.com davidgm08@gmail.com neel_le@hotmail.com avsarulas@yahoo.com kris.vanneste@oma.be
Key words: Paleoseismology, North Anatolian Fault 25
04.04.01. Earthquake geology and paleoseismology 26
04.06.01. Earthquake faults: properties and evolution 27
04.07.04. Plate boundaries, motion, and tectonics 28
Abstract
30
The North Anatolian Fault is a ~1200 km long right-lateral strike-slip fault that forms the 31
northern boundary of the Anatolian plate. A damaging sequence of earthquakes ruptured 32
almost the entire fault in the twentieth century. This study adds to the growing number of 33
paleoseismic investigations on the 350 km long 1939 Erzincan earthquake rupture 34
segment, which is toward the eastern end of the North Anatolian Fault in Turkey. Using 35
three paleoseismic trenches located along about 2km of the principal fault strand, this 36
study determines the timing of five earthquakes prior to the 1939 earthquake. The first 37
three earthquakes are correlated to historical earthquakes in A.D. 1668, 1254, 499 and 38
two further events were identified at 881 – 673 B.C. and 1406 – 1291 B.C. (2σ age 39
ranges). By comparing the earthquake timing determined in this study to the results of 40
other paleoseismic investigations on the 1939 rupture segment, it becomes clear that this 41
historical rupture segment does not always rupture in unison. This analysis indicates that 42
the A.D. 499 earthquake was the last time the 1939 rupture segment ruptured in unison; 43
although partial ruptures of the 1939 rupture segment occur more frequently and also 44
produce large magnitude earthquakes (> Mw 7). 45
1.
Introduction
47
The Anatolian plate is moving toward the west, principally due to the collision of the 48
Arabian plate into Eurasia (Fig. 1a, e.g. Flerit et al., 2004; Sengor et al., 2005). During 49
the twentieth century a sequence of large magnitude earthquakes ruptured most of the 50
NAF causing catastrophe to local populations and infrastructure (e.g. Barka, 1996). This 51
sequence of large earthquakes began with the 1939 Erzincan earthquake and proceeded to 52
migrate in a cascading sequence, first to the west and then to the east and west (Stein et 53
al., 1997). The most recent large surface-rupturing earthquakes in the sequence occurred
54
near the eastern end of the Marmara Sea in 1999 (i.e. Barka et al., 2002; Gulen et al., 55
2002). Stein et al. (1997) modeled the Coulomb failure stress changes caused by the 56
earthquakes of the twentieth-century earthquake sequence on the NAF. They found that 57
earthquake-induced stress changes raised the probability of fault rupture at the sites 58
where subsequent earthquakes occured (Stein et al.,1997). Fault rupture causes a stress 59
drop on the slipped fault and an increases in stress at nearby locations, hence bringing 60
nearby faults closer to failure (Stein et al.,1997). Where nearby faults have already 61
accumulated near-critical stress levels this can trigger an earthquake. This process 62
suggests a mechanism for the cascading twentieth-century sequence of large earthquake 63
on the NAF. However, it does require that the levels of stress along the sections of the 64
fault that ruptured in the twentieth century sequence were all at a near-critical level. This 65
raises the question; does the NAF always rupture in a cascading sequence like that 66
observed in the twentieth century? 67
Turkey has a long historical record of earthquakes (e.g. Ambraseys, 1970; Ambraseys and 68
Finkel, 1995; Ambraseys and Jackson, 1998; Guidoboni and Comastri, 2005; Guidoboni
69
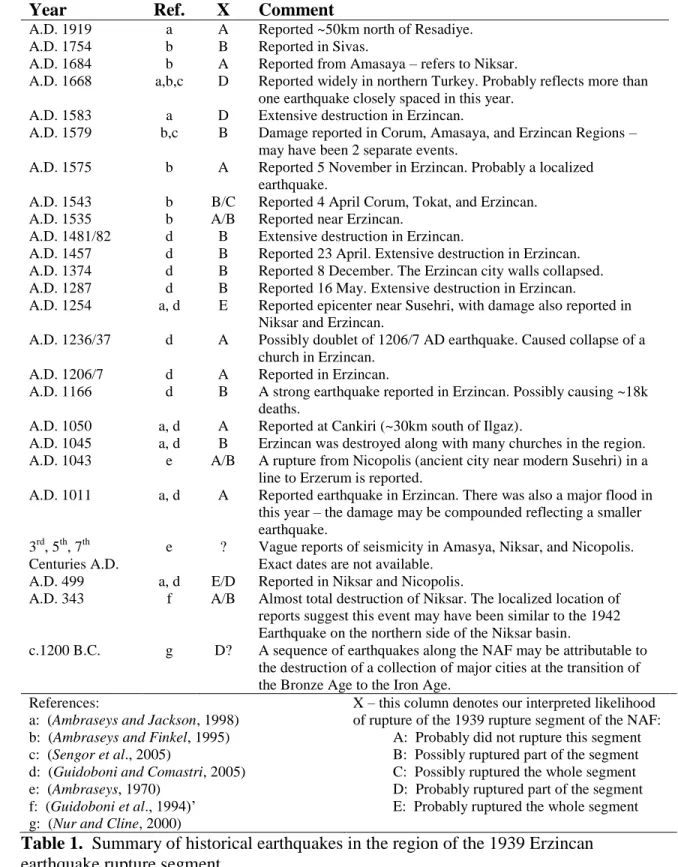
et al., 1994; Nur and Cline, 2000; Sengor et al., 2005). We have compiled a list of
70
historical earthquakes that may have ruptured all or part of the 1939 Erzincan fault 71
rupture segment from various sources (Table. 1). Historical earthquake records are 72
typically temporally precise and accurate compared to the results of paleoseismic 73
investigations which have relatively low precision in time because of the uncertainties 74
inherent in constraining paleoearthquake ages. However, historical earthquake records 75
are typically spatially imprecise (i.e. it is seldom specified which fault or fault segment(s) 76
ruptured to cause an earthquake) whereas paleoseismic investigations can yeild 77
earthquake records for a specific point on a particular fault strand. A paleoseismic trench 78
investigation can constrain when a particular fault strand ruptured the ground surface; by 79
using radiocarbon dating in conjunction with Bayesian statistical modeling (Biasi and 80
Weldon, 1994; Biasi et al., 2002; Hilley and Young, 2008a, 2008b) we can obtain
81
relatively precise paleoearthquake timing that incorporates quantification of uncertainty. 82
By comparing paleoearthquake timing from paleoseismic trenching investigations at 83
multiple sites along adjoining fault segments, we can estimate the ground surface 84
rupturing length for large magnitude earthquakes (generally M >6.5), which is a proxy 85
for paleoearthquake magnitude (e.g. Wells and Coppersmith, 1994; Anderson et al., 86
1999). The completeness of earthquake records from both the historical and paleoseismic 87
investigations is uncertain because the absence of evidence is not evidence of absence 88
(i.e. neither means of investigation provides a definitive complete record of surface 89
rupturing earthquakes). Therefore combining the historical and paleoseismic data 90
provides the best long-term spatiotemporal earthquake data. 91
To date, more than 50 paleoseismic investigations have been conducted along the NAF. 92
In the present study, we focus on the 1939 Erzincan Earthquake rupture segment. There 93
have been many paleoseismic investigations along this segment, particularly in the area 94
immediately west of this study area, however these results have not been published (i.e. 95
conference abstracts: Okumura et al., 1994; Zabci et al., 2008) but investigations at 96
Resadiye (Fraser, 2009b), Yaylabeli (Kozaci et al., 2011) and Cukurcimen (Hartleb et 97
al., 2006) are publicly available.
98
This paper presents a paleoseismic study at Gunalan (N:40.024°, E:38.627°), which is 99
located on the 1939 Erzincan earthquake rupture segment (Fig. 1b). The magnitude Mw 100
7.7 (Anderson et al., 1996) Erzincan earthquake caused widespread damage and loss of 101
life (Barka, 1996). The paleoseismic investigation at Gunalan focuses on determining a 102
long record of the timing of paleoearthquakes. The paleoearthquake chronology 103
determined in this study has been used by Fraser et al. (2010a), who summarize publicly 104
available paleoearthquake data on the NAF and compare the data from selected studies 105
along the entire NAF. Gunalan is located between previous paleoseismic investigations 106
on the 1939 Erzincan earthquake rupture segment at Resadiye (Fraser, 2009b) to the west 107
and Yaylabeli (Kozaci et al., 2011) and Cukurcimen (Hartleb et al., 2006) to the east 108
(Fig. 1b). In this paper the timing of paleoearthquakes determined at Gunalan is 109
compared with the timing of paleoearthquakes determined in the other paleoseismic 110
investigations on the 1939 Erzincan Earthquake fault rupture segment and with the 111
historical earthquake record (Table 1), to investigate the nature of fault rupture along this 112
section of the fault during the preceding cycles of seismicity. 113
2. Regional Tectonic Setting
114
Over geological time, as the Arabian plate moves northward relative to the Eurasian 115
plate, the wedge-shaped Anatolian plate is squeezed in an approximately north-south 116
direction causing it to translate toward the west (Fig.1a). Back-arc extension in the 117
Aegean region, associated with subduction at the Hellenic arc, may provide a pulling 118
force on the Anatolian Plate (Flerit et al., 2004; Pondard et al., 2007). The North 119
Anatolian Fault (NAF) formed in a similar tectonic regime as the present and initiated in 120
the east around 13 Ma (Sengor et al., 1985). Utilizing weaknesses in the lithosphere 121
associated with pre-existing suture zones the proto-NAF propagated westwards, reaching 122
the Marmara Sea by about 5 Ma (Armijo et al., 1999; Hubert-Ferrari et al., 2002) 123
although this is still debated (e.g. Sengor et al., 2005). Offset features such as suture 124
zones, prominent geomorphic features, the Niksar and Tasova-Erbaa pull-apart basins, 125
and other basins that developed during the formation of the NAF, suggest that it has 126
undergone a total of approximately 85 km of right-lateral offset (e.g. Barka et al., 2000; 127
Hubert-Ferrari et al., 2009; Sengor et al., 2005).
128
Offset Holocene geomorphic features along the NAF suggest a slip-rate of 18.5±3.5 129
mm/yr with a right-lateral strike-slip style (Hubert-Ferrari et al., 2002). A GPS based 130
study of the Eastern Mediterranean region (Reilinger et al., 2006) indicates that the rate 131
of right-lateral strike-slip offset in the vicinity of the study area is approximately 132
27.7±0.2 mm/yr with a negligible extensional component. Thus, the Holocene slip rate is 133
~65% of the GPS-based slip rate. However, because the GPS data have only been 134
collected after the twentieth-century earthquake sequence it may also account for some 135
post-seismic relaxation. Furthermore, because GPS monitoring stations are mostly 136
located a significant distance from the NAF, GPS rates also account for deformation on 137
subordinate plate boundary structures (faults and folds) and intra-plate deformation. The 138
comparison of GPS-based and Holocene geomorphic deformation based slip rates 139
suggests that most of the tectonic deformation associated with the northern edge of the 140
Anatolian plate is accommodated by the NAF, with considerably less than 35% of the 141
tectonic deformation accommodated intra-plate. 142
The East Anatolian Fault (EAF) accommodates the left-lateral strike-slip deformation on 143
the Anatolian-Arabian plate boundary, which is the southeastern margin of the Anatolian 144
plate. Other individual faults near the plate boundary and within the Anatolian plate are 145
likely to be significantly less active (perhaps accommodating an order of magnitude less 146
deformation). For example, the Ovacik (OF) and Almus Faults (AlF) (Fig. 1b) 147
accommodate some of the Anatolian-Eurasian plate boundary deformation within the 148
Anatolian plate. Some of the Eurasian-Anatolian plate boundary movement is 149
accommodated by faults to the north of the NAF; for example the North East Anatolian 150
Fault (NEAF) (Fig1b). Notably, the geological history and activity of many of these 151
faults, particularly those located away from the principal plate boundary faults, are not 152
well constrained. Therefore, it is only possible to speculate about the relationships 153
concerning crustal stress and strain between these faults and the NAF. 154
2.1. Neotectonics near the study area
155
Our study area is located near the western end of the Mihar-Tumekar fault segment 156
(Barka, 1996, Fig. 1) on the southern side of the Golova basin. Kocyigit (1990) 157
described the Golova basin as an active basin along this segment of the NAF and 158
Kocyigit (1989) described the Susehri basin, which is located immediately west of the 159
Golova basin, as an active fault wedge basin. We speculate that the Golova and Susehri 160
basins were originally one pull-apart basin that was abandoned in favor of a new 161
optimally oriented principal deformation zone through the pull-apart basin. This 162
abandonment of the proto Susehri-Golova pull-apart basin may be coincident with the 163
abandonment of the Tasova-Erbaa pull-apart basin ~125 km to the west (Fig. 1b) 164
documented by Barka et al. (2000). However, a detailed neotectonic study is required to 165
support this hypothesis. The presence of these neotectonic structures may have an 166
influence on fault rupture propagation on the Mihar-Tumekar and adjacent fault 167
segments. 168
2.2. Fault Segmentation
169
Active fault traces are generally not continuous, and have discontinuities that appear as 170
steps or bends in the fault geometry. Depending on their scale, such discontinuities may 171
slow or stop fault rupture propagation (Wesnousky, 2006). On strike-slip faults, map-172
view steps in the fault trace cause transpressional or transtensional stress and strain, 173
resulting in structures such as pop-up structures and pull-apart basin, respectively. 174
Wesnousky (2006) studied the importance of the size of discontinuities for fault rupture 175
propagation using historical earthquakes on strike-slip faults and found that 176
discontinuities with step-over distances of up to 4 km could be ruptured across in an 177
individual event, although sometimes smaller discontinuities could inhibit fault rupture 178
propagation. 179
‗Fault rupture segments‘ are sections of a fault that have ruptured during one earthquake. 180
Thus, to define one, the extent of ground surface rupture must be mapped either soon 181
after an earthquake or by detailed observations of relict geological and/or 182
geomorphological features caused by ancient surface rupture (e.g. multiple paleoseismic 183
studies along a fault). 184
‗Fault segments‘ are sections of a fault bounded by discontinuities which may stop or 185
slow fault rupture propagation and a defined based on judgment of fault geometry. 186
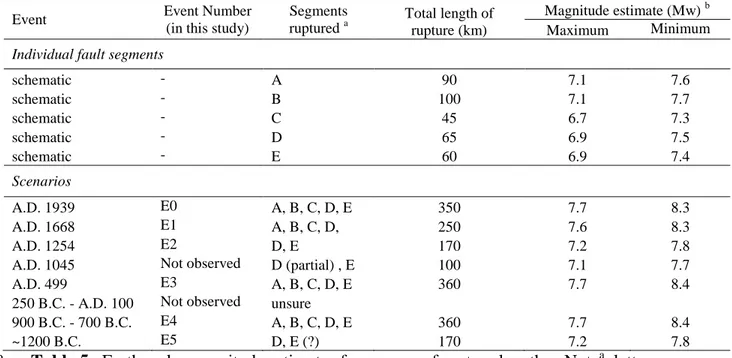
The 1939 Erzincan earthquake fault rupture segment was described by Barka (1996) and 187
references therein; it extended from the Erzincan pull-apart basin in the east to near the 188
village of Ezinepazari in the west (Fig. 1b) with a rupture length of ~350 km (Anderson et 189
al. 1999). The western end of the rupture included the Ezinepazari fault which splays to
190
the southwest from the main NAF trace at the southern side of the Niksar pull-apart 191
basin. 192
Barka (1996) partitioned the 1939 Erzincan fault rupture segment in to five fault 193
segments as illustrated in Figure 1b and 1c. He defined the segment boundaries by 194
discontinuities in map view geometry of the active fault trace. Ezinpazari and Kelkit 195
Valley segments intersect at the south side of the Niksar pull-apart basin, the western and 196
eastern ends of the Ortakoy-Susehri segment are defined by significant bends in the fault 197
trace, and the Mihar-Tumekar to Erzincan fault segment boundary is defined as a 20° 198
restraining bend (see Barka, 1996 for further detail). 199
One aspect of this study is to investigate if the fault segments that ruptured in the 1939 200
Erzincan Earthquake always rupture in tandem by comparing the timing of 201
paleoearthquakes identified at Gunalan and three other locations along the fault rupture 202
segment. 203
3. Tectonogeomorphology of the study area
204
In this study we use tectonic geomorphology to identify the principal fault across which 205
to undertake paleoseimic trenching studies to investigate the timing of paleoearthquakes. 206
No tectonogeomorphic measurements have been made in this study. The study area is 207
located on the southeast side of the Cobanli River, near the village of Gunalan 208
(N:40.024°, E:38.627°), on the southern side of the Golova basin (Fig. 1b). There are 209
three clearly active fault strands in the study area (Fig. 2a), which we have labeled Faults 210
A – C, from north to south (Fig. 2). 211
Locally, Kocyigit (1990) documented a broad (~12km fault-normal) damage zone caused 212
by the 1939 earthquake with small vertical displacements on many faults, but the 213
majority of the slip (right-lateral) was accommodated by the principal deformation zone 214
fault (equivalent to Fault A in this study). This broad damage zone may reflect 215
reactivation of structures associated with the Golova basin. 216
Kocyigit (1990) measured four right-laterally offset features near the study area on the 217
principal deformation zone fault (Fault A), although we were unable to identify these 218
features during field work. The three right-lateral offsets were accompanied by 0.3m to 219
3.5m of vertical displacement and comprised: (1) a field boundary offset by 5.5m ~18km 220
west of Gunalan, (2) a field boundary offset by 6.4m ~13km west of Gunalan, (3) a line 221
of Poplar trees offset by 5.7m ~5km west of Gunalan, and (4) an irrigation canal offset by 222
5.6m ~2.5km (Fig. 2a) west of Gunalan (Kocyigit, 1990, pg 165). Right-lateral offset (4) 223
was used by Barka (1996) and is shown in Figure 1c. Additionally, Kocyigit (1990, pg 224
165) noted three locations where ―…the southern and northern blocks alternately 225
subsided and uplifted up to 3.5m‖ and these were located: (5) ~300m east of Gunalan 226
(Fig. 2a), (6) ~600m northeast of Gunalan (Fig. 2a), and (7) ~14km east of Gunalan. 227
Kocyigit (1990) described a splay of the principal deformation zone fault that traces 228
along the northern side of a prominent elongate linear ridge shown in the middle of 229
Figures 2c and 2e on which offset (6) was attributed to the 1939 earthquake. We 230
recognized a lateral spread in this area (Fig. 2c and f) but no evidence of faulting. Lateral 231
spreads are a type of shallow translational landslide that occur on gently sloping to flat 232
ground and are relatively abundant during earthquakes due to failure on zones of 233
liquefied soils (Keefer, 1984). Discussions with local residents indicate that this lateral 234
spread occurred, or was at least reactivated, during the 1939 Erzincan Earthquake. We 235
interpret that this offset was actually attributable to the lateral spread. Kocyigit (1990, pg 236
165) also notes that the southern strand (fault C) of the bifurcated Coblani fault (faults B 237
and C) were ―reactivated by ground ruptures‖ during the 1939 earthquake (see label 8 in 238
Figure 2a). Based on the geomorphological expression of the three fault strands in the 239
study area we are inclined to agree with Kocyigit‘s (1990) interpretation of the relative 240
activity of fault strand A, B and C. The very clear tectonogeomorphic features associated 241
with fault A suggest that this is the principal deformation zone. Fault C has clear 242
geomorphic expression suggesting that this strand ruptured in the 1939 earthquake, while 243
Fault B has a less clear geomorphic expression suggesting that this strand did not rupture 244
in the 1939 earthquake. 245
The features of the study area are described from west to east (Fig. 2). The Cobanli River 246
flows towards the north until it crosses the NAF, downstream of which it bends and flows 247
towards the east (Fig. 2a). The geomorphology of the western portion of the study area is 248
an alluvial flood plain across which fault A is evidenced by a subtle fault scarp (i.e. less 249
than ~0.2m) that steps down to the south. The ground is considerably wetter on the south 250
side of the fault, which corresponds to a recognizable change in vegetation color (Fig. 251
2b). Southeast of the alluvial plain the terrain is hilly, dominated by linear ridges that run 252
sub-parallel to the fault. We attribute these linear ridges to low-activity (relative to fault 253
A), possibly reactivated, fault strands. Local ephemeral streams, which generally flow 254
towards the north, have eroded gullies through the linear ridges at some locations. The 255
village of Gunalan is situated near the point where the trace of Fault A leaves the alluvial 256
plain to the west and passes into the hilly terrain (Fig. 2a) where it runs along the 257
southern side of an elongate linear ridge for approximately 3 km east of Gunalan. 258
Alluvial fan and wetland deposits fill a depression formed between the hills to the south 259
and the elongate linear ridge. 260
The elongate linear ridge is composed of Pliocene continental clastics of the Cobanli 261
Group that is part of the Upper Pontus Formation (Barka, 1992). There are three possible 262
scenarios that may have formed the elongate linear ridge feature (in order of preference): 263
(1) Strike-slip offset Pliocene deposits making this primarily a shutter ridge. For this 264
scenario there is no need to have a bounding fault on the northern side of the 265
ridge, river erosion alone can explain the concaved slope break along the 266
northern side of the elongate linear ridge. This is consistent with our 267
interpretation that the fault mapped by Kocyigit (1990) on the northern side of 268
the elongate linear ridge is not present. 269
(2) A pop-up-structure or pressure ridge. For such a feature to form, there would 270
need to be a fault on the northern side of the elongate linear ridge, for which we 271
did not recognise any geomorphological evidence. 272
(3) A significant dip-slip component of displacement, down on the south side of the 273
fault, may have caused the topographic step on the south side of the ridge. The 274
topographic step down to the north on the northern side of the ridge may have 275
been caused by river bank erosion. Thus the elongate ridge would be the 276
remains of an elevated area comprising the hanging-wall block, the northern part 277
having been eroded away by the Cobanli River. 278
While we cannot rule out any of these three scenarios, we think that scenario 1 is the 279
most probable as it is the simplest explanation. Regardless of how the elongate ridge 280
formed, it is clearly bounded by a fault on its southern side and the concave slope-break 281
at its base traps small alluvial fans from local northward draining ephemeral streams. 282
The fans have a typical conical geometry with apices at small valleys that drain the hills 283
to the south. Between the alluvial fans, where they abut the fault scarp, reed beds and 284
associated organic-rich wetland deposits have developed. 285
South of the elongate linear ridge faults B and C splay southward. Our interpretation of 286
the local geomorphology is that the depression between faults A and B (which the 287
alluvial fans are filling) reflects long-term incremental subsidence and the linear ridge 288
between faults B and C reflects long-term incremental uplift. Sediments are trapped as a 289
consequence of the linear ridge between faults B and C, and form a flat area on the south 290
side of fault C (Fig. 2d). 291
To the east of the junction of faults A and C, fault A has a relatively simple straight trace 292
across a terrace of the Cobanli River. The ground surface to the north of the fault is 293
slightly folded up, forming a subtle anticline (the eastward continuation of the linear 294
ridge) that traps fine-grained sediments on the south side of the fault. The vegetation is 295
darker on the south side of the fault. Near the eastern end of the field area (Fig. 2a), field 296
observations indicate that saline water ponds are forming a salina on the south side of the 297
fault and travertine is forming on the north side of the fault. 298
4. Paleoseismic trenching
299
To investigate the variability of fault rupture lengths along the 1939 Erzincan Earthquake 300
fault rupture segment by comparing the results of paleoseismic investigations we require 301
long records of earthquake timing that incorporate as many seismic cycles as possible. 302
In-light of this objective, this study employs a paleoseismic trenching strategy to attain 303
the longest possible record of earthquake timing rather than focusing on collecting other 304
paleoseismic parameters such as offset per event and slip rate. In particular, this involves 305
undertaking trenches perpendicular to the fault and in locations with prolonged distinctive 306
and relatively continuous or frequent sedimentation that provide evidence for numerous 307
paleoearthquakes and can be safely exposed in a paleoseismic trench. These trenching 308
location attributes are traded-off against locations where piercing points might be 309
encountered that could yield rates of horizontal and vertical deformation. 310
We selected a number of potential paleoseismic trenching locations in the study area and 311
evaluated them by opening test-pits. Apart from test-pits across fault C, where we 312
encountered homogenous strata, all of the other test-pits were across fault A and many 313
were abandoned because of shallow groundwater (0.1 – 1.0 m below the surface). Four 314
test-pits were expanded into paleoseismic trenches and are labeled T1 to T4, from west to 315
east (Fig. 2a). Trenches T1 and T2 are located on the alluvial plain between the Cobanli 316
River and Gunalan (Fig. 2b). Trench T3, by far the largest trench, was situated at the 317
base of the fault-bounded southern side of the elongate linear ridge in the inter-fan fine-318
grained deposits (Fig. 2c). Trench T4 was about 2 m deep (to the top of the groundwater 319
table) and revealed evidence of two to four paleoearthquakes, which offset stratified, 320
thinly bedded (~5 cm) organic and inorganic deposits. Unfortunately, Trench T4 was 321
abandoned because of voluminous (estimated 5 l/s) discharge of unidentified gasses 322
which may have been detrimental to health. Therefore, trench T4 is not discussed further. 323
Paleoseismic trenches were logged in the field using a 1m x 1m (or smaller) string grid 324
on the trench walls and using a co-ordinate system (with the origin located below the 325
northern base of the trench). Stratigraphic units were logged, described and given unit 326
symbols. Photo mosaics of the trenches were made using photos taken during dispersed 327
lighting conditions. Photos were corrected for spherical divergence and crudely for the 328
geometry of the trench walls, but this is an imperfect process and is the reason for some 329
discrepancies between the trench logs and the photo mosaics. Further discrepancies may 330
also be due to small-scale erosion and cleaning of the trench walls between trench 331
logging and trench photography. We describe the results of each paleoseismic trench in 332
the following sections. We use the term ‗event horizon‘ to describe a horizon that is 333
interpreted to correspond to a former ground surface (i.e. now buried) at the time of a 334
ground surface rupturing earthquake. 335
Paleoseismic trenches T1 and T2 revealed clear evidence of one and three 336
paleoearthquakes respectively. The more conventional evidence of paleoearthquakes in 337
paleoseismic trenches T1 and T2 are used to validate the less conventional evidence of 338
six paleoearthquakes revealed in paleoseismic trench T3. Because the number of 339
paleoearthquakes are relatively few in paleoseismic trenches T1 and T2, the age of the 340
event horizons are described along with the evidence of paleoearthquakes in Sections 4.1 341
and 4.2. Because the record of paleoearthquakes in paleoseismic trench T3 is longer and 342
the timing of earthquakes is validated by the findings of paleoseismic trenches T1 and T2, 343
this paleoearthquake timing record is described in the section 5. Paleoearthquake Timing. 344
4.1. Paleoseismic Trench T1
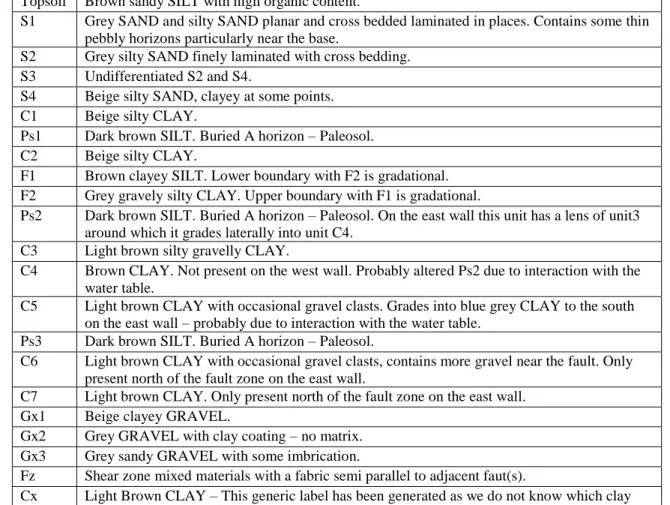
345
Paleoseismic trench T1 was excavated to the top of the groundwater table on the alluvial 346
plain of the Cobanli River (Fig. 2). The trench revealed a faulted sequence of 347
interbedded clay (Cn), silty clay and clayey silt (Fn), sand (Sn) and organic soils (Psn) 348
overlying river gravel (Gxn). Figure 3 presents the trench log, Figure 4 presents a photo 349
mosaic of part of the east wall of the trench, and stratigraphic unit descriptions are 350
presented in Table A.A-1 (Annex A). 351
Trench T1 revealed clear evidence for one surface-rupturing earthquake (T1E0) based on 352
clear and multiple fault terminations at or near the base of sand unit S3. Based on this 353
interpretation, fault scarps formed following the event remained near vertical while unit 354
S3 was deposited. Cross bedding in sand unit S3 (above the event horizon) suggests that 355
it is an aeolian deposit, with the sand possibly blown from the bed of Cobanli River or 356
possibly reflecting an abundance of sand produced by liquefaction. This would explain 357
why the fault scarp or free-face remained intact while unit S3 was deposited, because if 358
the sand deposits were from a fluvial source one would expect the free-face to have been 359
more eroded. 360
Our interpretation is that the one event recorded in this trench is the 1939 Erzincan 361
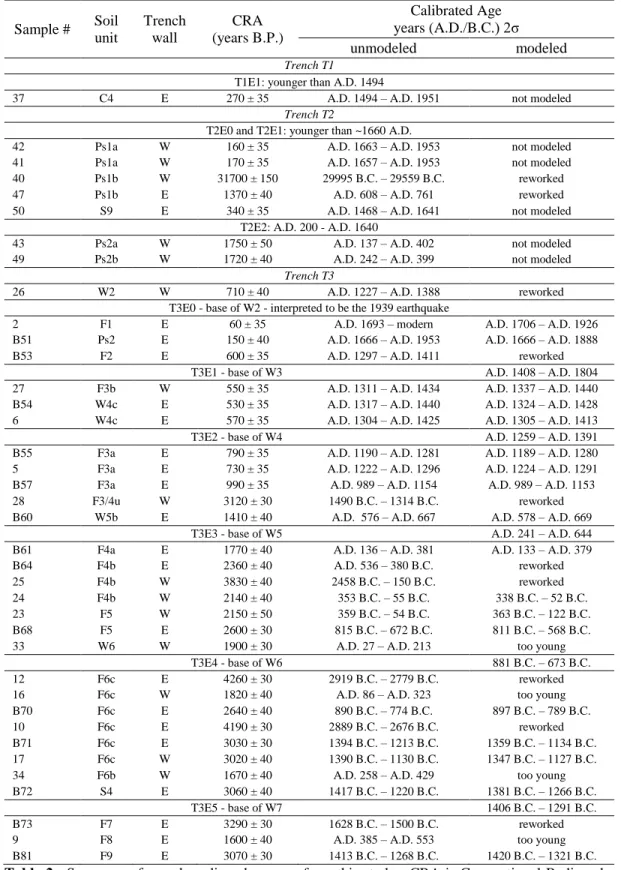
earthquake. To confirm our interpretation we radiocarbon-dated a single sample (sample 362
37) from below the event horizon, which yielded a calibrated radiocarbon age of A.D. 363
1494 to present (2σ age range) (Table 2) (note. ‗present‘ is used to reflect 1950 in 364
accordance with Stuiver and Polach, 1977). Therefore, paleoseismic trench T1 provides 365
evidence for one surface-rupturing earthquake that occurred on this segment of the fault 366
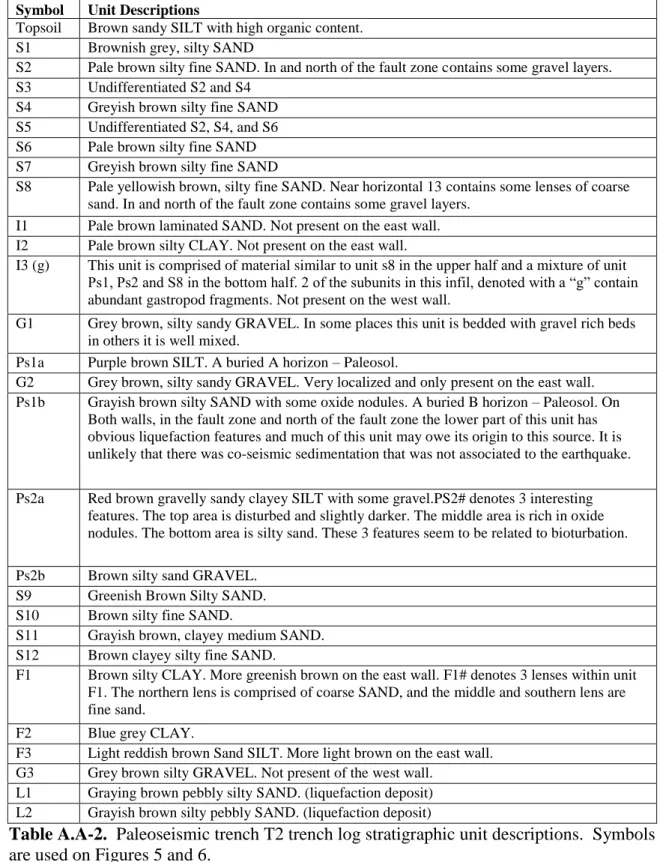
after sometime between A.D. 1494 and the present. 367
4.2. Paleoseismic Trench T2
368
Paleoseismic trench T2 was excavated down to the top of the groundwater table on the 369
alluvial plain of the Cobanli River, closer to Gunalan than trench T1 (Fig. 2). The trench 370
revealed a faulted sequence of organic rich soils (Psn), sand (Sn), silt and clay (Fn), 371
gravel (Gn), with fissure infills (In) and liquefaction deposits (Ln). Figure 5 is a log of 372
both trench walls, Figure 6 is a photo mosaic overlain with the lines and labels of the 373
trench log, and stratigraphic unit descriptions are shown in Table A.A-2 (Annex A). 374
Trench T2 revealed evidence for three earthquakes, which we label from youngest to 375
oldest T2E0, T2E1 and T2E2. The youngest event, T2E0, has subtle evidence and 376
therefore evidence for T2E1 is described first. Event T2E1 is defined by fault 377
terminations that extend to the base of sand unit S6 on the east wall of the trench, (i.e. 378
Fig. 5, at horizontal distances 6.5 m and 8 m on the east wall). Coincident with these 379
fault terminations is a downward tapering wedge-shaped deposit on the east wall at a 380
horizontal distance of 12 – 13 m (Fig. 5) which we interpret as a fissure-fill deposit (I3). 381
The fissure fill deposit (I3) is interpreted to have formed in a tension crack opened due to 382
the folding of paleosols Ps1a and Ps1b down toward the fault and possibly associated 383
with some horizontal deformation. Evidence for the youngest event, T2E0, is restricted 384
to the fault zone on the west wall (at ~7 m on the horizontal axis) where there are two 385
fissure fill deposits (I1 and I2) that rest on a block of sand units (sand units S8-4) between 386
two fault strands. The fault strand on the southern side of these deposits extends to the 387
top of S4 which is a higher stratigraphic level than the faults on the east wall. Together, 388
these observations suggest that the top of unit S4 is an event horizon, which we label 389
event T2E0, and that the base of sand unit S6 is also an event horizon, which we label 390
event T2E1. Unfortunatley, T2E0 is only evidenced on the west wall, which 391
considerably weakens the strength of our interpretation. Event T2E2 is evidenced by 392
increasing deformation with depth. North of the fault zone on the west wall, paleosol 393
Ps2a is folded down towards the fault, whereas the overlying paleosols are flatter lying. 394
Between the fault strands, at around a horizontal distance of 7 m on the east wall, 395
paleosol Ps2 is also folded down toward the fault and is overlain by fine grained 396
sediments and sand layers that thin to the north indicating onlap on to a folded surface. 397
Units between and including F1 and S9 exposed on the southern side of the northern most 398
fault strand on the east wall appear to have deposited onto a folded Ps2a (i.e. they thin to 399
the north). Therefore, event horizon T2E2 can be constrained to between units Ps2a and 400
F1. We interpret the top of Ps2 to be a fault-zone angular unconformity. Therefore, we 401
consider the top of paleosol Ps2a to be the event horizon that corresponds to event T2E2. 402
Liquefaction deposits were recognized on both walls of the trench. It is assumed that the 403
source layer(s) for the liquefaction deposits is below the strata exposed in this trench. L2 404
is a horizontally bedded sand deposit with pebble horizons that rests on top of Ps2a. L2 405
is only exposed for ~2m on the trench wall and becomes laterally finer and eventually 406
indiscernible from Ps1b. Near the centre of the horizontal extent of L2, the deposit 407
contains more pebbles, less bedding, and below its center it connects to the upper part of 408
a feeder dike that cross-cuts Ps2a. We interpret L2 as a surficial sand blow deposit, 409
which provides additional evidence that the top of Ps2a is an event horizon (T2E2). 410
Liquefaction deposit L1 is a sub-vertical dike that terminates upward in Ps1b and cross-411
cuts L2, which is also faulted (at a horizontal distance of 6.5 m on the east wall). There is 412
no evidence that this dike reached the surface, so it cannot be tied to a particular event 413
horizon; however, it clearly occurred subsequent to T2E2 because of cross-cutting 414
relations. We attribute the liquefaction deposit L1 and the faults that offset liquefaction 415
deposit L2 to either of the younger events T2E0 or T2E1. 416
To constrain the age of the three event horizons in trench T2, seven samples were 417
radiocarbon-dated; details of the radiocarbon data and the units from which they were 418
sampled are presented in Table 2. Samples 40 and 47 are clearly reworked as they are 419
substantially older than the other sample ages, which suggests that paleosol Ps1b 420
comprises a significant component of reworked soils. Samples 41 and 42 (both from 421
paleosol PS1a) are the highest in the strata and provide the maximum age of both events 422
T2E0 and T2E1. Both samples 41 and 42 have similar 2σ calibrated age ranges of ~ A.D. 423
1660 to present, indicating that the two most recent earthquakes (T2E0 and T2E1) 424
occurred after sometime between A.D. ~1660 and the present (i.e. 1950). The minimum 425
age of event T2E2 is constrained by sample 50, and the maximum age by samples 43 and 426
49, which are very similar. Therefore, event T2E2 occurred sometime between A.D. 200 427
and A.D. 1640. 428
4.3. Paleoseismic Trench 3
429
Unlike paleoseismic trenches T1 and T2, paleoseismic trench T3 was excavated to about 430
5 m depth and did not encounter groundwater. The trench revealed an interfingering 431
sequence of stratigraphic units comprising of: gravel (Gn, Rg, Rgn, UG, or Ga,), gravel 432
wedges (Gnx), sand layers (Sn), organic rich soils (Psn) and fine-grained deposits (i.e. 433
various mixtures of silt and clay) (Fnx). We interpret that these stratigraphic units were 434
deposited in a similar environment as found at the site today which is a small inter-435
alluvial-fan wet-land at the base of a fault scarp. During the period of deposition the 436
trench location may have evolved subtly; in particular the wetness of the site due to 437
climate, and/or tectonic and anthropogenic influences on drainage paths. Trench 3 was 438
oriented perpendicular to the strike of the fault A (Fig. 2) at the base of a steep (~30°) 439
south-facing slope (the southern side of the elongate linear ridge) composed of Pliocene 440
clastic deposits (Kocyigit 1990) that we describe as a poorly sorted gravel with silt to 441
boulder-sized clasts. The strategy for trenching at this location was to find evidence of 442
multiple fault ruptures (reflecting paleoearthquakes) in an area with regular and relatively 443
continuous sedimentation. This location also had the advantage that different sediments 444
are present on either side of the fault, gravels to the north and inter-alluvial-fan wetland 445
sediments (organics and distal fan deposits) on the south side of the fault; this can assist 446
with the interpretation of the origin of strata in the fault zone. 447
Figure 7 is a log of Trench T3, Figure 8 is a photo mosaic overlain by the lines and 448
annotation from the trench log, and Table A.A-3 (Annex A) provides the stratigraphic 449
unit descriptions. The trench walls were benched with upper and lower walls separated 450
by an ~1 m wide bench (Fig. 7). The distance between the bases of the lower walls was 451
~3 m. 452
Fine-grained deposits
453
Fine-grained deposits are composed of silt and clay and are interpreted to be distal 454
alluvial fan deposits. We interpret that these deposits were laid down relatively slowly by 455
deposition of suspended load in flood waters sources from the low hills to the south of the 456
trench site. This interpretation is consistent with the northward tapering geometry of 457
these units where they interfinger with gravel wedges. The fine-grained soils may have 458
included organic rich layers but the decomposition of the organic component of such soils 459
has rendered them indistinguishable from the fine-grained deposits below approximately 460
1m below the ground surface. Organic rich soils in the top one meter of the trench are 461
interpreted to be paleosols formed at the present ground surface (i.e. ‗Topsoil‘ Fig. 7) or 462
at former, now buried, ground surfaces (i.e. ‗Ps1‘ and ‗Ps2‘ Fig. 7). 463
Sand Deposits
464
Distinctly continuous and recognizable (in the field) thin beds and laminae of sand (1 to 465
300mm thick) were logged on both walls of the trench and provide very useful marker 466
horizons in the strata. The sand layers are interbedded with the fine-grained and organic 467
rich strata in the south of the trench and also interfinger with gravel wedges towards the 468
northern end of the trench. Five sand layers were recognized on the west wall of the 469
trench (S1 – S5), which correlate to sand layers on the east wall with the exceptions of 470
the absence of sand layer S3 and the additional deeper sand layer S6 on the east wall. 471
The origin of the sand layers remains uncertain. They may have been deposited by flood 472
waters from the alluvial fans, by aeolian processes or perhaps they are associated with 473
liquefaction on the less distal parts of the alluvial fan. It is unlikely that all of the sand 474
layers are caused by liquefaction which we establish below because most of the sand 475
layers do not correspond with other evidence for paleoearthquakes. 476
The sand layers illustrate a clear increase in dip, down to the south, with depth. 477
Regardless of the process of deposition that formed the sand layers, if they had been 478
deposited on a slope with the angle near the base of the trench we would expect to see an 479
increased thickness away from the fault. Therefore, this dip must have formed after 480
burial as a consequence of tectonic deformation. The sand units are steeper near the fault, 481
but south of a horizontal distance of ~10 m the sand layers S1 and S2 are horizontal, 482
whereas S4, S5, and S6 dip at 4° to 7°. Unfortunatley, there are no horizons that we can 483
justifiably measure the angle of between S2 and S4, and therefore we can not use the 484
change in dip to identify event horizons. Nonetheless, the increasing dip of bedding with 485
depth indicates that significant syndepositional tectonic deformation has been occurring 486
while this sedimentary sequence has been deposited. It also indicates that there is a down 487
to the south displacement of the fault and this indicates that the gensis of the elongate 488
ridge described in Section 5 does include some recognizable component of dip-slip 489
displacement over time. 490
Gravel Deposits
491
Numerous gravel units have been described in this trench in accordance with their 492
properties and the interpretation of their origin. Stratigraphic descriptions are provided in 493
Table A.A-3 (Annex A). The gravel units have been partitioned into five groups as 494
follows: 495
1. River gravels (Rg and Rgn) 496
River gravels are interpreted to be much older than the other gravel units exposed 497
in the trench due to their intense deformation. We correlate this unit to Pliocene 498
continental clastics (Cobanli Group) which form the scarp to the north of the 499
trench (Koccyigit, 1990 pg.157). This unit may be equivalent to the structureless 500
gravel (Ga). 501
2. Undifferentiated gravels (UG) 502
This symbol is used for areas where no structure is recognizable due to 503
bioturbation but the material is interpreted to be equivalent to the ‗distinctive 504
gravel units (Gn)‘ and perhaps ‗gravel wedges (Wn and Wnx)‘. 505
3. Distinctive gravel units (Gn) 506
Particular distinctive gravel colluviums deposits sourced from the slope to the 507
north of the fault. Many of these units are probably equivalent to the ‗gravel 508
wedges (Wn and Wnx)‘ but due to the extensive faulting, which probably includes 509
significant (but unquantified) lateral displacement, and lateral variability in unit 510
thickness and composition, these are seldom correlated across the fault. Many of 511
the units represent undifferentiated combinations of differentiated units (e.g. unit 512
G2 is undifferentiated units G1 and G3). Gravel unit G13 is interpreted as a 513
fissure-infill based on its structure. 514
4. Structureless gravel (Ga) 515
This gravel has no coherent internal structure. It is possible that this unit is a very 516
large ‗gravel wedges (Wn and Wnx)‘ unit; however it is more likely that this is 517
equivalent to the ‗River gravels (Rg and Rgn)‘. 518
5. Gravel wedges (Wn and Wnx) 519
Gravel wedges are wedge shaped stratigraphic units that interfinger with the fine-520
grained, organic rich and sand deposits to the south. These wedges are composed 521
of a range of materials but mostly reworked ‗river gravels (Rg and Rgn)‘ and are 522
interpreted to be colluvial wedges. Each gravel wedge is given a sub number (n) 523
which are correlated to the equivalent unit on the opposite wall, where the 524
materials are different a further sub-number (x) is used to provide seperat 525
stratigraphic unit descriptions. 526
Tectonostratigraphy
Two tectonostratigraphic features are used to identify the location of event horizons; fault 528
terminations and colluvial wedges. Because of the difficulty of distinguishing the extent 529
of faults in gravel deposits (along with evidence of bioturbation) we have a low level of 530
confidence for the stratigraphic location of fault terminations in this trench. We have 531
only logged the location of faults where we were confident of their presence. In response 532
to this low level of confidence fault terminations are only used as corroborating evidence 533
for event horizons and we rely more heavily on colluvial wedges. 534
A colluvial wedge is a deposit formed on the downthrown side of a fault by collapse of a 535
fault scarp (free face) during or soon (i.e. years to tens of years) after an earthquake. The 536
base of a colluvial wedge can be interpreted an earthquake event horizon. We interpret 537
many of the ‗gravel wedges (Wn and Wnx)‘ to be colluvial wedges linked to ground 538
rupturing earthquakes. Arguably, these colluvial wedges could be formed by localized 539
failures of the steep slope to the north of the trench caused by non-seismic processes such 540
as extreme rainfall events. Because the south-facing steep slope comprises a loose gravel 541
deposit that has very little cohesion and negligible tensile strength, localized slope 542
failures are likely to be small (i.e. <2 m3) and therefore their associated deposits at the 543
base of the slope would not be laterally continuous. Colluvial wedges caused by surface 544
rupturing earthquakes are expected to be more laterally continuous. 545
Colluvial wedges could be formed by two processes related to fault rupture, fault scarp 546
retrogression (scarp collapse and subsequent erosion up the slope) and widespread slope 547
failures caused by seismic shaking (ground acceleration). Both of these processes could 548
mobilize a significant volume of gravel from the steep slope. We suspect that widespread 549
slope failure as a consequence of high ground accelerations are the cause of the gravel 550
wedges, because we do not see significant evidence of vertical displacement in the fault 551
zone (although this is not quantifiable in a single trench across a strike-slip fault). A 552
similar approach has been used to identify paleoearthquakes at two other locations on the 553
North Anatolian Fault (Fraser et al. 2009a & 2010b). To distinguish localized slope 554
failure deposits from colluvial wedges we considered opening two trenches on this 555
section of the scarp so that lateral continuity of gravel wedges could be assessed. 556
However, groundwater was encountered at less than 1 m depth in nearby test-pits so 557
trench T3 was made as wide as practical, with the upper walls ~5 m apart and lower walls 558
~3 m apart. South of the fault zone above gravel (Ga) we recognize seven distinct gravel 559
wedges, all of which are present on both walls of the trench. We interpret that gravel 560
wedge W1 is a consequence of constructing a road along the slope immediately north of 561
the trench (Fig. 2e). The remaining six gravel wedges are interpreted to be seismogenic 562
colluvial wedges. 563
The amount of horizontal offset cannot be constrained in this trench. The amount of 564
vertical offset is not discussed as it cannot be used as evidence for displacement rates 565
because of the unknown horizontal displacement and the potential range of orientations 566
of any particular stratum. 567
The evidence for six paleoearthquake events which we label T3E0 – T3E5 youngest to 568
oldest respectively are described below. The event horizons are shown and labeled in 569
Figures 6 and 7 and stratigraphic unit descriptions are provided in Table A.A-3 (Annex 570
A). 571
Paleoearthquake T3EO 572
Evidence for this event is a small colluvial wedge (gravel wedge W2) which is 573
much more clearly evident on the west wall than the east wall where gravel 574
wedges W1 and W2 were not differentiated. Corroborating evidence is provided 575
by two fault terminations at the base of gravel wedge W2 at a horizontal distance 576
of ~4m on the west wall. Supporting evidence for an event horizon at this 577
stratigraphic position is an offset of the base of the preceeding event horizon 578
(T3E1) at a horizontal distance of approximately 5m on the west wall. 579
Paleoearthquake T3E1 580
This event corresponds to the base of the colluvial wedge W3. A fault 581
termination at the base of of colluvial wedge W3 at a horizontal distance of 582
approximately 4.5 m on the west wall provides corroborating evidence for this 583
event horizon. On the east wall of the trench there is a lack of distinctive strata 584
immediately south of the fault zone making interpretation difficult. Because 585
gravel wedge W3 lies between sand S2 and gravel wedge W4a to the south of the 586
fault zone the event horizon is projected into the fault zone on the east wall along 587
the top of the distinctive unit W4a. This shows an additional fault termination at a 588
horizontal distance of ~5.75 on the east wall. 589
Paleoearthquake T3E2 590
Gravel wedge W4 is composed of three distinct units (W4a, W4b and W4c) and 591
collectively this wedge is larger than the younger wedges. On the west wall of the 592
trench this event horizon is corroborated by fault terminations at a horizontal 593
distance of 7m and if we assume that gravel unit G3 corresponds to gravel wedge 594
W4c there is a fault termination at a horizontal distance of ~2m that offsets the 595
event horizon. Since gravel unit G2 is undifferentiated gravel units G1 and G3, 596
fault terminations at its base at horizontal distances of ~3.75m and 4.75m on the 597
east wall may also be considered as corroborating evidence for this event horizon. 598
The termination at a horizontal distance of ~4.75m may pass through the event 599
horizon by several cm, this may reflect a small amount of slip associated with a 600
subsequent non surface rupturing event, or a lack of evidence for faulting due to 601
bioturbation above the event horizon, or postseismic slip. The fault termination at 602
a horizontal distance of ~3.75m on the east wall offsets the event horizon which 603
suggests that the offset occurred post deposition of the gravel above the event 604
horizon at this location (i.e. by a subsequent event). The apparent thrust 605
displacement is attributed to strike-slip displacement as the event horizon T3E3 606
below is not vertically offset. 607
Paleoearthquake T3E3 608
The gravel wedge W5 is interpreted to have formed as a result of this event and its 609
base is interpreted to be the event horizon T3E3. Gravel wedge W3 is composed 610
of two distinguishable units on the east wall (W5a and W5b) while only the lower 611
unit (W5b) is present on the west wall. The event horizon is also defined as the 612
contact between gravel units G7 and G9. At some locations these are 613
indistinguishable and are collectively labeled G8. For example, G8 is present 614
between horizontal distances ~3.25m and ~5.25m on the west wall of the trench 615
and in this area we cannot identify the event horizon. A fault terminates just 616
below the event horizon at a horizontal distance of ~6.25m on the east wall of the 617
trench, this may correspond to the event that formed gravel wedge W5 but it is not 618
definitive. There is relatively little corroborating evidence for this event horizon. 619
Paleoearthquake T3E4 620
This event horizon is defined as the base of gravel wedge W6 which has a similar 621
geometry on the trench wall to that of the gravel wedges up-sequence. No fault 622
terminations are recognized at this event horizon. The equivalent gravel units in 623
and north of the fault zone cannot be correlated to the gravel wedge W6. This is 624
attributed to lateral offset which is probably quite significant if there has four 625
subsequent, predominantly strike-slip, surface-rupturing earthquakes on this 626
segment. 627
Paleoearthquake T3E5 628
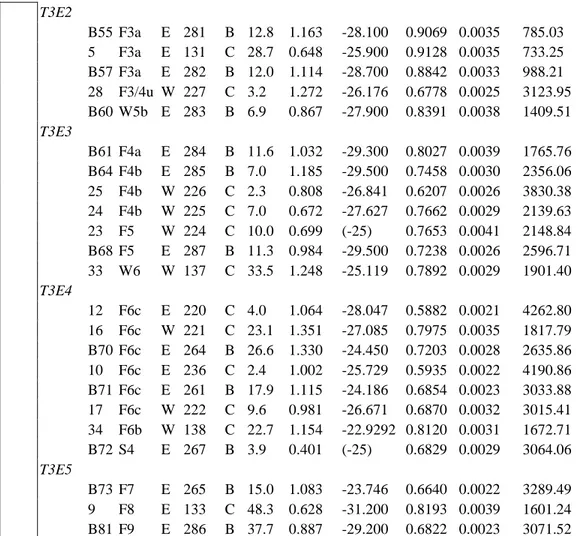
The evidence for this event is a colluvial wedge (gravel wedge W7) which is 629
notably smaller than many of the wedges in the up-sequence stratigraphy. There 630
is also no corroborating tectonostratigrapic evidence for this event horizon, just 631
the formation of a colluvial wedge. 632
Further validation of the evidence for the event horizons can be found by comparison of 633
the ages with the events identified in paleoseismic trenches T1 and T2 and the results 634
from other paleoseismic studies undertaken on nearby sections of the North Anatolian 635
Fault. 636
5. Paleoearthquake timing
637
To constrain the age of the event horizons established using colluvial wedges in trench 638
T3, we radiocarbon-dated 16 charcoal samples and 14 bulk samples (Table A.B-1, Annex 639
B). The bulk samples were processed to extract pollen, but at a late stage in the process 640
we found that there would not be enough pollen to date. Therefore, the dated materials 641
comprised 40-63 μm sized organics dominated by micro charcoal and pollen fragments 642
(see Annex B for a description of the processing procedure). As is common when many 643
samples are dated in a sedimentary sequence, many of the sample ages are inconsistent 644
with their relative stratigraphic positions (e.g. Hartleb et al., 2003; Fraser et al., 2009a; 645
Fraser et al., 2010b). It is difficult to distinguish between reliable and unreliable sample
646
ages. However, a parsimonious approach was taken, whereby the least samples were 647
excluded to establish a stratigraphically logical sequence of sample ages. Eight samples 648
are interpreted as too old relative to adjacent sample ages. This is attributed to reworking 649
of sample material from the southern face of the elongate linear ridge and alluvial fans 650
and their catchments. Four of the samples are interpreted as too young relative to the 651
adjacent sample ages, which is attributed to bioturbation although the fine-grained 652
deposits may also be prone to desiccation cracking, which would provide conduits for 653
organic material to be washed into the subsurface (i.e. creating an anomalously young age 654
in the stratigraphic unit in which it is deposited). 655
Using the remaining 18 samples, we made an order-constrained Bayesian model 656
(electronic supplement 1) using the software OxCal (Bronk Ramsey, 2007) to derive 657
modeled probability density functions (PDFs) of the sample and earthquake ages (Table 2 658
and Fig. 9). Where multiple samples from a stratigraphic unit are incorporated in the 659
Bayesian model, they are grouped into ―phases‖ (relative order unspecified), and these 660
phases were grouped into a sequence along with the individual samples from stratigraphic 661
units (i.e. not in a ‗phase‘) according to their stratigraphic order. The order-constrained 662
Bayesian model has a model index of 91 (Bronk Ramsey, 2007), which exceeds the 663
recommended 60 for a conformable model. 664
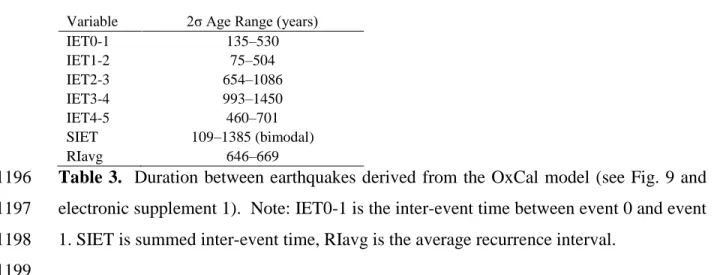
The order-constrained Bayesian model was also used to determine the PDFs of the inter-665
event time, the summed inter-event time, and the average recurrence interval (Table 3) 666
(i.e. using the same methodology as Fraser et al. 2010b and Lienkaemper and Bronk 667
Ramey 2009). The inter-event time is the period between two earthquakes expressed as a
668
PDF that accounts for the uncertainty in the timing of the earthquakes. The summed 669
inter-event time is the normalized sum of the inter-event times and provides a very good 670
description of the probable time between earthquakes, taking into account both the 671
natural variation in recurrence interval and the uncertainty associated with constraining 672
the age of earthquakes. The average recurrence interval is simply the period between the 673
youngest (T3E0: 1939 Erzincan earthquake) and the oldest event (as a PDF) divided by 674
the number of inter-event times, in this case 5. 675
The Bayesian model for trench T3 provides by far the best earthquake record of the three 676
trenches, although the data are complimentary to the findings of T1 and T2. Trench T1 677
informed us that one earthquake (T1E0) occurred after deposition of sample 37 (CRA: 678
A.D. 1494 – A.D. 1951 2σ), which is consistent with trenches T2 and T3. Trench T2 679
informed us that two earthquakes happened after ~ A.D. 1660 using only the highest two 680
samples below two event horizons (T2E0 and T2E1). This is consistent with trench T3 681
where we interpreted the ultimate event as the 1939 Erzincan earthquake (Table 2), and 682
the age of the penultimate event (T3E1) is constrained to between A.D. 1408 and A.D. 683
1804. The information from trench T2 strongly suggests that the penultimate event 684
(T2E1) occurred between ~ A.D. 1660 and A.D. 1804. The third event horizon identified 685
in trench T2 (T2E2) was constrained to sometime between A.D. 200 and A.D. 1640, 686
consistent with the event T3E2 (A.D. 1254 – A.D. 1391) from trench T3, but far less 687
precise. The good correlation between the three trenches provides some significant 688
validation to the link between formation of gravel wedges in trench T3 and other types of 689
evidence of paleoearthquakes revealed in trenches T1 and T2. Older paleoearthquakes 690
determined in trench T3 are summarized in Table 2. 691
Because event T3E0 corresponds to T2E0 and T1E0, and T3E1 corresponds to T2E1 and 692
so on, hereafter we label the events E0, E1, E2, et cetera. 693
6. Spatiotemporal Fault Rupture Correlation
694
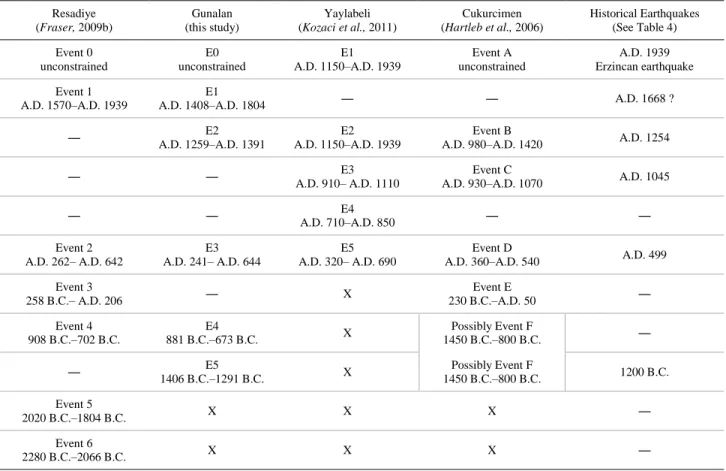
This discussion focuses on comparing the earthquake record established in this study 695
(Table 2) to paleoearthquake chronologies from four other paleoseismic investigations on 696
the 1939 Erzincan earthquake rupture segment (Hartleb et al., 2006, Fraser, 2009b and 697
Kozaci et al., 2011) and with to the record historical earthquakes (Table 1). Table 4
698
summarizes correlations which are presented graphically in Figure 10. 699
Gunalan is located near the western end of the Mihar-Tumekar fault segment (Barka, 700
1996, Fig. 1), Resadiye (Fraser, 2009b) is located on the Kelkit Valley fault segment 701
~130 km west of Gunalan, and Yaylabeli (Kozaci et al., 2011) and Cukurcimen (Hartleb 702
et al., 2006) which are located near the eastern end of the Mihar-Tumekar fault segment
703
are 27 km and 31 km east of Gunalan, respectively. 704
To use paleoearthquake timing data to investigate if previous earthquakes have had the 705
same extent of fault rupture as the 1939 Erzincan Earthquake two assumptions are made: 706
1. Where paleoearthquakes are dated to around the same time at multiple locations 707
on the fault rupture segment they reflect a single earthquake. However, this 708
assumption may erroneously group surface rupturing earthquakes that occur 709
closely spaced in time (relative to the age constraint determined in paleoseismic 710
investigations). 711
2. Where paleoearthquakes are not present in the stratigraphy at one location, but 712
they are at others, then only part of the fault rupture segment ruptured. This 713
assumption may be erroneous where paleoseismic investigation provides an 714
incomplete paleoearthquake record; this is very difficult to prove or disprove. 715
716
All of the studies on the 1939 rupture segment recognize evidence of the 1939 Erzincan 717
earthquake (Fraser, 2009b; Hartleb et al., 2006; Kozaci et al., 2011) which is consistent 718
with the extent of the fault rupture segment described by Barka (1996). In this study, the 719
1939 earthquake is interpreted to be E0 but due to the imprecision of radiocarbon dating 720
in the last few hundred years this remains an assumption. 721
In trench T3, event E1 was constrained to A.D. 1408 – .A.D 1804, which corresponds to 722
the timing of 10 possible historical earthquakes (Table 1). However, Trench T2 indicates 723
that this event occurred after ~A.D. 1660, reducing the possible correlative events to 724
earthquakes in A.D. 1668, 1684, and 1754 (Table 1). This event is interpreted to 725
correlate to one of the three major earthquakes that were reported in A.D. 1668 726
(Ambraseys and Finkel, 1995; Ambraseys and Jackson, 1998; Sengor et al., 2005). This 727
earthquake was also recognized at Resadiye (Fraser, 2009b), but not in the trenches to 728
the east of this study (Hartleb et al., 2006; Kozaci et al., 2011). This suggests that the 729
Mihar-Tumekar fault segment (Fig. 1c) identified by Barka (1996) does not always 730
rupture in unison (i.e. it may comprise of more than one fault segment). Although the 731
evidence of offset associated with the .A.D 1668 event at Gunalan may be interpreted as 732
spillover displacement from the Ortakoy-Susehri segment that terminates about 10 km 733
west of Gunalan (i.e. Gunalan is near a slip patch transition (Sieh, 1996)). 734
Event E2 was constrained to the period A.D. 1259 – A.D. 1391 using the data from 735
trench T3 (the results from trench T2 provide a poorer temporal constraint), which may 736
correlate to one of three historical earthquakes that occurred in A.D. 1254, 1287, and 737
1374 (Table 1). Notably, the A.D. 1254 earthquake occurred just outside the 2σ age 738
range for E2 established in this study. However, because the A.D. 1254 event was also 739
recognized at Yaylabeli (Kozaci et al., 2011) and Cukurcimen (Hartleb et al., 2006) and 740
was reported widely along the 1939 rupture segment in historical records (Ambraseys and 741
Jackson, 1998; Guidoboni and Comastri, 2005), we interpret that E2 corresponds to this
742
earthquake. The A.D. 1254 earthquake was not recognized at Resadiye (Fraser, 2009b), 743
which suggests that this earthquake ruptured an eastern portion of the 1939 Erzincan 744
earthquake rupture segment with its western termination located somewhere between 745
Resadiye and Gunalan. 746
Event E3 was constrained to A.D. 241 – A.D. 644 in trench T3, which correlates with 747
timing of three historical earthquake records: (1) vague reports of an earthquake in the 748
3rd, 5th and 7th centurys A.D. from Amasya, Niksar and Nicopolis (Ambraseys, 1970); (2) 749
an earthquake was reported in A.D. 499 in Niksar and Nicopolis (Ambraseys and 750
Jackson, 1998; Guidoboni and Comastri, 2005); (3) an earthquake that reportedly
751
destroyed Niksar in A.D. 343 (Guidoboni et al., 2005). Historical earthquake (1) does 752