Validating the use of an ultra-performance liquid chromatography with
tandem mass spectrometry method to quantify equol in cow's milk
Frédéric Daems1; Christophe Jasselette1; Jean-Michel Romnee1; Viviane Planchon2; Georges Lognay3; Éric Froidmont4
1
Valorisation of Agricultural Products Department, Walloon Agricultural Research Center, Chaussée de Namur 24, 5030 Gembloux, Belgium
2Agricultural and Natural Environment Department, Walloon Agricultural Research Center, Rue de Liroux 9,
5030 Gembloux, Belgium
3
Laboratory of Analytical Chemistry, Analysis, Quality and Risk Department, Gembloux Agro-Bio Tech, University of Liege, Passage des Déportés 2, 5030 Gembloux, Belgium
4Products and Sectors Department, Walloon Agricultural Research Center, Rue de Liroux 8, 5030 Gembloux,
Belgium
Abstract
Cow's milk can be used as a potential source of equol in the human diet. In order to study human intake, however, it is necessary to develop a reliable and sensitive analytical method. This paper reports on the validation of an analytical method using ultra-performance liquid chromatography coupled with a tandem mass spectrometry detector to quantify the equol in commercial milks (raw, whole, semi-skimmed, and skimmed milk). The equol was initially released using enzymatic hydrolysis, and it was then extracted using a double liquid/liquid extraction. The analytical method produced a linear calibration curve with a high correlation coefficient (R2≥0.996) between 5 and 1,000 ng.mL-1. Good intra- and inter-day precision (≤5.3% and≤5.2%, respectively) and accuracy (≤8.6%) were achieved. The recovery rate differed slightly among the different types of milk, ranging between 60.6± 1.09% and 82.3±5.21%. Good method repeatability was observed (≤15%). There was neither matrix effect nor carry-over effect, and the sample extracts were stable for at least 7 days of storage at -21 °C and 5 °C. The method proved to be specific, sensitive, precise, and accurate and was used for the first time to quantify the equol content in Belgian commercial cow's milk. In all the samples analyzed, equol was present at a concentration ≥10 ng.mL-1 and had a significantly higher content in organic than in conventional milk. The study also found that the mean concentrations of equol were similar for each type of commercial conventional cow's milk.
Keywords : Ultra-performance liquid chromatography (UPLC®); Tandem mass spectrometry (MS/MS); Equol; Milk; Validation
1 Introduction
Equol is a microbial metabolite of daidzein and formononetin, two phytoestrogens present in plants (mainly the Leguminosae family), and is produced by specific bacteria that are present in the digestive system of animals and humans (Jackson et al. 2011; Setchell and Clerici 2010a, b). Equol has a strong antioxidant activity (Setchell and Clerici 2010a, b) and could be used as a therapeutic agent against several diseases or cancers (Jackson et al. 2011; Setchell and Clerici 2010a, b). In the human population, however, not everyone would be able to benefit from its positive effects because of the lack of the specific microbial populations (Jackson et al. 2011; Setchell and Clerici 2010a, b). An alternative strategy for making equol's health benefits available to everyone would be the supply of this molecule in the human diet via food of animal origin. From the range of foods commonly consumed by humans, milk from dairy cows is an interesting potential source of equol (Tsen et al. 2014; Křižová et al. 2011). In recent years, many studies have been conducted on how to assess equol in milk and on feeding strategies for increasing the content of this molecule in milk (Adler et al. 2014; Kalač 2013; Höjer et al. 2012; Andersen et al. 2009; Mustonen et al. 2009; Steinshamn et al. 2008).
With the growing interest in phytoestrogens and their metabolites, many analytical methods have been developed and reviewed in the literature (Stalikas 2007; Grynkiewicz et al. 2005; Wu et al. 2004). In ruminants, conjugated equol is the predominant form of equol found in biological fluids (Mostrom and Evans 2012; Setchell and Clerici 2010a, b). A hydrolysis step is therefore required to estimate the overall quantity of equol excreted in milk. The chromatographic technique most frequently used to analyze phytoestrogens and their microbial metabolites in milk samples is liquid chromatography (LC) coupled with a mass spectrometry (MS) detector (Adler et al. 2014; Höjer et al. 2012; Andersen et al. 2009; Steinshamn et al. 2008; Antignac et al. 2004). LC is often used because sample preparation is easy and the method can be useful in analyzing more complex forms of phytoestrogens (e.g., with sugar, malonyl, or sulfate fragments) (Wu et al. 2004). In recent years, ultra-performance liquid chromatography (UPLC®) has become widely used in this type of analysis (Wielogôrska et al. 2015; Krajcovâ et
al. 2010). This special variant of high-performance liquid chromatography (HPLC) uses a smaller column particle size and can work at much higher pressure than HPLC. In addition, the injection volume is smaller in UPLC than in HPLC (Gumustas et al. 2013; Churchwell et al. 2005). These differences improve the speed of analysis as well as the resolution of LC analysis. For equol detection, MS detection techniques are the most widely used because they are very sensitive and can detect very low analyte content in biological fluids (Setchell and Clerici 2010a, b). LC-MS is now a fast-moving field, with many new detection and chromatographic techniques being developed over the past decade aimed at achieving higher sensitivity and reducing analysis time (Gumustas et al. 2013; Prokudina et al. 2012; Wu et al. 2004). Currently UPLC®-MS/MS analysis appears to be the fastest method; it is easiest to implement and produces reliable results.
The aim of this study was to validate a reliable, fast, and easy-to-use analytical method based on UPLC®-MS/MS for the routine quantification of equol in cow's milk. Once validated, this new method was used for the first time to estimate the equol content in a small number of samples of Belgian commercial cow's milk.
2 Material and methods
2.1 Chemicals and reagents
Equol (≥99.0% purity) and β-glucuronidase type H2 from Helix pomatia (EC Number: 3.2.1.31, glucuronidase activity, ≥85,000 units per mL and sulfatase activity, ≥7,500 units per mL) were purchased from Sigma-Aldrich (Diegem, Belgium). The internal standard (IS) daidzein-d4 (98.9% purity) was purchased from C/D/N
ISOTOPES (Pointe-Claire, Canada). Methanol (LC-MS reagent) and acetonitrile (LC-MS reagent) came from J.T. Baker (Deventer, The Netherlands); n-hexane (HPLC, 99%) from CARLO ERBA reagents (Val de Reuil, France); and ethyl acetate (HPLC, 99.9%) from Biosolve (Valkenswaard, The Netherlands). Formic acid (ULC-MS, 99%) was purchased from Biosolve. The dilution of organic solvents and enzymatic solutions was carried out with deionized water prepared using a Milli-Q® system (Millipore, Overijse, Belgium).
2.2 Calibration standard solutions
Separate primary stock standard solutions of equol and IS were prepared in methanol at a concentration of 100 µg.mL-1. These standard solutions were mixed in the appropriate proportions and serially diluted with deionized water and methanol in order to obtain standard solutions in methanol/H2O (80:20, v/v). Calibration standards, ranging from 5 to 1,000 ng.mL-1 for equol with 100 ng.mL-1 of IS, were prepared daily for each level. This calibration range in the UPLC®-MS/MS system corresponds with an equol concentration ranging from 1.25 to 250 ng.mL-1 in milk samples. It was chosen in order to take account of the expected levels reported in several studies (Kalač 2011) and dilutions obtained during sample preparation. All the standard solutions were stored at -18 °C and protected from light.
2.3 Sampling and storage
In order to apply the proposed method and obtain an initial estimation of equol concentration in Belgian cow's milk, 44 samples (15 whole [fat content 'fat', ≥3.5%], 24 semi-skimmed [fat, 1.5-1.8%] and five skimmed [fat, ≤0.5%]) of various brands were collected from several supermarkets in the country (February 2013). Among these samples, six came from the organic production sector. All samples were ultra-high temperature (UHT) processed, except four of them: three were sterilized and the last one pasteurized and micro-filtered. In addition, five raw milk samples [fat, ≥3.5%] were collected from three Walloon farms, three of them from two
conventional farms (farms x and y) and the other two from an experimental farm (farm z). All the milk samples were put in 50-mL Falcon® tubes stored at -18 °C and protected from light for up to 2 months. They were then analyzed in triplicate.
2.4 Sample preparation
Sample preparation followed the protocol described by Andersen et al. (2009), with some modifications. Each sample was thawed overnight at 4-6 °C, equilibrated to ambient temperature, and homogenized with a Vortex mixer. An aliquot of 2 mL, 0.1 mL of IS (500 ng.mL-1), and 0.1 mL of β-glucuronidase (glucuronidase activity,
≥42,000 units per mL) was put into a centrifuge tube (15 mL). The mixture was then vortexed, placed in an oven
at 37±1 °C, and shaken continuously for 2 h. After hydrolysis, the mixture was cooled in an ice bath for 15 min. It was then centrifuged using an Eppendorf® 5810 centrifuge (Eppendorf, Hamburg, Germany) at 3,220xg for 15 min. The creamy layer and the precipitate were discarded, and the liquid phase was recovered and submitted to solvent extraction using n-hexane (3x3 mL), followed by ethyl acetate (3x3 mL). In the first extraction, the hexane removed the fat still present in the sample; in the second, the ethyl acetate enabled the compounds of interest to be recovered. Centrifugation (4 min at 3,220xg) was performed between each extraction. The ethyl acetate extract was then evaporated under vacuum with a Büchi Syncore® Polyvap (BÜCHI Labortechnik AG, Flawil, Switzerland) at 50 °C. The residue was reconstituted in 0.5 mL of methanol: H2O (80:20, v/v) by
vortexing for 1 min, filtered through an UptidiscTM CA 13 mm/0.2 µm (Interchim, Montluçon, France) and analyzed using UPLC®-MS/MS.
2.5 Chromatographic conditions
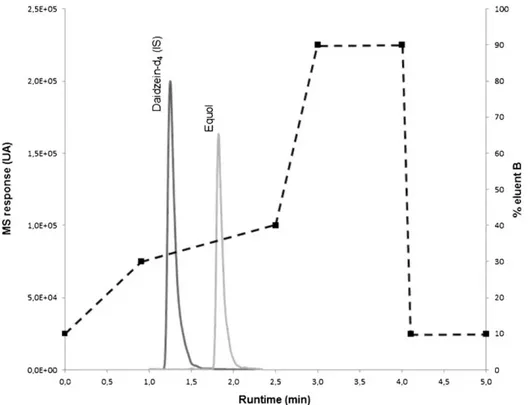
The LC analyses were performed on an ACQUITY UPLC® from Waters (Zellik, Belgium) equipped with a Waters ACQUITY UPLC® HSS T3 column (2.1x 100 mm, 1.8 µm particle size). The column was kept at 40 °C. The vials with samples and standard solutions were stored in an autosampler at 4 °C, and an aliquot of 10 µL was injected using the full loop injection mode. The mobile phase consisted of a water/ acetonitrile mixture (95/5, v/v) containing 0.01% formic acid (eluent A) and acetonitrile/water (95/5, v/v), as well as 0.01% formic acid (eluent B), with the following gradient profile—90% A/10% B (start), 90% A to 70% A (0.0-1.0 min), 70% Ato 60% A (1.0-2.5 min), 60% Ato 10% A (2.5-3.0 min), 10% A (3.0-4.0 min), and 10% A to 90% A (4.0-4.1 min). The column was then left to re-equilibrate under the initial conditions for 0.9 min, resulting in a total runtime of 5 min. The flow rate was set at 0.6 mL.min-1. In order to avoid subsequent contamination, the needle was washed between each injection with 200 µL of eluent B and 600 µL of eluent A.
2.6 MS/MS conditions
The eluting compounds were detected using a Quattro Premier XE (Micromass Waters, Zellik, Belgium) with an electrospray ionization (ESI) interface. The ESI source was operated in positive ionization mode, and the quantification was performed in multiple-reaction monitoring (MRM). A split was placed at the entrance of the device (split ratio 1/3) to give a mobile phase flow rate of 200 µL.min-1 inside the mass spectrometer. The ESI source used a standard 125 µm capillary. The optimal source and desolvation temperatures were 140 °C and 350 °C, respectively. Cone gas and desolvation gas flow (both N2) were set at 50 L.h-1 and 700 L.h-1, respectively. Argon was used for the collision-induced fragmentation. The optimized capillary and cone voltages were 1.5 kV and 35 V for equol and 1.5 kV and 25 V for IS. As the MRM mode was used, two precursor-product ion transitions were selected: 259>138 (collision energy 'Col. En.', 27 eV) and 259>203 (Col. En., 25 eV) for equol; and 243>133 (Col. En., 13 eV) and 243 > 123 (Col. En., 15 eV) for IS. The first transition was used for
quantification (Q) and the second for confirmation (q). All the data were collected and processed using MassLynx® software with a QuanLynx® program (Micromass Waters, Zellik, Belgium).
2.7 Method validation
The UPLC®-MS/MS method used for equol quantification was validated by investigating the following
parameters: specificity, linearity range, analytical limits of detection (LOD) and quantification (LOQ), accuracy, precision, carry-over, process efficiency, method repeatability, and sample extract stability. The calibration curve was based on the ratio between the peak areas of equol and IS (Aa/Ais) versus the equol concentration
(nanograms per milliliter of injected solution). The robustness of the hydrolysis method was also assessed by varying three factors - enzymatic solution concentration, hydrolysis time, and sample volume - and the best conditions were selected. These validation parameters were evaluated according to EMA (2011) guidelines.
2.8 Statistical analysis
All the analyses were performed at least in triplicate. Statistical analyses and graphics were performed with Microsoft® Excel software (Microsoft®, Diegem, Belgium) and the JMP® 7 statistical software package (SAS institute, Cary, US). Analysis of variance (ANOVA; α =0.05) and comparison of averages by Tukey's honestly significant difference (HSD) (α=0.05) tests were used to check different validation parameters and to compare the different milk types. A t-test (α=0.05) was also conducted to assess the matrix effect.
3 Results and discussion
3.1 Method development
In order to estimate the overall quantity of equol excreted in milk, a hydrolysis step is required. The equol molecule, however, is extremely acid-labile and can easily be destroyed if acidic hydrolytic procedures are used in sample preparation (Setchell and Clerici 2010a, b). For this reason, enzymatic hydrolysis with β-glucuronidase from H. pomatia was undertaken to measure the total amount of free equol in the samples.
The choice of enzyme was based on other studies (Adler et al. 2014; Andersen et al. 2009; Hoikkala et al. 2007; Antignac et al. 2004; Wu et al. 2004). The sample preparation procedure selected was based on the one reported by Andersen et al. (2009), with slight modifications in the hydrolysis conditions (see Section 3.2.5). The hydrolyzed sample was then centrifuged and extracted using n-hexane in order to carefully remove lipids from the milk (Stalikas 2007). Fat is one of the major causes of the matrix effect in LC-MS analysis (Jiang et al. 2012). The second solvent was then used to extract equol (Stalikas 2007).
the IS in a reasonably short time was used (Fig. 1). A small amount of formic acid was added to the mobile phases to facilitate the dissociation of equol in the solvent system, thus enhancing the chromatographic separation, resolution, and peak shape (Wu et al. 2004). The formic acid also significantly increased detection sensitivity by enhancing positive ion formation in the MS detector (Wu et al. 2004). The total runtime of the proposed UPLC®-MS/MS method is lower than the other methods described in literature, which range from 16 min (Krajčová et al. 2010) to several dozen minutes (Andersen et al. 2009; Hoikkala et al. 2007; Antignac et al. 2004).
Finally, the optimization of MRM conditions was achieved by infusing standard solutions of equol and IS (1 µg.mL-1) directly in the MS/MS. The two molecules were detected using a parent ion [M+H]+ and two characteristic daughter ions. After this, the cone voltage, collision energy, temperatures, gas flows, and other parameters were optimized by injecting the individual standard solutions with the mobile phase directly into the MS/MS. For each molecule, the two most abundant fragments were selected as Q candidates. The fragmentation pathways of these two molecules appeared to be similar to those reported by Antignac et al. (2003) and
Prokudina et al. (2012).
3.2 Method validation
As the method described by Andersen et al. (2009) had been slightly modified, and because the analytical device and the IS used in this study were not the same, it was mandatory to revalidate the whole procedure.
The occurrence of IS in the milk samples and enzymatic solution was checked, and no trace of IS was found nor was any trace of equol found in the enzymatic solution.
3.2.1 Specificity
Under the optimized UPLC®-MS/MS conditions, equol and IS were well separated on the chromatogram, and no interference in the integrate window was observed around the retention times (Fig. 1). The IS and equol retention times were 1.252±0.0070 and 1.823±0.0073 min (n=587), respectively. This implied that the relative retention times (RRT) between equol and IS were always included in an RRT tolerance range of ±2.5% (Antignac et al. 2003). In addition, for each compound, the ratio between the signals obtained for the confirmation transition and the one used for quantification (q/Q) was calculated, and it remained stable during the validation and routine analysis: 0.74 (relative standard deviation [RSD] of 6.9%) and 1.00 (RSD of 2.4%) for IS and equol (n=595), respectively. These RSD values were significantly lower than the tolerance ion ratio of 20% reported by Antignac et al. (2003).
3.2.2 Calibration curve
The calibration curve was constructed by injecting six replicates of each equol standard solution with IS (at 100 ng.mL-1) at concentration levels ranging from 5 to 1,000 ng.mL-1. In order to validate the calibration curve, several linearity criteria needed to be met: minimum of six concentration points per curve; RSD for each point not to exceed 20% for low points or 15% for high points (EMA 2011); and correlation coefficient (R2) to be more than 0.99 (Fiechter et al. 2013). The representative regression equation for the calibration curve was (Eq. 1):
y = 0.0066(±0.00012)x + 0.0077(±0.00335) (1)
where y was the analyte-to-IS ratio and x the equol concentration (n=6 and R2 ≥0.99). In addition, an ANOVA
with lack-of-fit test was used to confirm if the least squares linear regression model between the Aa/Ais ratio and concentration was adequate for describing the observed data (α=O.05) (De Bock et al. 2012). The ANOVA P value and the lack-of-fit test were <0.0001* and 0.5960, respectively. These results show that the use of linear calibration curves between 5 and 1,000 ng.mL-1 is satisfactory for quantifying the equol content of milk samples. It is the same order of magnitude as the range proposed by Krajčová et al. (2010).
In this study, the LOQ was arbitrarily set at the lower calibration level (5 ng.mL-1) because this limit value was judged satisfactory. The LOD was determined as the concentration at a signal-to-noise (S/N) of 3 (Fiechter et al. 2013). The S/N of equol was calculated in methanol/H2O (80:20, v/v) with a concentration close to the fixed lower calibration level (n=5), and it was estimated at 0.3 ng.ml-1. The LOD was not estimated in blank matrix because there was no milk without equol in the samples. The limits of the proposed method are substantially the same as those cited in other studies using an MS detector (Krajčová et al. 2010; Andersen et al. 2009; Antignac et al. 2004), but far lower than those obtained using ultra-violet detectors (Mustonen et al. 2009; Hoikkala et al. 2007).
Fig. 1 Optimized elution gradient (dotted line) and TIC of equol and daidzein-d4 (IS) set at 50 ng.mL-1 and 100 ng.mL-1, respectively
3.2.3 Instrumentation accuracy and precision
Intra-day (six injections within 1 day) and inter-day (six injections on 3 days) precision (expressed as RSD%) at four standard concentration points included in the calibration range (25, 50, 200, and 750 ng.mL-1) were determined. Accuracy (expressed as bias%) was also evaluated each day for the same standard concentrations. Standard solutions were prepared daily by different analysts. Table 1 summarizes the precision and accuracy of the UPLC®-MS/MS method. The intra- and inter-day RSD values did not exceed 5.3 and 5.2, respectively, nor did they exceed the maximum allowed value of 15% (EMA 2011; Ellis 2008). For accuracy, the maximum bias between the measured and assigned values was observed for the standard concentration at 200 ng.mL-1 during the second and third day of analysis. The two values (7.6% and 8.6%) were far lower than the allowed value of 15% (EMA 2011; Ellis 2008). These observations indicate that the UPLC®-MS/MS method used had an acceptable level of precision and accuracy.
3.2.4 Carry-over
Carry-over is one of the most commonly encountered problems in the quantification of metabolites in biological samples using LC-MS/MS (Prasain et al. 2010). In order to check this parameter, 10 µL methanol/H2O (80:20,
v/v) solution was injected after the injection of three high-standard concentration solutions containing the two
molecules (2,000 and 200 ng.mL-1 of equol and IS, respectively). No traces of equol or IS were found in the methanol/water solution.
3.2.5 Robustness of hydrolysis process
An evaluation of the robustness of the hydrolysis procedure was performed in three raw milk samples from an experimental farm. A one-variable-at-a-time technique was used to identify the conditions that provided the best hydrolysis efficiency.
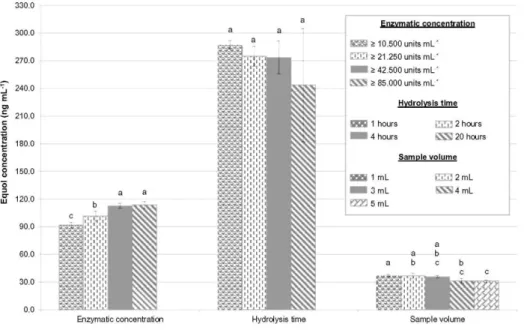
For the first experiment, four enzymatic concentrations between ≥85,000 and ≥10,600 units per mL of β-glucuronidase were tested in 4 mL of raw milk samples for 1 h. All the analyses were carried out four times. A Tukey's HSD test showed that there was a significant relationship between the enzymatic concentration and the amount of equol obtained (Fig. 2). A decrease in enzymatic concentration led to a decline in the equol content found at the end of the process. This indicated that, for low β-glucuronidase activities, enzymatic hydrolysis was incomplete in the milk samples. This statistical test also demonstrated that there was no significant difference between the undiluted and twice-diluted enzyme solutions, ≥85,000 and ≥42,500 units per mL. In the second
experiment, four hydrolysis times were tested in triplicate (between 1 and 20 h), with 4 mL of raw milk samples and an enzymatic concentration set at ≥42,500 units per mL-1. In this experiment, no significant effect was observed among the four hydrolysis times (Fig. 2). These observations are interesting because they show that it was possible to start the enzymatic hydrolysis on the eve or day of analysis, depending on the time available. In the third experiment, five sample volumes were tested in triplicate, from 1 to 5 mL, with an enzymatic
concentration of ≥42,500 units per mL-1 and for a period of 2 h. In this last experiment, it was shown that sample volume variations had a significant impact on the amount of equol obtained (Fig. 2). The concentrations found for the three sample volumes between 1 and 3 mL were not significantly different, but they were slightly higher than those found when 4 and 5 mL were used. The small difference (only 5 ng.mL-1) between these two volume ranges was enough to indicate a significant impact of volume samples. There was a more opaque and consistent hexane phase (first liquid/liquid extraction) for high-volume samples, making sample preparation a little more complicated than for low sample volumes. Therefore, with high sample volumes, this first extraction could result in the involuntary loss of equol in the upper fatty phase.
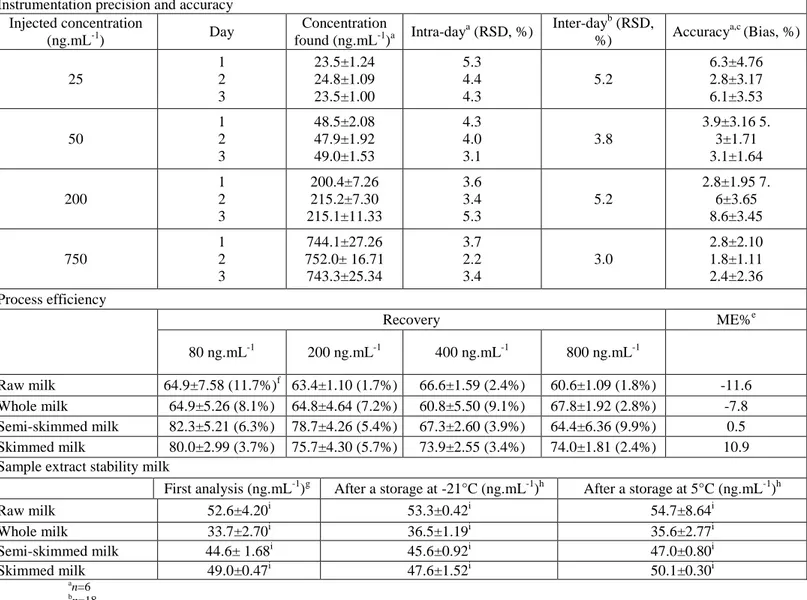
Table 1: Estimation of precision and accuracy of the UPLC®-MS/MS method, process efficiency, and
assessment of sample extract stability after a 7-day storage at 5±1 °C and -21± 1°C
Instrumentation precision and accuracy Injected concentration (ng.mL-1) Day Concentration found (ng.mL-1)a Intra-day a (RSD, %) Inter-dayb (RSD, %) Accuracy a,c (Bias, %) 25 1 2 3 23.5±1.24 24.8±1.09 23.5±1.00 5.3 4.4 4.3 5.2 6.3±4.76 2.8±3.17 6.1±3.53 50 1 2 3 48.5±2.08 47.9±1.92 49.0±1.53 4.3 4.0 3.1 3.8 3.9±3.16 5. 3±1.71 3.1±1.64 200 1 2 3 200.4±7.26 215.2±7.30 215.1±11.33 3.6 3.4 5.3 5.2 2.8±1.95 7. 6±3.65 8.6±3.45 750 1 2 3 744.1±27.26 752.0± 16.71 743.3±25.34 3.7 2.2 3.4 3.0 2.8±2.10 1.8±1.11 2.4±2.36 Process efficiency Recovery ME%e 80 ng.mL-1 200 ng.mL-1 400 ng.mL-1 800 ng.mL-1 Raw milk 64.9±7.58 (11.7%)f 63.4±1.10 (1.7%) 66.6±1.59 (2.4%) 60.6±1.09 (1.8%) -11.6 Whole milk 64.9±5.26 (8.1%) 64.8±4.64 (7.2%) 60.8±5.50 (9.1%) 67.8±1.92 (2.8%) -7.8 Semi-skimmed milk 82.3±5.21 (6.3%) 78.7±4.26 (5.4%) 67.3±2.60 (3.9%) 64.4±6.36 (9.9%) 0.5 Skimmed milk 80.0±2.99 (3.7%) 75.7±4.30 (5.7%) 73.9±2.55 (3.4%) 74.0±1.81 (2.4%) 10.9
Sample extract stability milk
First analysis (ng.mL-1)g After a storage at -21°C (ng.mL-1)h After a storage at 5°C (ng.mL-1)h
Raw milk 52.6±4.20i 53.3±0.42i 54.7±8.64i Whole milk 33.7±2.70i 36.5±1.19i 35.6±2.77i Semi-skimmed milk 44.6± 1.68i 45.6±0.92i 47.0±0.80i Skimmed milk 49.0±0.47i 47.6±1.52i 50.1±0.30i an=6 bn=18 c Bias%=Abs((Conc.
calc.-Conc.Nom)/Conc.Nom)*100 dRecovery(%)=(Conc.
Calc./Conc.th.)*100 eMatrixEffect(%)=((Slope
Matrix-SlopeMeOH)/SlopeMeoH)*100 fRSD% in brackets (n=4)
gn=4 hn=2
Fig. 2 Robustness evaluation of the enzymatic hydrolysis process (n≥3). Bars with the same letters (a, b, and c)
are not significantly different (P value>0.05)
After these three experiments, the hydrolysis conditions were fixed at 2 h of hydrolysis, with a sample volume of 2 mL and a concentration of ≥42,500 units per mL-1 β-glucuronidase type H2 from the H. pomatia solution. The reliability of the hydrolysis procedure was therefore enhanced for several reasons: with a 2 mL sample volume, fewer problems occur during skimming and hexane extraction; there is a significant financial saving with the double dilution of the enzymatic solution; and, with 2 h of hydrolysis time, the conjugated forms of equol appear to be thoroughly hydrolyzed after 2 h. The length of time taken by the hydrolysis process (with β-glucuronidase from H. pomatia) used in this study was far shorter than that reported by Krajčová et al. (2010), but it is
substantially the same as the times reported by Andersen et al. (2009), Hoikkala et al. (2007), and Antignac et al. (2004) in their studies of the equol content of milk.
3.2.6 Process efficiency
Process efficiency was evaluated by determining the extraction recovery and matrix effect for each type of milk (Kruve et al. 2008). The main difficulty was the absence of a true blank milk sample without equol. For these two validation parameters, a blank milk sample had to be prepared each time in order to estimate the equol content already in the sample.
Extraction recovery focusing on the efficiency of separating analyte from the samples was studied in the four types of milk at four concentration levels. The concentration found in milk samples spiked at the start of the sample preparation process was compared with the expected concentration. Each milk sample was spiked with 100 µL of standard solution at 400, 1,000, 2,000, and 4,000 ng.mL-1 in order to obtain a final equol concentration of 80, 200, 400, and 800 ng.mL-1. The analysis was carried out four times. As shown in Table 1, in all cases, the recovery rates ranged between 60 and 82%. This range straddled the lower limit value, fixed at 70% for this range of concentration (Ellis 2008; EMA 2011). The mean recovery rate was 69.4± 8.07%. These results accord with those reported by Andersen et al. (2009), but are lower than those reported in other studies (Mustonen et al. 2009; Hoikkala et al. 2007). In these latter studies, however, the recovery rate was not calculated with spiked samples of the target compound but with the IS used. When all the recovery rates were statistically analyzed, no difference was found between each concentration spiked, even when the two lowest concentrations appeared to produce better recovery rates for skimmed and semi-skimmed milk. There was a significant difference, however, between each type of milk (Pvalue<0.001*). The Tukey's HSD test showed that recovery was similar (about 64%) for raw and whole milk, but higher for the two other types of milk (about 74%). This increase appeared to be correlated with the milk fat content, indicating that fat removal with n-hexane extraction would reduce equol recovery rates. It is important to note that the RSD value for extraction recovery repeatability was 11.6% for all types of milk and concentration levels analyzed. This value was acceptable and derived mainly from the variability among the types of milk. During routine analysis, therefore, the correction factor calculation was carried out for each type of milk on each day of analysis (n=3, final concentration spiked, 200 ng.mL-1).
The matrix effect was used to describe equol and IS ionization efficiencies. Ion-enhancement or ion-suppression was observed occasionally when target analytes and matrix components co-eluted. It was also studied for each type of milk by comparing the slopes of the calibration curves obtained after adding appropriate calibration standard solutions in dry residues with the slopes arising from the same standard solutions in methanol/H2O (80:20, v/v). For this comparison, eight samples of the same milk were extracted, of which seven residue extracts were reconstituted with the appropriate seven standard calibration solutions, and one was reconstituted with meth-anol/H2O (80:20, v/v) (blank), with its response being subtracted from the other seven samples. The percentage difference between the slope of the calibration curve obtained by adding standard solutions in dry residues and the one arising from methanol/H2O (80:20, v/v), taking the latter as the reference, was less than 12% (in absolute terms) for all types of milk (Table 1). A slightly negative effect (signal suppression) was observed for the raw milk from farms and for the whole milk. For the other two types, however, the opposite effect was observed. For the semi-skimmed milk, the signal enhancement was very weak. These values were within a tolerance range (-20 and 20%) for which there was no matrix effect (Ferrer et al. 2011). In addition, a t-test (α=0.05) was used to compare each couple of slopes (external calibration in methanol/H2O (80:20, v/v) vs. standard addition in dry residues) and to establish if the slope differences were statistically significant (Salomone et al. 2011). For each couple of calibration curves, the statistical treatments were not significant, indicating that there was no significant matrix effect for any of the four types of milk. The preparation of matrix-matched standards could therefore be omitted, and quantification was carried out through external calibration curves in methanol/H2O (80:20, v/v).
3.2.7 Method repeatability
Intrinsic variability in a complete sample work-up (hydrolysis, extraction, and UPLC®-MS/MS analysis) was assessed throughout the validation process and sample analysis. During the estimation of recovery rates, robustness of hydrolysis protocol and sample analysis, at least three repetitions were conducted. Thus, the RSDs were derived for each situation and were always lower than the maximal tolerance limit fixed at 15% (Ellis 2008). The repeatability of all analytical methods was therefore judged to be completely satisfactory.
3.2.8 Sample stability
The stability of sample extracts was also investigated. Initially, four samples of each type of milk were prepared and analyzed. Then, for each type of milk, two samples were stored in a freezer (-21 ±1 °C) and the other two in a fridge (5±1 °C) for 7 days. After this period, sample extracts were analyzed a second time. As shown in Table 1, no significant difference was found with the Tukey's HSD test between the equol content found in the first analysis and after a 7-days storage in the fridge or freezer. There was therefore no equol degradation in the methanol sample extracts stored at -21 °C and 5 °C for at least 7 days.
3.3 Equol content of commercial milk in Belgium
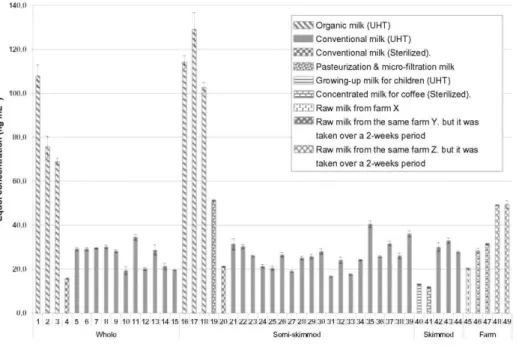
The validated method was then successfully used to determine the equol content in Belgian milk. In order to assign a correction factor to the results, a recovery rate was calculated daily. A higher number of semi-skimmed milk samples was taken into account because this type of milk is the one most heavily consumed by the Belgian population. As shown in Fig. 3, equol was present in all the milk samples. Within each type of milk, the equol content varied widely between samples. When comparing mean values, no significant difference was observed among the four types of milk (ANOVA Pvalue, 0.7256) randomly selected from the available milk types on the Belgian market in February 2013. The average values were estimated at 35.7± 12.05, 37.2±6.96, 38.1± 5.50, and 23.1 ±12.01 ng.mL-1 for raw, whole, semi-skimmed, and skimmed milk, respectively. These results accorded with those reported by other studies, which showed that there was no difference between skimmed and full cream milk samples (Antignac et al. 2004) and that there were lower concentrations in cream than in milk (Křižová et al. 2011). This means that equol is not a particularly lipophilic compound and therefore has little affinity with the lipid milk fraction. This interpretation goes against a recent study, however, where the authors reported that equol is distributed to a larger extent in the lipid fraction than in the aqueous fraction and therefore that the skimming process reduces the amount of equol in cow's milk (Tsen et al. 2014). More research is needed to clarify this situation, but this initial screening indicated that equol did not seem to be affected by the lipid fraction in milk.
There was a highly significant difference, however, between organic milk and the milk from the agricultural sector classed as 'conventional' (ANOVA Pvalue<0.0001). Equol concentration in organic milk varied from 70 to 130 ng.mL , whereas in conventional milk it varied from 10 to 50 ng.mL-1 . This difference between organic and conventional milk has also been reported from other countries (Hoikkala et al. 2007; Antignac et al. 2004). The equol concentration found in conventional milk in Belgium (10-50 µg.L-1) was higher than the mean value reported in the United Kingdom (about 10 µg.L-1) (Kunhle et al. 2008), equal to that reported in France (about 36 µg.L-1) (Antignac et al. 2004) and slightly lower than that reported in Finland (about 61 µg.L-1) (Hoikkala et al. 2007). The concentration found in organic Belgian milk (70-130 µg.L-1), however, was lower than the mean
values reported for France and Finland (about 191 and 411 µg.L-1, respectively) (Hoikkala et al. 2007; Antignac et al. 2004). This variability in equol content between countries could be linked partly to the use of different analytical methods. It could also be due to many other factors, such as sampling period, animal geographical origin, dairy cow species, or the type of feedstuff used (red clover content in the diet, for example). In this study, sampling was done during the second half of the winter period. The milk was therefore assumed to have been produced in late autumn or at the beginning of winter. The study was therefore limited to milk available for Belgian consumers at this period, and no more information on sample history or cow feeding regimes was available. One factor that might explain the striking difference between the equol content of organic and conventional milk samples could be the type of feed used in these two cattle management systems. Organic agricultural practices are supposed to use the high part of grass products to feed animals, often rich in
Leguminosae species that are a great source of equol precursors, especially red clover (Höjer et al. 2012; Křižová et al. 2011). It was also found that milk from different farms had significantly different equol concentrations (ANOVA Pvalue, 0.0075), whereas the concentrations in milk from the same farm remained stable over the 2-week period. This accords with the finding reported in an Australian study where, for a fixed period, equol concentration varied solely according to milk geographical origin (King et al. 1998). There also appeared to be no difference in equol concentration between UHT and sterilized milk. This observation is in line with other studies where no degradation in isoflavones with an increase in temperature during milk processing was observed (Křižová et al. 2011 ; King et al. 1998). In our study, however, not enough analysis was done on sterilized milk to confirm this observation statistically. The only sample of pasteurized milk analyzed seems to have had more equol content than UHT milk, but, as previously noted, not enough analysis was done during this first screening. Finally, analyses of milk for growing children and concentrated milk for coffee were also done. Equol was found in both these types of milk samples (13.2±0.16 and 11.8±0.19, respectively) but at lower concentrations than in other samples.
Fig. 3 Equol content found in Belgian commercial cow's milk and raw milk analyzed by UPLC®-MS/MS.
"UHT" is the abbreviation of ultra-heat treatment. Each sample was analyzed in triplicate (n=3), and the standard
deviation is represented by the error bars
4 Conclusions
This paper describes the validation of a reliable, fast, and sensitive UPLC®-MS/MS method for quantifying equol concentration, over a range of 5-1,000 ng.mL-1, in raw and processed milk sold in supermarkets. A major advantage of this analytical method is the short sample analysis runtime required, which is important for high sample throughput. The extraction procedure is easy to perform and suitable for routine work. The application of this validated method gave an initial indication of the equol content in commercial cow's milk in Belgium. Equol was found in all the samples analyzed, with a concentration ranging from 10 to 50 ng.mL-1 for conventional milk and from 70 to 130 ng.mL-1 for organic milk. The results obtained show the suitability of this method for analyzing estrogenic metabolite-equol in cow's milk and its potential for use in further investigations.
Acknowledgments The authors wish to thank the Public Service of Wallonia (PhytoHealth Project, Moerman
funds) for providing financial assistance during the course of this research.
Conflict of interest/Compliance with ethics requirement statements Frédéric Daems, Christophe Jasselette,
Jean-Michel Romnee, Viviane Planchon, Georges Lognay, and Eric Froidmont declare that they have no conflict of interest. This article does not contain any studies with human or animal subjects performed by any of the authors.
References
Adler SA, Purup S, Hansen-Møller J, Thuen E, Gustavson AM, Steinshamn H (2014) Phyto-oestrogens and their metabolites in milk produced on two pastures with different botanical compositions. Livest Sci 163: 62-68 Andersen C, Nielsen TS, Purup S, Kristensen T, Eriksen J, Søegaard K, Sorensen J, Fretté XC (2009) Phyto-oestrogens in herbage and milk from cows grazing white clover, red clover, lucerne or chicory-rich pastures. Animal 3(8): 1189-1195
Antignac JP, Cariou R, Le Bizec B, Cravedi JP, André F (2003) Identification of phytoestrogens in bovine milk using liquid chromatography/electrospray tandem mass spectrometry. Rapid Commun Mass Spectrom 17:1256-1264
Antignac JP, Cariou R, Le Bizec B, André F (2004) New data regarding phytoestrogens content in bovine milk. Food Chem 87:275-281
Churchwell MI, Twaddle NC, Meeker LR, Doerge DR (2005) Improving LC-MS sensitivity through increases in chromatographic performance: comparisons of UPLC-ES/MS/MS to HPLC-ES/MS/MS. J Chromatogr B 825:134-143
De Bock L, Boussery K, Colin P, De Smet J, T'Jollyn H, Van Bocxlaer J (2012) Development and validation of a fast and sensitive UPLC-MS/MS method for the quantification of six probe metabolites for the in vitro
determination of cytochrome P450 activity. Talanta 89:209-216
Ellis RL (2008) Development of veterinary drug residue controls by the Codex Alimentarius Commision: a review. Food Addit Contam 25(12):1432-1438
EMA (2011) VICH GL49: studies to evaluate the metabolism and residue kinetics of veterinary drugs in food-producing animals: validation of analytical methods used in residue depletion studies, UK. http://www. ema.europa.eu/docs/en_GB/document_library/Scientific_guideline/2011/04/WC500105053.pdf Accessed Feb 2013
Ferrer C, Lozano A, Agüera A, Jiménez Girón A, Fernández-Alba AR (2011) Overcoming matrix effects using the dilution approach in multiresidue methods for fruits and vegetables. J Chromatogr A 1218: 7634-7639 Fiechter G, Opacak I, Raba B, Mayer HK (2013) A new ultra-high pressure liquid chromatography method for the determination of total isoflavone aglycones after enzymatic hydrolysis: application to analyze isoflavone levels in soybean cultivars. Food Res Int 50:586-592
Grynkiewicz G, Ksycinska H, Ramza J, Zagrodzka J (2005) Chromatographic quantification of isoflavones (why and how). Acta Chromatogr 15:31-65
Gumustas M, Kurbanoglu S, Uslu B, Ozkan SA (2013) UPLC versus HPLC on drug analysis: advantageous, applications and their validation parameters. Chromatographia 76:1365-1427
Hoikkala A, Mustonen E, Saastamoinen I, Jokela T, Taponen J, Saloniemi H, Wähälä K (2007) High levels of equol in organic skimmed Finnish cow milk. Mol Nutr Food Res 51:782-786
Höjer A, Adler S, Purup S, Hansen-Møller J, Martinsson K, Steinshamn H, Gustavsson AM (2012) Effects of feeding dairy cows different legume-grass silages on milk phytoestrogen concentration. J Dairy Sci 95(5): 4526-4540
Jackson RL, Greiwe JS, Schwen RJ (2011) Emerging evidence of the health benefits of S-equol, an estrogen receptor β agonist. Nutr Rev 69(8):432-448
Jiang H, Cao H, Zhang Y, Fast DM (2012) Systematic evaluation of supported liquid extraction in reducing matrix effect and improving extraction efficiency in LC-MS/MS based bioanalysis for 10 model pharmaceutical compounds. J Chromatogr B 891-892:71-80
Kalač P (2011) The effects of silage feeding on some sensory and health attributes of cow's milk: a review. Food Chem 125:307-317
Kalač P (2013) Fresh and ensiled forages as a source of estrogenic equol in bovine milk: a review. Czech J Anim Sci 58(7):296-303
King RA, Mano MM, Head RJ (1998) Assessment of isoflavonoid concentrations in Australian bovine milk samples. J Dairy Res 65:479-489
Krajčová A, Schulzová V, Lojza J, Křížová L, Hajšlová J(2010) Phytoestrogens in bovine plasma and milk— LC-MS/MS analysis. Czech J Food Sci 28(4):264-274
Křižová L, Třináctý J, Hajslová J, Havlíková S (2011) Soybean—applications and technology, Tzi Bun Ng (Ed.), Croatia, Chapter 6, 95-110
Kruve K, Künnapas A, Herodes K, Leito I (2008) Matrix effects in pesticide multi-residue analysis by liquid chromatography-mass spectrometry. J Chromatogr A 1187(1-2): 5 8-66
Kunhle GG, Dell'Aquila C, Aspinall SM, Runswick SA, Mulligan AA, Bingham SA (2008) Phytoestrogens content of animal origin: dairy products, eggs, meat, fish, and seafood. J Agric Food Chem 56(21): 10099- 10104
Mostrom M, Evans TJ (2012) Veterinary toxicology—basic and clinical principles (2nd edn). Ramesh C. Gupta (ed), The Netherlands, Chapter 76, 1012-1028
Mustonen EA, Tuori M, Saastamoinen I, Taponen J, Wähälä K, Saloniemi H, Vanhatalo A (2009) Equol in milk of dairy cows is derived from forage legumes such as red clover. Brit J Nutr 102:1552-1556
Prasain JK, Arabshahi A, Moore DR II, Greendale GA, Wyss JM, Barnes S (2010) Simultaneous determination of 11 phytoestrogens in human serum using a 2 min liquid chromatography/tandem mass spectrometry method. J Chromatogr B 878:994-1002
Prokudina EA, Havliček L, Al-Maharik N, Lapčik O, Strnad M, Gruz J (2012) Rapid UPLC-ESI-MS/MS method for analysis of isoflavonoids and other phynylpropanoids. J Food Compos Anal 26:36-42
Salomone A, Gerace E, Brizio P, Gennaro MC, Vincenti M(2011)A fast liquid chromatography-tandem mass spectrometry method for determining benzodiazepines and analogues in urine. Validation and application to real cases of forensic interest. J Pharm Biomed 56:582-591
Setchell KDR, Clerici C (2010a) Equol: history, chemistry and formation. J Nutr 140:1355S-1362S Setchell KDR, Clerici C (2010b) Equol: pharmacokinetics and biological actions. J Nutr 140:1363S-1368S Stalikas CD (2007) Extraction, separation, and detection methods for phenolic acids and flavonoids. J Sep Sci 30:3268-3295
Steinshamn H, Purup S, Thuen E, Hansen-Møller J (2008) Effects of clover-grass silages and concentrate supplementation on the content of phytoestrogens in dairy cow milk. J Dairy Sci 91:2715-2725
Tsen SY, Siew J, Lau EKL, Roslee FAB, Chan HM, Loke WM (2014) Cow's milk as a dietary source of equol and phenolic antioxidants: differential distribution in the milk aqueous and lipid fractions. Dairy Sci Technol 94:625-632
Wielogórska E, Elliot CT, Danaher M, Chevallier O, Connolly L (2015) Validation of an ultra high performance liquid chromatography-tandem mass spectrometry method for detection and quantification of 19 endocrine disrupters in milk. Food Control 48:48-55
Wu Q, Wang M, Simon JE (2004) Analytical methods to determine phytoestrogenic compounds. J Chromatogr B 812:325-355