UNIVERSITÉ DE SHERBROOKE
Faculté de génie
Département de génie électrique et de génie informatique
ATTÉNUATION DES INTERACTIONS
ÉLECTROMAGNÉTIQUES ENTRE LE MODULE DE DÉTECTION
LABPET II ET L’IRM
MITIGATING ELECTROMAGNIC INTERACTIONS
BETWEEN LABPET II DETECTION MODULE AND MRI
SCANNERS
Thèse de doctorat Spécialité : génie électrique
Narjes MOGHADAM
Sherbrooke (Québec) Canada October 2019
ii JURY MEMBERS Réjean FONTAINE Supervisor Roger LECOMTE Co-supervisor Hamid Sabet External examiner Serge CHARLEBOIS Examiner Yves BÉRUBÉ-LAUZIÈRE Examiner
iii
Résumé
Les scanners TEP/IRM simultanés offrent une occassion unique d'examiner en même temps les propriétés anatomiques et fonctionnelles des tissus malins, tout en évitant l'incertitude des systèmes séquentiels de TEP/IRM. Cependant, le couplage électromagnétique entre les deux modalités constitue un défi important à relever. Ces interférences électromagnétiques entravent les performances du scanner et altèrent la qualité d'image de chaque modalité.
Bien que les métaux possèdent d'excellentes propriétés de blindage contre les fréquences radioélectriques, ils ne constituent pas nécessairement une option de blindage appropriée pour modifier les champs magnétiques induisant des courants de Foucault dans les couches métalliques. En conséquence, il existe une demande considérable pour un nouveau matériau de protection et une approche originale pour retirer les pièces métalliques du champ de vision IRM.
L’objectif de ce projet était d’initier les études en vue de la réalisation d’un scanner TEP/IRM simultané basé sur des modules de détection LabPET II hautement pixélisés afin d’obtenir une résolution spatiale millimétrique pour le cerveau humain et le chien. L'électronique LabPET II comprend des circuits intégrés à application spécifique dans lesquels le signal est numérisé à proximité de la photodiode à avalanche et offre un environnement moins sensible aux interférences électromagnétiques. Pour atteindre l'objectif principal, premièrement, l'effet du matériau métallique des modules de détection LabPET II sur les performances de la TEP et de l'IRM est examiné théoriquement. Les résultats confirment que les composants métalliques du module de détection LabPET II altèrent le champ magnétique, génèrent des courants de Foucault ce qui augmente leur température. Ensuite, les performances électroniques des modules de détection LabPET II sous l’influence de bobines d’IRM faites sur mesure sont examinées. La résolution en énergie et la résolution temporelle se détériorent en présence de bobines RF et de bobines à gradient en raison des perturbations électromagnétiques. Subséquemment, un module de détection LabPET II blindé par une fine couche de composite cuivre-argent est étudié, prouvant que le blindage contre les interférences électromagnétiques avec le composite rétablit les performances en TEP, fournissant moins d'induction par courants de Foucault. En outre, une nouvelle configuration de blindage basée sur un composite de couche flexible de nanotubes de carbone a été fabriquée pour limiter les interférences électromagnétiques. Les composites de nanotubes de carbone créent une couche hautement conductrice avec des chemins conducteurs minimaux, ce qui permet de réduire les courants de Foucault. Le principal résultat scientifique de ce projet est que le blindage composite empêche les interférences de basses et hautes fréquences et réduit l'induction de courants de Foucault, offrant ainsi la flexibilité nécessaire pour acquérir une séquence rapide de commutation de gradients. D'un point de vue technique, le module de détection LabPET II ainsi blindé présente une excellente performance dans un environnement de type IRM, ce qui permet de concevoir un insert TEP basé sur la technologie LabPET II.
iv
Mots-clés: Tomographie d'émission par positrons (TEP), imagerie par résonance magnétique (IRM), interférence électromagnetiquies, matériau composite à base de nanotubes de carbone (CNT), blindage électromagnétique, courants de Foucault
v
Abstract
Simultaneous PET/ MRI scanners provide a unique opportunity to investigate anatomical and functional properties of malignant tissues at the same time while avoiding the uncertainty of a sequential PET/MRI systems. However, electromagnetic coupling between the two modalities is a significant challenge that needs to be addressed. These electromagnetic interferences (EMI) hinder the performance of both scanners and distort the image quality of each modality.
Although metals have excellent radio-frequency shielding properties, they are not necessarily an appropriate shielding option for altering magnetic fields that induce eddy currents in any metallic layer. Thus, there is a considerable demand for a new shielding material and an original approach to remove metallic parts from the MRI field of view.
The objective of this project was to initiate the realization of a simultaneous PET/MRI scanner based on highly pixelated LabPET II detection modules to achieve millimeter spatial resolution for the human brain and dogs. The LabPET II electronics include application specific integrated circuits where the signal is digitized near the avalanche photodiode and offers an environment less susceptible to EMI. To fulfill the main aim, for the first time, the effect of the metallic material of LabPET II on PET and MRI performance was theoretically examined. Results confirm that metallic components of the LabPET II detection modules distort the magnetic field, generate eddy currents, and increase temperature. Then, the LabPET II electronics performance under the influence of custom-made MRI coils was investigated. Its energy and timing resolutions deteriorate in the presence of both RF and gradient signals because of EMIs. Thus, a LabPET II detection module shielded by a thin layer of the copper-silver composite was investigated, proving that shielding EMIs with the composite restores the PET performance, with less eddy current induction. Besides, a new shielding configuration based on a flexible layer of carbon nanotube (CNT) composite was fabricated to limit the EMIs. The CNT composite creates a highly conductive layer with minimal conductive paths that allows eddy currents to be decreased.
The primary scientific outcome of this project is that the novel composite shielding rejects both low and high-frequency interferences and reduces eddy current induction, offering the flexibility to acquire a fast gradient switching sequence. From a technical point of view, the shielded LabPET II detection module demonstrates an excellent performance in an MRI-like environment supporting the feasibility of designing a PET-insert based on LabPET II technology.
Keywords: Positron Emission Tomography (PET), Magnetic Resonance Imaging (MRI), Electromagnetic Interferences (EMI), Carbon Nanotube (CNT); Composite, Electromagnetic Shielding, Eddy Currents
vi
ACKNOWLEDGMENTS
The research presented in this dissertation is the result of a wide-ranging collaboration. I am thankful to many people; not only for their contributions to scientific knowledge but also for my personal benefit from the privilege of working alongside them. The mentorship and guidance of these colleagues have been the best material from which my graduate education has been advanced.
I would like to thank my advisor, Réjean Fontaine, and my co-advisor, Roger Lecomte, for their advice, patience, mentoring, and support. It was a real privilege and an honor for me to profit of their exceptional scientific knowledge but also their extraordinary human qualities.
This project was realized with the great help, advice, and support of many of my colleagues at Institut interdisciplinaire d'innovation technologique (3IT). I would especially like to acknowledge the Groupe de Recherche en Appareillage Médical de Sherbrooke (GRAMS) members at Université de Sherbrooke and Centre d'imagerie moléculaire de Sherbrooke (CIMS) members from the research center of the CHUS. I have learned a lot from you, and I will be forever grateful for it. Special thanks to Louis Arpin, Romain Espagnet, Jonathan Bouchard, Nicolas Viscogliosi, Caroline Paulin, Konin Koua, Haithem Bouziri, Catherine Pepin, Christian Thibaudeau, Jean-François Beaudoin, and Luc Tremblay. I also would like to express my gratitude to my colleagues at Le laboratoire de caractérisation et de synthèse des matériaux (LCSM) and Laboratoire Nanotechnologies et Nanosystèmes (LN2), especially to Mohamed Walid Hassen, René Labrecque, Artur Turala, and Pierre Langlois.
I acknowledge the financial support for my research study from the Quebec Bio-Imaging Network (QBIN) and the Fonds de recherche du Québec – Nature et technologies (FRQNT).
Finally, I am thankful to my parents, who have always encouraged and supported me and lighten my way through all the steps I have taken. Many thanks to my best friend, Reza, who has helped me to realize my dream and overcome all the challenging moments abroad.
vii TABLE OF CONTENTS
Chapter 1 INTRODUCTION ... 1
1.1. Context and Issues ... 1
1.2. Research Questions ... 3
1.3. Objectives and Hypotheses of the Project ... 4
1.4. Original Contributions and Thesis Layout ... 7
Chapter 2 LITERATURE REVIEW ... 10
2.1. Fundamental Concept of PET ... 11
2.1.1. PET Components ... 12
2.2. Overview of Magnetic Resonance Imaging ... 13
2.2.1. MRI Parts... 14
2.2.2. Physics of MRI ... 15
2.3. Integrated PET and MRI ... 16
2.4. Interaction between PET and MRI ... 20
2.4.1. Influence of PET on MRI ... 21
2.4.2. Influence of MRI on PET ... 23
2.5. PET/MRI Common Structure... 29
2.6. Shielding ... 30
2.6.1. Shielding Effectiveness ... 31
2.6.2. Shielding Materials for PET/MRI ... 32
2.7. Eddy Currents ... 40
2.8. Conventional Method to Measure the SE ... 41
2.9. Fabrication of CNT Composites ... 43
Chapter 3 METALLIC MATERIAL EFFECTS ... 49
Résumé en français ... 50
3.1. Introduction ... 53
3.2. Materials and Methods ... 55
3.2.1. LabPET II Detector ... 56
3.2.2. Field Inhomogeneity and Geometric Distortion Theory ... 58
3.2.3. Field Inhomogeneity ... 59
3.2.4. Geometric Distortion ... 60
3.3. Eddy Current and Heat Dissipation Simulation ... 60
3.3.1. Effects of Position ... 62
viii
3.4. Results ... 63
3.4.1. Field Inhomogeneity ... 63
3.4.2. Geometry Distortion Study ... 64
3.4.3. Eddy Current and Heat Dissipation Study... 66
3.4.4. Effect of Position ... 70
3.4.5. Experimental Results ... 70
3.5. Discussion ... 71
3.6. Conclusion ... 73
Chapter 4 EFFECTS OF MRI COILS ON LABPET II PERFORMANCE: EMI and shielding……… ... 75
Résumé en français ... 76
4.1. Introduction ... 79
4.2. Materials and Methods ... 82
4.2.1. LabPET II Building Blocks ... 82
4.2.2. LabPET II ASIC ... 84
4.2.3. Energy And Timing Resolution Measurement Set Up ... 85
4.2.4. Choice of Shielding Material... 86
4.2.5. Mutual RF Interferences between the LabPET II and the RF Coil .... 87
4.2.6. Mutual Interferences between the LabPET II and the Gradient Coil . 90 4.3. Results ... 91
4.3.1. Choice of Shielding Material... 91
4.3.2. Mutual RF Interferences between the LabPET II and the RF coil ... 92
4.3.3. Mutual Interferences between the LabPET II and the Gradient Coil . 99 4.4. Discussion ... 104
4.5. Conclusion ... 107
4.6. Supplementary Information ... 109
Chapter 5 INTERPOSER: PERFORMANCE AND MODIFICATION ... 112
Résumé en français ... 113
5.1. Introduction ... 114
5.2. Materials ... 117
5.3. Methods ... 118
5.3.1. RF Coil Effects on the Interposer Detector ... 119
5.3.2. Gradient Coil Effects on the Interposer Detector ... 120
5.3.3. Eliminating the Interferences ... 120
ix
5.4.1. RF Coil Effects on the Interposer Detector ... 121
5.4.2. Gradient Coil Effects on Interposer Detector ... 123
5.4.3. Eliminating Interferences ... 125
5.5 Discussion ... 127
5.6. Conclusion ... 128
5.7. Supplementary ... 129
Chapter 6 CNT-COMPOSITE SHIELDING ... 132
Résumé en français ... 133
6.1. Introduction ... 134
6.2. Materials and Methods ... 138
6.2.1. Materials ... 138
6.2.2. Synthesize Process of Nano-Composite ... 138
6.2.3. Nano-Composite Characterization ... 139
6.2.4. LabPET II Performance Measurement ... 140
6.3. Results and Discussion ... 141
6.3.1. Nano-Composite Characterization ... 142 6.3.2. LabPET II Performance ... 147 6.4. Conclusion ... 151 Chapter 7 Conclusion ... 154 7.1. Summary ... 154 7.2. Discussion ... 158 7.3. Contribution ... 161 7.4. Future work ... 164 7.5. French conclusion ... 166
Appendix A RF COIL DESIGN……… ... 172
Steps for Designing of Surface Coil ... 172
Appendix B GRADIENT COIL ... 175
Appendix C Eddy CURRENT MEASUREMENT ... 177
x LIST OF FIGURES
Figure 1-1. Comparison of different biomedical imaging techniques. ... 2 Figure 2-1. The positron-emission decay process of an unstable nucleus. ... 11 Figure 2-2. The non-collinearity effect on two scanners with different diameters. The blue ring represents a smaller scanner and the gray one symbolizes a scanner with a larger diameter. ... 12 Figure 2-3. The detection module (DM) of the LabPET II scanner. ... 13 Figure 2-4. A schematic of the main parts of an MRI. ... 14 Figure 2-5. Schematic of three different methods to combine PET/MRI, (a) sequential, (b) insert, and (c) fully integrated (Pichler et al., 2008a) ... 18
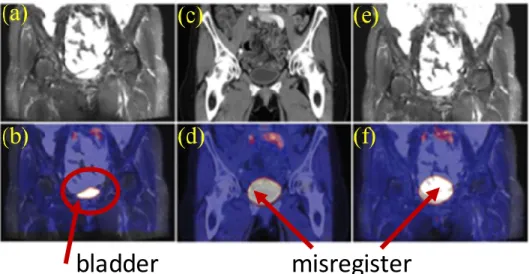
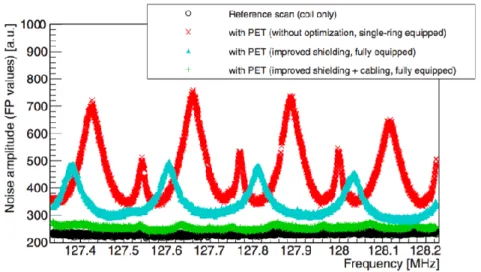
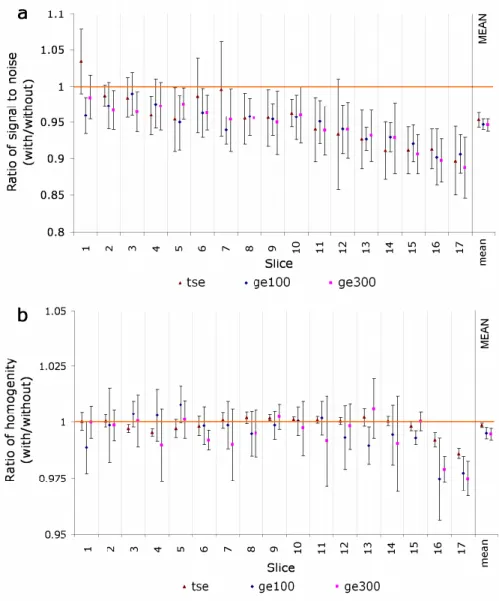
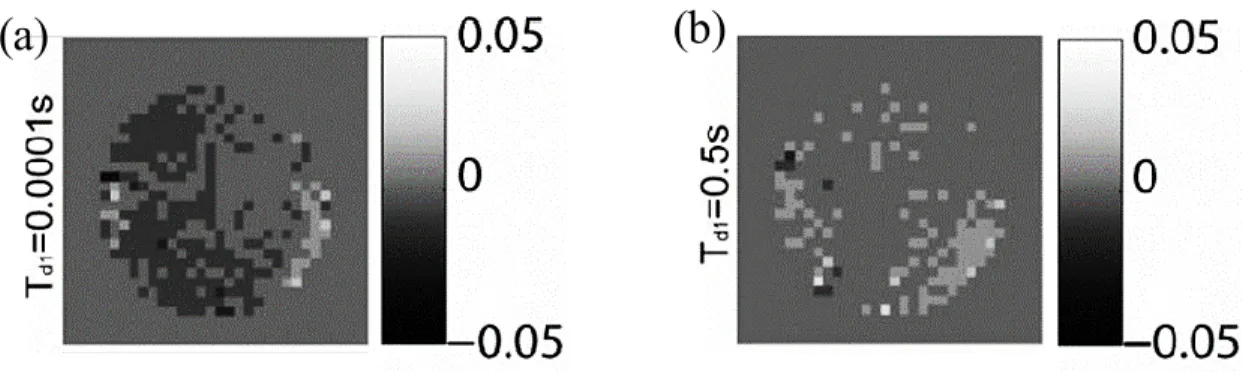
Figure 2-6. Comparison of simultaneous PET/MRI, PET/CT, and sequential PET/MRI. (a) MRI, (b) simultaneous PET/MRI, (c) CT, (d) PET/CT, (e) MRI, and (f) sequential PET/MRI (Richard et al., 2016). ... 20 Figure 2-7. The effect of magnetic fields on the flood map of (a) a PMT and (b) an APD (Pichler et al., 2008b). The 3D schemes of both detectors are also depicted. ... 22 Figure 2-8.(a) flood map of PMT, (b) losing light pattern due to the presence of a magnetic field, (c) adding materials with high magnetic susceptibility distorts main magnetic field homogeneity (Pichler et al., 2008b). ... 24 Figure 2-9. The gradient ripple increases with the bias voltage (Düppenbecker et al., 2016). ... 25 Figure 2-10. (a) Time jitter at the start of gradient pulse, (b) corresponding gradient sequence (Düppenbecker et al., 2016). ... 26 Figure 2-11. Effect of PET-insert on the noise level of the detected RF signal (Schulz et al., 2011). ... 26 Figure 2-12. Mean ratios (with PET-insert divided by without PET-insert) of (a) SNR and (b) homogeneity, calculated from 5 MRI acquisition sequencses for 17 slices. Values on the right indicate the means of all slices (n=17); TSE: turbo spin echo, GE100 and GE 300: gradient-echo with a repetition time of TR=100, and TR=300 (Judenhofer et al., 2008). ... 27 Figure 2-13. Mean ratios (inside MRI divided by outside MRI) of (a) single count rates and (b) measured coincidence count rates, outside and inside the MRI during the
xi
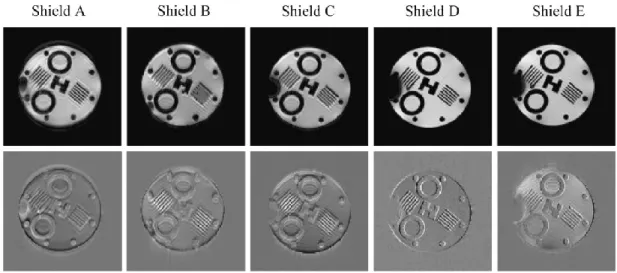
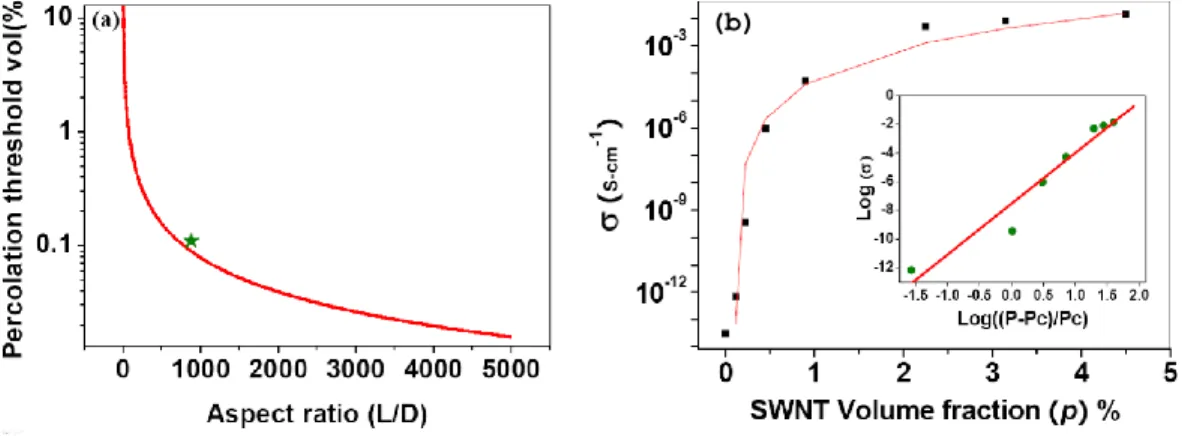
acquisition of turbo spin-echo (TSE) and gradient-echo (GE) sequences (Judenhofer et al., 2008). ... 28 Figure 2-14. (a) Light-fiber-based PET/MRI Systems, (b) short fiber and APD, (c) modified magnet, (d) integrated PET/MRI (Vandenberghe and Marsden, 2015). ... 29 Figure 2-15. SE as a function of the thickness of (a) a Cu plate for two different frequencies, (b) a Cu mesh for various hole sizes for RF frequency of 100 MHz (Kang et al., 2009). ... 32 Figure 2-16. Effect of an area of Cu plate on the MR image (Kang et al., 2009). .. 33 Figure 2-17. Chemical shift images (CSI) that give visual representations of induced eddy current fields with no shielding present on the left, two different thicknesses of copper shielding in the middle, and PET insert on the right (Peng et al., 2010). ... 33 Figure 2-18. (a) Gradient-echo sequence for different shielding configuration of copper and (b) corresponding normalized error image (Peng et al., 2010). ... 34 Figure 2-19. Eddy current measurement using CSI for carbon fiber shielding with two different delay times (a) t=0.0001 sec and (b) t=0.5 sec (Peng et al., 2014a). ... 35 Figure 2-20. Shielding effectiveness vs. thickness for Cu plate, carbon fiber, and MWNT composite at different frequencies. The SE of Cu mesh with two different hole diameters for 3 T MRI is also displayed. ... 36 Figure 2-21. (a) A typical electrical percolation of the CNT composite curve versus aspect ratio. (b) The electrical conductivity of the functionalized SWNT- Reactive Ethylene Terpolymer composites versus volume fraction of SWNT (Park et al., 2010). ... 37 Figure 2-22. Shielding effectiveness of SWNT in epoxy resin (plot labeled A-D) and MWNT composite (plot E-H) versus frequency (Li et al. 2006). ... 38 Figure 2-23. SE of SWNT, comparison of different aspect ratios and the effect of annealing (Li et al. 2006). ... 39 Figure 2-24. (a) the ASTM D4935-99 coaxial EMI SE tester; (b) required specimens (ASTM, 1999). ... 42 Figure 2-25. Illustrations, sizes, and photos of the newly developed SE tester (Vasquez et al., 2009). ... 42
xii
Figure 2-26. a) Schematic of mixer container, b) a scanning electron microscopy (SEM) image of CNT/PDMS sample after mixing, c) SEM of nanotube agglomeration (Huang et al., 2006). ... 44 Figure 2-27. Schematic diagram of ultrasonic mixing (Goyat et al., 2011). ... 44 Figure 2-28. Schematic of CNT bundle detachment and dispersion in IPA (Kim et al., 2018). ... 46 Figure 2-29. Schematic of making a film of Nano-composite using Doctor Blade Technique (Chen and Ting, 2013). ... 46 Figure 3-1 a) The LabPET II Detector module, b) the MR-compatible BGA-based detection module under study ... 57 Figure 3-2. Cylindrical-coordinate using for simulation, a purple circle shows a coordinate of one detection module ... 58 Figure 3-3. Experimental test set-up, inserting BGA-based detection module in 7 T MRI ... 62 Figure 3-4. Magnetic field changes due to metallic parts versus actual z position induced by changing the y position of each ball for an array of 10 balls, the image shows the magnetic field of ball #1, 5, 10. The insets show the total magnetic field changes due to 10 balls, (a) BGA of a ferromagnetic material, (b) BGA of SAC305 as a paramagnetic material. ... 63 Figure 3-5. Magnetic field changes as a function of position in the xz plane of a 3 T MRI for different positions, (a) no ball; (b) a ferromagnetic ball at R=15, z” = 0, θ = 0; (c) a ferromagnetic ball at R=15, z”= 0, θ = π; (d) sum of the effect of two ferromagnetic ball arrays positioned at R=15, z”= 0 , θ = 0 and π; (e) a SAC305 ball at R=15, z”= 0, θ = 0; (f) sum of the effect of two SAC305 ball arrays at R=15, z”= 0, θ = 0 and θ = π. ... 64 Figure 3-6. (a) Reconstructed image coordinate (z’) versus actual z coordinate with one ball of ferromagnetic material at (R, z) = (15, 0) from center of an MRI with main magnetic field of 3 T; inset is the zoom in of inside the green circle; (b) difference of actual z and reconstructed z’ for a ball of SAC305 with low susceptibility. ... 65 Figure 3-7. (a) Displacement of z’ coordinate for 10 balls of ferromagnetic material placed outside the RF coil at three different magnetic fields in comparison with one ball at
xiii
3 T; (b) change of z-z’ due to different gradient and magnetic field for ten SAC305 balls. ... 66
Figure 3-8. Magnetic flux density of LabPET II detection module at (a) 10 kHz; (b) 100 kHz; Magnetic flux density zoom in at the ASIC edge at (c) 10 kHz; (d) 100 kHz; Heat dissipation and induced eddy at (e) 10 kHz; (f) 100 kHz. Color bar: Volumetric heat dissipation (W/m3). Streamline (red line): current density distribution, flashed blue lines: magnetic flux density, flashed black lines: eddy current direction. ... 67 Figure 3-9. The magnetic flux density of a BGA-based detection module at (a) 10 kHz, (b) 100 kHz; Heat dissipation and induced eddy currents of a BGA-based detection module at (c) 10 kHz and (d) 100 kHz; Color bar: Volumetric heat dissipation (W/m3). Streamline (red line): current density distribution, arrow blue line: magnetic flux density. ... 68
Figure 3-10. Eddy current and heat dissipation for BGA-based detection module at (R, θ, z) = (15 cm, 9 degrees, 0) at (a) 10 kHz, (b) 100 kHz. Color bar: Volumetric heat dissipation (W/m3). Streamline (red line): current density distribution. ... 70 Figure 3-11. Spin echo sequences image of a falcon tube filled with water in the presence of (a) LabPET II module, (b) a BGA-based detection module inside the RF coil. ... 71
Figure 4-1. (a) LabPET II detection module. (b) FPGA-embedded signal processing unit with adaptor boards and detection modules installed. (c) LabPET II scanner assembly. (d) Dual threshold TOT schematic for a typical LabPET II event. (e) The architecture of one mixed-signal channel of the 64-channel ASIC of LabPET II (Arpin et al., 2011). ... 83 Figure 4-2. (a) Hexagonal surface RF coil, with a side length of 7 cm (in the middle), placed over the DM #1 of LabPET II in a test bench. A shielding layer is in place in the left figure and the frequency response was monitored using an EMSCAN located under the set-up; the AD board stands for the Adaptor board. (b) Gradient coil surrounded the DM #1, which is installed in a partially assembled scanner for energy and timing measurements using two detection modules with the radioactive rod source in between. Adaptor boards mounted on ESPU boards are also shown. Schematics of both set-ups were plotted to clarify the position of each part. ... 88
xiv
Figure 4-3. The normalized frequency response of signals received from LabPET II electronic and RF coil at frequencies of (a) 127.74 MHz (3 T), (b) 298 MHz (7 T), and (c) 400.25 MHz (9.4 T). The 100 MHz, 300 MHz, and 400 MHz peaks correspond to the clock signal, its 3rd and 4th harmonics. ... 93
Figure 4-4. RF coil effects on LabPET II detection modules: (a) baseline voltage and (b) RMS noise level without RF coil emission (0 T) and with RF emission at 127.74 MHz (3 T), 298 MHz (7 T) and 400.25 MHz (9.4 T). The pixels 1-128 belong to the DM #1 placed next to the RF coil and pixels 129-256 belong to the DM #2 located ~ 4 cm away from the RF coil. The same legend is used for both figures. ... 94 Figure 4-5. Histograms of the baseline for typical pixels from DM #1 exposed to the RF signal of a 3 T system: (a) pixel 37, (b) pixel 92; and for a typical pixel from DM #2 away from 3 T coil: (c) pixel 137 of APD #1 of ASIC #1. ... 95 Figure 4-6. a) The TOT energy spectra of one typical pixel without RF and with RF signal at the three characteristic frequencies of 127.74 MHz, 298 MHz and 400.25 MHz for 3 T, 7 T and 9.4 T. (b) Average coincidence time spectra of all coincident pixels between two LabPET II modules without and with RF signal at the three characteristic frequencies. The timing resolution for detection modules without RF signal (0 T) and the worst case in the presence of the RF coil (7 T) were displayed in the figure, and all results are reported in table 4-4. The energy and time spectra after fixing with the shielding layer are also illustrated in the figures. ... 96 Figure 4-7. (a) The RMS noise level of all pixels of both detection modules working at a clock rate of 100 MHz with and without shielding while exposed to RF emission at the different MRI characteristic frequencies. (b) Noise level with a 106 MHz clock. DM #1 was at 1 mm away from the RF coil while DM #2 was about 4 cm away from the coil. . 98 Figure 4-8. The frequency response of the RF coil at (a) 127.74 MHz, (b) 298 MHz, (c) 400.25 MHz with LabPET II’s clock working at 106 MHz. ... 99 Figure 4-9. (a) Baseline voltage and (b) RMS noise level of all pixels of the LabPET II detection modules in the presence of the gradient coil without and with gradient switching at 10 kHz, 50 kHz and 100 kHz. DM #1 was inside the gradient coil and DM #2 was about 4 cm away from the coil. The same legend applies to both plots. ... 100
xv
Figure 4-10. (a) The TOT energy spectra of a typical pixel of DM #1 without and with 10 kHz, 50 kHz and 100 kHz gradient switching; (b) the energy resolution for all the pixels in TOT bins without and with 10 kHz, 50 kHz and 100 kHz gradient; (c) coincidence time spectra of the two detection modules without and with 10 kHz, 50 kHz and 100 kHz gradient switching. The results for shielded DM #1 from the 100 kHz switching are shown as a black dotted line. DM #1 was inside the gradient coil and DM #2 was about 4 cm away from the coil. ... 101 Figure 4-11. (a) Baseline voltage and (b) RMS noise level of the LabPET II detection modules with and without gradient emission with the conductive paint used as a shielding layer. The green dotted curve represents the case where the inside of the gradient coil was covered by the conductive paint. The red dashed curve reports the case in which the DM #1 was completely wrapped by the conductive paint. ... 103 Figure 5-1. (a) Standard detection modules connected to the adaptor boards (AB), (b) the same electronic modules as an interposer/carrier board, (c) backside of the carrier board with four HV regulators, (d) front-side of the carrier board with four IDs, one with installed crystal, two thermal pads can also be seen. ... 116 Figure 5-2. 3D view of Interposer detection module ... 118 Figure 5-3. The gradient coil surrounded a detector installed on interposer board. A standard Adaptor board (AB) is also displayed. ... 119 Figure 5-4. (a) The baseline and (b) the RMS noise level of two IDs in the presence of RF coil signals. The inset of the figures (b) shows the noise of two standard DMs without and with RF signals at 9.4 T (the worst case for standard DM). The same legend is used for both figures and inset. ID #1 was 10 mm away from RF signals while ID #2 was 4 cm away from RF coil. ... 121 Figure 5-5. Baseline expansion of one pixel of the ID #1 in the presence of different frequencies. ... 122 Figure 5-6. Gaussian fit of TOT energy spectrum of interposer detector (a) one typical pixel of ID#1, (b) one typical pixel of ID#2; (c) energy resolution of all the pixels of two modules, in the presence of different RF coil signals of 127.74 MHz (3T), 298 MHz (7 T) and 400.25 MHz (9.4 T). ... 123
xvi
Figure 5-7. (a) Baseline, (b) RMS noise of the ID with and without gradient switching. The inset of figure (b) shows the noise level of a standard DM without gradient pulse and with gradient switching at 100 kHz. The legend is the same for both figures and inset. ... 124 Figure 5-8. The TOT energy resolution of each pixel with and without gradient switching. The inset shows the energy resolution of DM at the same conditions. ... 125 Figure 5-9. Performance of the ID with shielding layer in the presence of RF signals (a) RMS noise level of the ID, (b) Energy resolution of each pixel, inset is the fit of the energy spectrum of one typical pixel at three Larmor frequencies. ... 126 Figure 5-10. Performance of the ID with shielding layer in the presence of the gradient switching (a) RMS noise level of the ID, (b) Energy resolution of each pixel, inset is the fit of the energy spectrum of one typical pixel. ... 127 Figure 6-1. Gradient coil is placed around the detection module #1 for energy and timing measurement using two detectors. The radioactive rad has also been shown in the figure. ... 141
Figure 6-2. Conductivity of (a) SWNT and (b) MWNT in different solvents using EIS. UV-Vis spectra of (c) SWNT and (d) MWNT in IPA and Chloroform, (e) dispersion level of SWNT and MWNT in the different solvents. ... 142
Figure 6-3. Conductivity versus frequency for SWCNT-IPA-PDMS composite with 2 wt. % and 10 wt.%. To provide EMI shielding, the impedances of material should be more than the threshold level (green line), indicated in the figure ... 144 Figure 6-4. SEM of network generation of SWNT-PDMS with 2 kV energy and 20 µm aperture size, (a)the surface of 10 wt. % sample, (b) the fractured cross section of a 10 wt. % sample ... 145 Figure 6-5. The coating of CNT composite over FR4 (10 wt.% CNT) in a shape of the sample required for ASTM 4935-99 standard, left: load, right: reference ... 145 Figure 6-6. Shielding effectiveness results using ASTM standard ... 146 Figure 6-7. a) Mean of baseline (b) RMS noise level for each pixel of one ASIC of detection module in the presence of RF coil signal at 127.7 MHz (3T) and 298 MHz (7T). The results for shielded module were also displayed. The legend for figures (a) and (b) is the same. ... 147
xvii
Figure 6-8. (a) Gaussian fit of the energy spectra for one pixels, (b) Gaussian fit of average energy spectra of one ASIC of LabPET II detection module (64 pixels) in the presence of RF coil with CNT-composite as shielding layer. The results for shielded module were also displayed. ... 148 Figure 6-9. Changes in baseline and noise level due to the gradient switching a) without the gradient, b) gradient at 100 kHz, c) gradient at 100 kHz and shielding composite in place. ... 149 Figure 6-10. Energy resolution for one module with and without gradient switching and with shielding in place for 100 kHz gradient switching ... 150 Figure 6-11. The temperature variation (difference between each case and the case with fan without gradient switching) using different cooling configurations ... 151
xviii LIST OF TABLE
Table 2-1. Overview of PET/MRI system reported in the literature *(Disselhorst et
al., 2014). ... 17
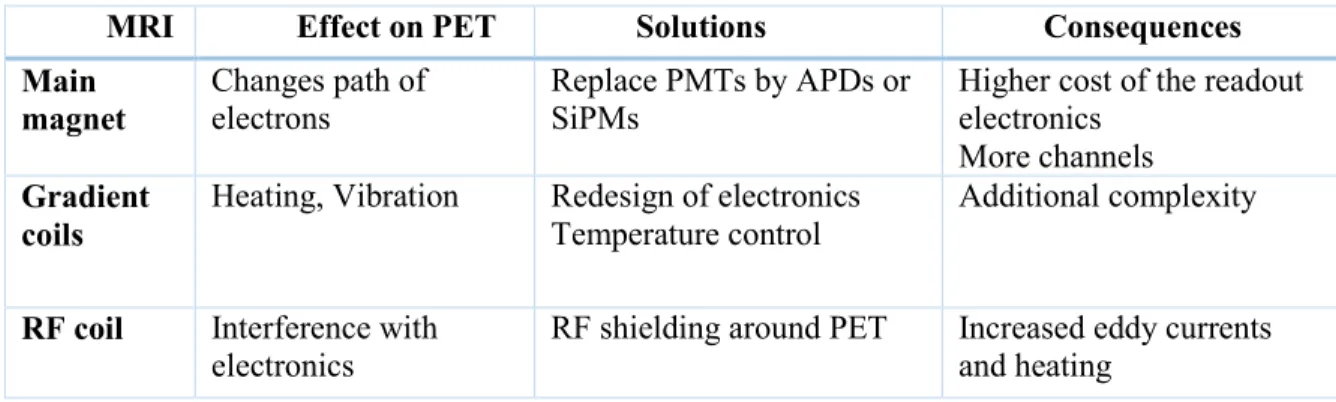
Table 2-2. Interference effects of PET components on an MRI. ... 21
Table 2-3. The advantage (green) and disadvantage (red) of different detectors. ... 22
Table 2-4. Interference effects of MRI on PET performance. ... 24
Table 2-5. Pros and cons of different shielding approaches. ... 35
Table 2-6. Comparison of CNT, copper, and carbon fiber properties. ... 37
Table 3-1. Susceptibility of different materials. ... 59
Table 3-2. Skin depth of copper and SAC305 at 100 kHz and 10 kHz ... 61
Table 3-3. Net current and heat dissipation of a LabPET II detection module, BGA-based detection module, and BGA-BGA-based detection module placed at the 0.5 mm distance from the original one. ... 69
Table 4-1. The shielding effectiveness of different materials at various frequencies, for 1 mm copper or CHO-SHIELD, 3 mm of carbon fiber without Cu foil. The carbon fiber SE values were presented based on the literature (Peng et al., 2014b, Greco et al., 2012) ... 92
Table 4-2. Eddy current effects of copper, carbon fiber, and CHO-SHIELD® 2056 paint. ... 92
Table 4-3. Average difference of photopeak position from reference at 0 T and TOT energy resolution for all pixels of APD#1 and APD#2 of ASIC #1 of DM#1 with and without RF signals, with and without shielding. The negative sign means a lower bin. .. 95
Table 4-4. Time resolution with and without RF signals for the two detection modules in coincidence, with and without shielding between the RF coil and detection modules. 97 Table 4-5. The average count rate of DM #1 (128 pixels) with and without shielding in the presence of RF signals. ... 98
Table 4-6. The average count rate of DM #1 with and without shielding in the presence of the gradient switching signals. ... 102
Table 6-1. Eddy current induction on SWNT-PDMS layer with different concentration ... 147
xx
List of Acronyms
ACRONYM DEFINITION
AB Adapter board
APD Avalanche photodiode
ASIC Application-specific integrated circuit
BGA Ball-grid array
CNT Carbon nanotube
CSA Chemical shift artifact
CSI Chemical shift image
DM Detection module
dTOT Dual time-over-threshold
EM Electromagnetic
EMI Electromagnetic interference
FOV Field of view
IPA Isopropyl alcohol
LDO Low-dropout
MRI Magnetic resonance imaging MWNT Multi-wall carbon nanotube PDMS Polydimethylsiloxane
PET Positron emission tomography PSRR Power supply rejection ratio
RF Radio-frequency
SE Shielding effectiveness
SEM Scanning electron microscopy
SNR Signal to noise ratio
SWNT Single-wall carbon nanotube TOT Time-over-threshold
CHAPTER 1
INTRODUCTION
1.1. Context and Issues
Magnetic Resonance Imaging (MRI) is a conventional medical imaging modality that records the magnetic field variations in a patient’s body. It has three main components. Its first part is the main magnet that is generally made of superconducting magnets cooled with Helium. It is crucial to preserve the magnetic field as homogeneously as possible. The second part of an MRI includes three gradient coils, one for each direction, that provide a linear gradation of the magnetic field. The third part is an RF coil, which transfers RF energy at the Larmor frequency to align the nuclear spins of the Hydrogen atoms in the body and receives the electromagnetic (EM) radiation from the precessing spins to produce the image. The MRI scanner provides anatomical and functional images.
Another powerful and non-invasive method in medical imaging is Positron Emission Tomography (PET). It involves the injection of a radiopharmaceutical into the body and detection of the annihilation photons utilizing scintillation crystal arrays and a data acquisition (DAQ) system. The PET scanner reveals the physiological information rather than the anatomical data. The anatomical information is highly variable (from one image to another one) and is generally absent in PET imaging. The major deficiency of a PET scanner is its limitation to provide anatomical details due to its limited spatial resolution. Precise localization of the lesions and improvement in the quantitative accuracy of the PET signal is possible by providing anatomical information. The first approach to overcome this deficiency is by using computer algorithms to co-register the PET images to those of Computed Tomography (CT) or MRI (Levin et al., 1988). The second method to have aligned anatomical and physiological images is to couple a PET acquisition system with another anatomical imaging scanner and fabricate dual-modality scanners, for instance, PET/CT or PET/MRI. Such dual-modality scanners, based on a combination of PET and MRI, are classified into two types: (i) sequential PET/MRI and (ii) simultaneous PET/MRI.
Simultaneous PET/MRI scanners are capable of detecting the double amount of information and of providing more biological and functional data than CT, without
2
increasing the radiation dose (Vandenberghe and Marsden, 2015). Thus, in comparison to PET/CT, real simultaneous PET/MRI significantly reduces radiation exposure, lessens risk and costs, and demonstrates safety and clinical values. Simultaneous PET/MRI also offers soft-tissue contrast and motion correction. Besides, it could improve the spatial resolution of the PET scanner using very high magnetic field MRI due to the reduction of the positron range.
Figure 1-1 illustrates the comparison of different biomedical imaging methods. It clearly shows that to have accurate and comprehensive results, radionuclide imaging techniques must be combined with other functional or anatomical modalities.
Figure 1-1. Comparison of different biomedical imaging techniques.
However, integrating two electronic systems, such as PET and MRI scanners, causes interactions between them that negatively affect each subsystem’s performance. There are three crucial sources of interferences between PET and MRI; (i) radio frequency (RF) from the MRI coil and PET clock; (ii) gradient switching frequency oscillating from 10 kHz to 100 kHz; (iii) the strong magnetic field of MRI with a typical range of 1.5 T to 9.4 T.
These interactions impose the use of an appropriate shielding configuration to avoid mixing the RF signals, redesigning of the PET electronics to emit less electromagnetic signals or the elimination of the problematic PET components from MRI field-of-view to preserve the homogeneity.
Regardless of the technical challenges to combine PET and MRI into a single gantry, there are two fundamentally different type of commercially available PET/MRI scanners. The first one, from Siemens, was designed using an avalanche photodiode (APD)-based PET scanner with 3 mm spatial resolution and 4 ns timing resolution. The second PET/MRI scanner, from Philips, is a sequential one that shares a single patient handling system. It enables spatially coordinated PET and MRI data to establish whole-body attenuation correction. However, its lack of temporal matching between two functional datasets is an intrinsic limitation. The improvement of the simultaneous approach taken by Siemens has
3
involved more academic works than the straightforward sequential approach retained by Philips.
Advances in solid-state photodetectors and the use of APDs and silicon photomultipliers (SiPM) open a new trend in PET/MRI scanners offering excellent timing resolution. The LabPET II technology is a fully digital PET detection platform based on an actual one-to-one coupling of crystals with APD pixels alongside independent parallel processing. It uses a time-over-threshold scheme instead of pulse height analysis to allow a high level of integration and to decrease power consumption.
Thus far, standard shielding configurations have used metallic materials, for example, a plate and mesh of copper, which successfully have reduced electromagnetic interferences (EMI) between PET and MRI; however, eddy current induction remains a critical problem in this approach (Kang et al., 2009). Moreover, the metallic shielding is expensive and heavy. Recently, researchers proposed to use carbon fiber to eliminate the EMI from the RF coil and clock of PET and to decrease eddy current inductions. Nevertheless, carbon fiber was unable to exclude EM interactions of the gradient switching (Peng et al., 2014a).
On the other hand, recent research in high-frequency communication applications using carbon nanotube (CNT) composites revealed their outstanding potential for perfect electromagnetic shielding (Li et al., 2012). Using conductive composite based on carbon nanotube instead of metal offers some particular advantages. First, it has a low atomic number, thus, it is highly transparent to gamma radiation. Second, it has good electrical and thermal conductivity. Third, producing carbon-based composite is significantly cheaper than metal. Finally, it is very lightweight and flexible without the drawbacks of metal such as corrosion and oxidation. Based on these unique characteristics, in this project, carbon-based composites were considered as an attractive candidate for use in simultaneous PET/MRI as a shielding material.
1.2. Research Questions
As the interferences between PET and MRI result from three different sources, the main question is how to realize an MR-compatible PET-insert based on LabPET II
4
detection modules. This question requires examining material selection, EMI, shielding, and temperature stabilization.
Magnetic field homogeneity is sensitive to the susceptibility of materials inserted inside the MRI bore. Materials with different susceptibility than that of air causes inhomogeneity and artifacts in MR images. Thus, for each part of the electronics of a PET-insert, it is essential to know:
Could this material cause inhomogeneity?
What is the best alternative option for these components?
How could we change the electronic board design to decrease the inhomogeneity of the main magnetic field or EMI?
Furthermore, the performance of LabPET II detection module under electromagnetic distortion from MRI should be examined to answer the following questions:
What are the effects of the RF coils and the gradient coils at different frequencies on the performance of the LabPET II detection module?
What are the shielding layer characteristics to minimize EMI between PET and MRI scanners?
Besides, any varying magnetic field induces eddy currents on highly conductive materials, resulting in increasing the temperature of electrical components of PET inserted inside the MRI. Moreover, these currents generate another magnetic field in the opposite direction of the gradient field that distorts the MR images. Thus far, to our knowledge, none of the conventional shielding methods were capable of addressing, concurrently, all issues associated with the gradient, namely low-frequency interferences, eddy currents, and temperature stability. Consequently, our next bottleneck is:
How could we shield a PET scanner from EMI while reducing eddy currents and stabilizing the temperature?
How can we increase the conductivity of a CNT composite in the low frequency? What is the best method to fabricate a homogenous CNT-based composites?
1.3. Objectives and Hypotheses of the Project
Since the PET detection modules are located inside an intense static and dynamic magnetic fields of MRI, the performance of both modalities may degrade. Our overall
5
objective is to make the LabPET II detection module compatible with an MRI scanner. In this project, we focus on examining the performance of the LabPET II detection module in the presence of gradient and RF coils, individually, and if needed on modifying the detection module to develop an MR-compatible PET-insert.
The first goal of this thesis is to determine the effects of PET electronic components on an MRI behavior while the metallic material is located between the RF coil and the gradient coil of the MRI. The assumption is that ferromagnetic and conductive materials, placed in an MRI bore, cause inhomogeneities in magnetic fields, which in turn generates errors in an MR image. The effects of inserting ferromagnetic materials and the metallic parts in the center of MRI have been mainly explored before (Costa et al., 2009, Shafiei et al., 2003, Sasaki et al., 2013). However, the study of their effects outside the field of view of MRI inside the gradient has never been explained. For the PET/MRI case, we need to know which material parameters are important and how we can decrease the effects of PET-insert electronics from a material point of view. To address these unanswered concerns, we conducted two studies using theoretical calculations and COMSOL software to examine the impacts of different susceptibility, conductivity and size of material on PET and MRI in the presence of the magnetic field and the gradient switching. Furthermore, the eddy current and heat dissipation were investigated.
The second goal of this project is to scrutinize the interferences between LabPET II components and MRI parts with different magnetic strengths of 3 T, 7 T and 9.4 T. In fact, the objective is to identify the most vulnerable components of LabPET II electronics when an MRI is turned on. If the performance of LabPET II detection module is acceptable, we could conclude that it is safe to insert the LabPET II electronics inside an MRI. For this reason, the analog baseline voltage, RMS noise level, energy, and timing resolutions of the LabPET II detection module were acquired in the presence of gradient and RF coil signals and the results were compared with the LabPET II detection module results without EM interferences. The results of this very first experiment of the LabPET II detection module in the presence of EMI showed changes in PET performance that need to be addressed.
The third goal of this thesis is to reduce the interferences between LabPET II and MRI scanners using a suitable shielding configuration or redesigning PET electronics. The hypothesis is that a specified thickness of any conductive layer shields the electromagnetic
6
frequency. Thus, for a well-defined frequency of the RF coil, an appropriate thickness of conductive material was calculated based on the material conductivity. Consequently, to eliminate the observed effects, the LabPET II detection module was shielded from EMI sources using specific thickness based on the material properties. Then the PET performance was measured to determine the effectiveness of the shielding layer in improving the PET performance.
The fourth goal of this project is to eliminate the effects of eddy currents due to the gradient switching on PET-insert and MRI; hence, we need to find a shielding material that generates fewer eddy currents than a metallic layer while blocking the low-frequency RF emission from the MRI. The hypothesis was that a conductive composite with a good conductivity could eliminate the RF interaction. Besides, a conductive composite has a network-shaped conductive structure and it is composed of small conductive loops. Thus, it only creates insignificant quantities of eddy currents. Furthermore, each layer of a composite material could compensate for the eddy current effects of the adjacent layer, as if it was composed of multi-laminated layers. Therefore, it has less negative influences on MRI image quality. Taking advantage of carbon nanotube composites, a new flexible shielding configuration able to eliminate eddy current effects was proposed.
The next goal is to examine whether a new design of LabPET II front-end (called interposer) considering a change of components size and removing ferromagnetic parts could improve PET-insert performance in the presence of MRI coils. The hypothesis was that sandwiching an ASIC between two printed circuits boards (PCB) can make it immune to EMI. The obtained results confirm less interaction between PET and MRI signals in comparison with a standard LabPET II detection module; however, the results also show a noticeable change in the performance of the interposer detector such as its noise level and energy resolution.
The last goal was to investigate the effects of the LabPET II electronics on an RF signals of MRI. The hypothesis was that as the PET electronics were placed near the RF coil, the PET electronics would deteriorate the RF signal if the clock harmonics fell within the RF coil bandwidth. Since our goal is to design PET electronics working at different magnetic fields of MRI, the RF coil signal in the presence of a 100 MHz PET’s clock was
7
measured. Afterwards, we proposed to change the PET clock in a way that its harmonics were removed from all three bandwidths of the MRI RF coil.
1.4. Original Contributions and Thesis Layout
The aformentioned questions in section 1.2 are answered through the four published and submitted papers. The chapters of this report are organized in a way to clearly address the challenges of genuinely simultaneous PET/MRI scanners using the LabPET II technology and to describe the methods to overcome those issues. The effects of material properties on the PET and MRI behavior are presented. The relative performance of the LabPET II detection module with and without MRI coils is evaluated. Specific approaches to eliminate those problems have been employed and their influences on the PET performance have been described. Finally, fabrication of a new shielding material and the obtained results using this shielding are described.
This document will be followed by a review of the state-of-the-art in chapter 2 where the PET scanner, MRI scanner, and challenges in front of bimodal scanners as well as the means to overcome them with emphasis on shielding methods are explained. Chapter 3 includes the paper entitled “Studying the Effects of Metallic Components of PET-insert on PET and MRI Performance due to Gradient Switching” published in Physics in Medicine
and Biology, 2019; 64 (7), which focuses on the metallic material effects on PET and MRI
performance because of the gradient switching. The goal is to find out whether inserting metallic parts outside the imaging field of view of MRI scanner, between the gradient and the RF coils, would disturb the MRI performance or even the PET performance. The results confirm that the ferromagnetic parts interact with the performance of both scanners and should be eliminated from the MRI gantry. In this chapter, we also discuss the essential design consideration to have an MR-compatible PET detection module. In chapter 4, we present a paper entitled “Initial MR-Compatibility Investigation of LabPET II Detector Technology for Simultaneous PET/MRI” submitted to Physics in Medicine and Biology. This paper describes the results of placing the LabPET II detection module in a situation similar to that of an MRI bore. The effects of the gradient and RF coils on the PET performance are determined, and appropriate methods to minimize those effects are presented. In chapter 5, the third paper, with the title “MRI-Compatibility Study of a
Low-8
Profile Positron Emission Tomography Front End with Submillimeter Resolution”, in preparation for submission to Nuclear Instruments and Methods in Physics Research
Section A, is presented. The performance of interposer detector, as a modified version of
the LabPET II detection module, in the presence of EMI is investigated. A composite layer is applied to eliminate the EMI remaining after sandwiching ASICs between two electronic boards. Chapter 6 includes the last paper entitled “Shielding Electromagnetic Interference of Simultaneous PET/MRI Using Flexible Ultra-Thin Carbon-Nanotube Composite” prepared to be submitted to IEEE Transactions on Nanotechnology. It discusses the fabrication of new shielding composite based on CNT and clarifies how it could improve PET/MRI performance. Different solvents were examined to synthesize a composite with high conductivity at the desired frequency range. Chapter 7 provides a summary and conclusion on this project and justifies future designs and tests required for developing the LabPET II-based detection module to be compatible with MRI. In appendix A to C, the RF coil and the gradient coil design considerations, as well as the eddy-current measurement set-up, are described, respectively.
10
CHAPTER 2
LITERATURE REVIEW
The first idea of a hybrid PET and MRI originates back to 1986 when Iida proposed employing a magnetic field to enhance the spatial resolution of PET (Iida et al., 1986). However, the first hybrid PET/MRI, introduced in 1997, consisted of a single ring PET scanner mounted within the RF coil of the MR scanner (Yiping et al., 1997), while SPECT/CT had been already used in clinical applications (Hasegawa et al., 1990). The first drawback of a PET/MRI hybrid was the susceptibility of the photomultiplier tubes (PMT) detector of the PET scanner to the magnetic interferences. The initial designs utilized optical fiber cables to transfer the light from crystals to the PMT detectors located outside the strong static magnetic field of the MRI. The first pre-clinical PET/MRI scanner with a 1.5 T magnetic field was developed using this approach in 2006 (Catana et al., 2006, Lucas et al., 2006). The second approach employed a split magnets (Shaw et al., 2005) beween which the PET scanner was inserted, but maintenaning the magnetic field’s homogeneity was more difficult than with the standard structure.
By developing non-magnetic sensitive silicon-based photodetectors for PET such as APD- (Lecomte et al., 1993) and SiPM- (Renker, 2006) based scanners, the combination of these two modalities to acquire data simultaneously turned to become possibile. A prototype integrated LSO-APD-based PET scanner and 7 T MRI for small animal applications was developed in 2006 (Pichler et al., 2006). Furthermore, a fast SiPM-based PET device has been inserted in 3 T MR for pre-clinical usage (Schulz et al., 2011, Weissler et al., 2012). The first human PET/MRI scanners constructed by Siemens consisted of a head BrainPET scanner and a modified 3 T MAGNETOM Tim Trio as MRI (Schlemmer et al., 2008). Moreover, the sequential PET/MRI scanner called the Philips Ingenuity TF (Herzog and Van den Holf 2012) and the simultaneous PET/MRI of Siemens (Zaidi and Del Guerra, 2011) has been implemented for whole-body applications. Recently, GE has integrated time-of-flight PET with 3 T MRI for whole-body use. The principal goal, which has been pursued in all the above-mentioned methods, is to minimize the coupling between
11
two subsystems and preserve the performance of each modality. Currently, the development of a hybrid PET/MRI is an active field of research.
2.1. Fundamental Concept of PET
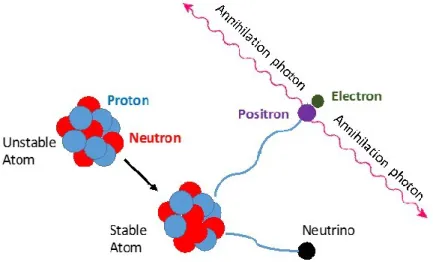
PET involves the injection of a radiopharmaceutical into the patient’s body. The radiolabeled compound is known as a tracer or radiotracer. While the positron-emittingradioisotope decays, two annihilation photons with energy equal to the rest-mass energy of an electron or a positron, i.e. 511 keV, are emitted and detected by a ring of detectors (Cherry et al., 2010).
Indeed, the positron and electron form a momentary atom and then the positron combines with the electron and emits two annihilation photons, which leave the annihilation event site in nearly opposite directions (Figure 2-1). Nevertheless, due to the kinetic energy of both particles, the annihilation photons may be emitted non-collinearly (about 0.25o deviation) which affects the ability of positron localization.
Figure 2-1. The positron-emission decay process of an unstable nucleus.
The average positron range is important for determining the spatial resolution since the annihilation sites are far away from the transformation sites (in quantum physics scale) owing to the positron range. It is worth mentioning that applying a strong external magnetic field evidently improves spatial resolution when the positron possesses high energy. Thus, an ultra-high field PET/MRI has the potential to improve the spatial resolution of a PET image in planes perpendicular to the main magnetic field because of the confinement of the positron range (Hammer et al., 1994).
12
The non-collinearity becomes vital in a large diameter scanner such as a brain scanner or whole-body scanner, where, the probability of detecting slightly misplaced events increase as shown in Figure 2-2. Therefore, in a large diameter scanner, it is plausible to identify the activity by the adjacent crystals due to a slight change in the positron direction or a small deviation of the angle, especially when a thin crystal is implemented in the PET detector.
Figure 2-2. The non-collinearity effect on two scanners with different diameters. The blue ring represents a smaller scanner and the gray one symbolizes a scanner with a larger diameter.
2.1.1. PET Components
A PET scanner is a detection camera for sensing the annihilation photon pairs with the energy of 511 keV emitted from labeled radio-nuclei in the matter. Each scanner typically consists of scintillator crystals, photodetectors, and electronic boards. A PET scanner is made of several rings axially surrounding the object. Each ring contains hundreds of crystals to detect annihilation photons. These crystals are couples to the photodetector and then the detector is connected to the electronic boards to determine the time of coincidence, the energy, and the position of annihilation photons.
Numerous scintillation materials are available with different properties qualified for various applications. The most commonly used scintillator crystals for PET scanners are from LYSO, LGSO, and LSO, with short decay time and excellent stopping power.
13
The PMT was undoubtedly the most widely used photodetector in PET. However, new challenges, such as the reduction of a PET scanner’s diameter and implementation of PET/MRI scanners, motivated researchers to consider other types of detectors. The APD has been used in commercial scanners (Lecomte et al., 2006) and the SiPMs (Llosa et al., 2008) and single-photon avalanche diode (SPAD) (Renker, 2007, Cova et al., 1996, Piemonte, 2006, Dolgoshein et al., 2006) are currently under investigation.
The LabPET II is a small animal PET scanner designed and developed at Université de Sherbrooke with sub-millimeter spatial resolution. The detection module of the LabPET II, shown in Figure 2-3, includes four parts:
(i) Scintillation crystals convert high energy annihilation photons into visible photons.
(ii) Avalanche photodetectors detect and convert these photons into an electrical signal, which is used by electronic boards for further processing.
(iii) Application-specific integrated circuits (ASICs) amplify and shape the APD signal to extract the relevant information such as time and energy of the detected photons.
(iv) A connector transfers digital signals to the acquisition electronics.
Figure 2-3. The detection module (DM) of the LabPET II scanner.
2.2. Overview of Magnetic Resonance Imaging
The world's first MRI scanner was invented in the 1970s. At that time, Damadian proposed using Nuclear Magnetic Resonance (NMR) signal to form images of issues
14
withen the body (Damadian, 1974) and Lauterbur reported the first application of Magnetic Resonance Imaging (MRI) (Lauterbur, 1973). In 1974, Lauterbur and Mansfield, without knowledge of each other’s work, described the use of magnetic field gradients for spatial localization of NMR signals. Their discoveries established the foundation of MRI.
Primary MR imaging was time-consuming and challenging. Modern scanners provide images with different contrast of objects in vivo. The capability of MRI to acquire anatomical images with high spatial resolution and superior soft-tissue contrast, along with revealing information of perfusion, diffusion, and local chemical composition of tissue, made it one of the most valuable imaging modalities.
2.2.1. MRI Parts
The MRI scanner is composed of the main magnet, gradient coils, and an RF coil shown in Figure 2-4. These parts are briefly described below.
Figure 2-4. A schematic of the main parts of an MRI.
Main Magnet: It is the most expensive part of the MRI scanner. The majority of modern scanners use superconducting magnets to provide high magnetic fields for MRI. Superconducting magnets are capable of generating larger fields than resistive and permanent magnets. The temperature of superconducting magnets is kept below the critical temperature by cooling them with liquid helium or nitrogen. One of the essential requirements for MRI is to preserve its main magnetic field as homogeneously as possible.
15
A magnetic field homogeneity lower than 1 p.p.m. over the volume of interest is acceptable.
Gradient Coils: The gradient coils generate the secondary magnetic fields. They are located inside the MRI gantry and arranged in the opposite direction to produce a negative and positive pulse. There are three gradient coils, one for each axis, that produce linear gradations of the the magnetic field to enable localization of MR signals in the x, y, z directions. Once they are switched on, one side of the magnet bore has lesser strength and the other side has greater strength than the main static magnetic field. This variation permits the localization of image slices that is necessary to form MR images.
RF Coil: The RF coil is a transmitter/receiver that broadcasts the RF signal to the patient and receives the returned signal. A radio frequency pulse with a frequency equal to the Larmor frequency of hydrogen atoms is emitted from an RF coil to align the phase and tip over the nuclei that causes decrement in the longitudinal magnetization and establishes a new transversal one.
2.2.2. Physics of MRI
MRI is one of the most commonly used medical imaging methods, which records the RF signal emitted from atoms excited at their Larmor frequency. One key advantage of MRI is that allows the accurate measurement of anatomical data without injecting radiopharmaceuticals.
The physics of MRI is entirely different from the PET and CT princibles. In MRI, the image of tissue is generated by transverse magnetization precesses at Larmor frequency, which induce a current in an RF coil. These signals were generated in the body by protons as a response to the trigger from the radiofrequency pulses.
The human body is mainly composed of water (50-75%) and fat (20-30%), both containing hydrogen atoms. MRI detects the presence of hydrogen atoms using a strong magnetic field. Thus, MRI creates images by exciting the hydrogen spins to their higher energy level; then their magnetization is tilted to the transverse plane by a tuned RF coil. This magnetization induces eddy currents in the RF coil. The frequency of the RF signal is proportional to the magnetic field to which these atoms are subjected during the relaxation process and is defined by the Larmor equation as (Mackiewich, 1995, Nishimura, 2010):
16
0 B (2.1)
where ω0 is known as either the precessional, Larmor or resonance frequency, B is the main magnetic field, and γ is the gyromagnetic ratio that is a unique constant of every atom. The gyromagnetic ratio of a proton (Hydrogen) is 42.58 MHz/Tesla.
When a strong magnetic field is applied to the body, many of the free hydrogen nuclei align parallel or anti-parallel to the magnetic field. The aligned atoms create the magnetic moments M paralleled to the main magnet, the sum of these moments creates the net longitudinal magnetization (ML). Since ML is parallel with B, it is not possible to detect it.
To change the magnetization direction, an RF pulse is triggered at the corresponding Larmor frequency to rotate the ML by 90 degrees. In this situation, all the ML vectors cancel
each other out and the transverse magnetization (MT) of atoms, which rotates with the
frequency of ω, can be detected as a dynamic magnetization. According to Faraday’s law, this magnetic variation induces a voltage in the receiver coil. By turning off the RF signal, the transverse magnetization starts to disappear and the longitudinal magnetization raises to its original value. The detected signals by an RF receiving coil originate from the entire body and the generated image excludes any spatial encoding information. Therefore, the gradient coils are used to locate the origin of a signal by slice selection, frequency encoding, and phase encoding depending on the position of targeted tissue (Lipton, 2008).
2.3. Integrated PET and MRI
Several reasons make PET/MRI an appropriate scanner for clinical and preclinical studies. First, large varieties of PET tracers are available and the sensitivity of PET is in the pico-molar range. Second, MR delivers high resolution and high soft-tissue contrast images in comparison with other molecular imaging modalities. Third, the PET image can be complemented by the MR image. From another point of view, simultaneous imaging of PET and MRI could save total acquisition time and create images with multiple dynamic processes. Besides, MRI can be used to correct motion in PET data. Lastly, there is no need to inject an additional radiation dose for MR images. PET/MRI overcomes some of the limitations of PET/CT such as limited soft-tissue contrast and high radiation doses. In PET/CT scanners, while both systems share a common patient bed, they are hard-wired back-to-back thus impeding simultaneous data acquisition, which is possible to achieve
17
through a combination of PET and MRI scanners. PET/CT is a faster method than PET/MRI since MRI requires around 30 minutes to take an image. In addition, a CT image is used to perform the attenuation correction of PET, which is a challenging topic in the PET/MRI system.
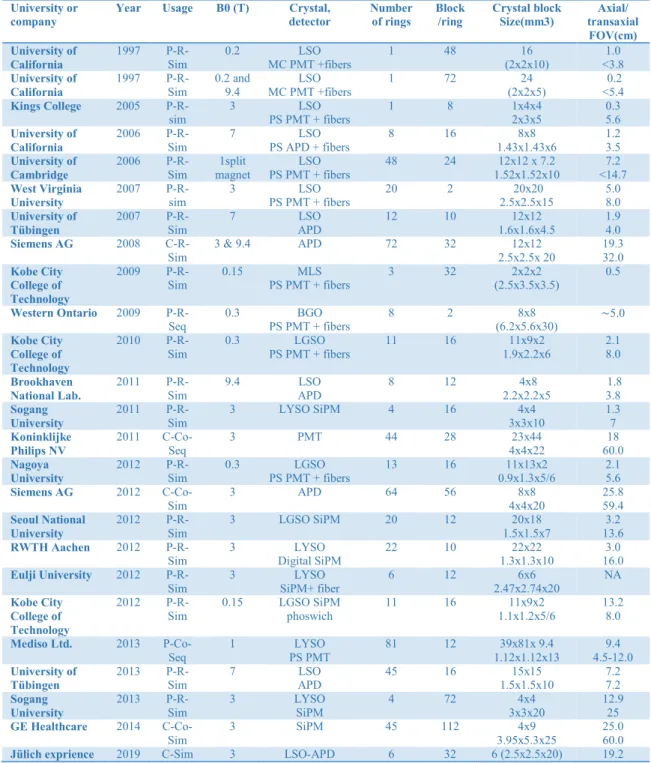
Table 2-1. Overview of PET/MRI system reported in the literature *(Disselhorst et al., 2014).
University or company
Year Usage B0 (T) Crystal, detector Number of rings Block /ring Crystal block Size(mm3) Axial/ transaxial FOV(cm) University of California 1997 P-R-Sim 0.2 LSO MC PMT +fibers 1 48 16 (2x2x10) 1.0 <3.8 University of California 1997 P-R-Sim 0.2 and 9.4 LSO MC PMT +fibers 1 72 24 (2x2x5) 0.2 <5.4 Kings College 2005 P-R-sim 3 LSO PS PMT + fibers 1 8 1x4x4 2x3x5 0.3 5.6 University of California 2006 P-R-Sim 7 LSO PS APD + fibers 8 16 8x8 1.43x1.43x6 1.2 3.5 University of Cambridge 2006 P-R-Sim 1split magnet LSO PS PMT + fibers 48 24 12x12 x 7.2 1.52x1.52x10 7.2 <14.7 West Virginia University 2007
P-R-sim 3 PS PMT + fibers LSO 20 2 2.5x2.5x15 20x20 5.0 8.0
University of Tübingen 2007 P-R-Sim 7 LSO APD 12 10 12x12 1.6x1.6x4.5 1.9 4.0 Siemens AG 2008 C-R-Sim 3 & 9.4 APD 72 32 12x12 2.5x2.5x 20 19.3 32.0 Kobe City College of Technology 2009 P-R-Sim 0.15 PS PMT + fibers MLS 3 32 (2.5x3.5x3.5) 2x2x2 0.5 Western Ontario 2009 P-R-Seq 0.3 BGO PS PMT + fibers 8 2 8x8 (6.2x5.6x30) ∼5.0 Kobe City College of Technology 2010
P-R-Sim 0.3 PS PMT + fibers LGSO 11 16 1.9x2.2x6 11x9x2 2.1 8.0
Brookhaven National Lab. 2011 P-R-Sim 9.4 LSO APD 8 12 4x8 2.2x2.2x5 1.8 3.8 Sogang University 2011 P-R-Sim 3 LYSO SiPM 4 16 4x4 3x3x10 1.3 7 Koninklijke Philips NV 2011 C-Co-Seq 3 PMT 44 28 23x44 4x4x22 18 60.0 Nagoya University 2012
P-R-Sim 0.3 PS PMT + fibers LGSO 13 16 0.9x1.3x5/6 11x13x2 2.1 5.6
Siemens AG 2012 C-Co-Sim 3 APD 64 56 8x8 4x4x20 25.8 59.4 Seoul National University 2012 P-R-Sim 3 LGSO SiPM 20 12 20x18 1.5x1.5x7 3.2 13.6 RWTH Aachen 2012
P-R-Sim 3 Digital SiPM LYSO 22 10 1.3x1.3x10 22x22 16.0 3.0
Eulji University 2012 P-R-Sim 3 LYSO SiPM+ fiber 6 12 6x6 2.47x2.74x20 NA Kobe City College of Technology 2012 P-R-Sim 0.15 LGSO SiPM phoswich 11 16 11x9x2 1.1x1.2x5/6 13.2 8.0 Mediso Ltd. 2013 P-Co-Seq 1 LYSO PS PMT 81 12 39x81x 9.4 1.12x1.12x13 9.4 4.5-12.0 University of Tübingen 2013
P-R-Sim 7 APD LSO 45 16 1.5x1.5x10 15x15 7.2 7.2
Sogang University 2013 P-R-Sim 3 LYSO SiPM 4 72 4x4 3x3x20 12.9 25 GE Healthcare 2014 C-Co-Sim 3 SiPM 45 112 4x9 3.95x5.3x25 25.0 60.0
Jülich exprience 2019 C-Sim 3 LSO-APD 6 32 6 (2.5x2.5x20) 19.2 *abbreviation: P = preclinical; C = clinical, status (R = research; Co = commercial), and operation (Sim =
18
Academic researches and commercial works on PET/MRI are categorized into three types, namely sequential, insert, and hybrid scanner; among them, the last two perform simultaneous acquisition of PET and MRI data. An overview of several PET/MRI systems is shown in Table 2-1.
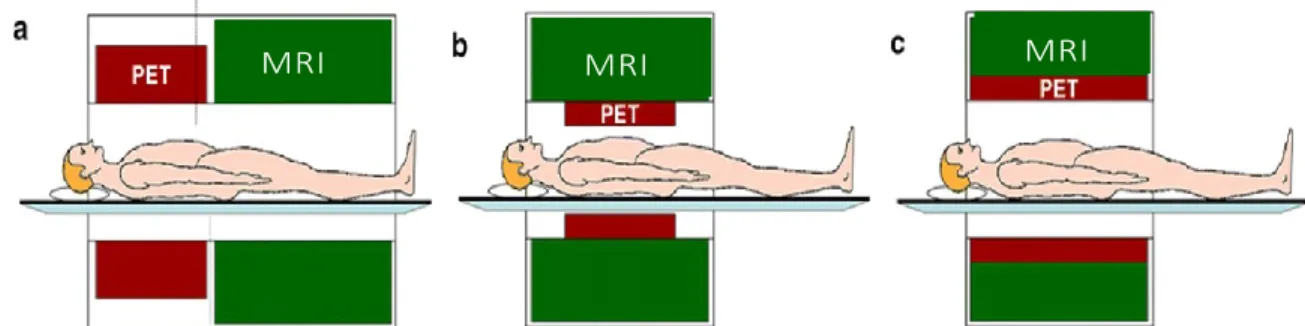
The sequential PET/MRI system (Figure 2-5(a)), such as HRRT-PET-insert, scans the PET and MRI images using two separate devices to avoid the interaction of the two modalities, which is the main advantage of the sequential PET/MRI. This system is flexible according to the application and workload. However, it is difficult to guarantee that the posture and metabolic state of the patient are the same since the two modalities are scanning at different times. Two stand-alone systems, allowing only sequential data acquisition and subsequent image fusion, cannot provide complementary dynamic information. Moreover, post-acquisition image fusion by software, especially in high-resolution abdominal or thoracic studies, is complicated and inaccurate. Equally, sequential imaging of functional parameters similar to fMRI and PET necessitates the reproducibility of operational processes to allow a temporal correlation after the acquisition.
Figure 2-5. Schematic of three different methods to combine PET/MRI, (a) sequential, (b) insert, and (c) fully integrated (Pichler et al., 2008a)
In simultaneous PET/MRI, the two modalities are combined in one system and this bimodal scanner overcomes the limitations of each individual scanner and guarantees temporal and spatial registration of the two datasets. In fact, PET scanners, using tracers, show how organs and tissues are functioning, which highlight abnormalities to indicate disease even before any structural modification of tissue happened. MRI scan uses a strong magnetic field to produce detailed images of soft tissues, organs, bones, and other internal structures of the body. Therefore, combining MRI and PET provides an excellent opportunity to understand tissue metabolism with anatomical precision. Simultaneous