1
Université de Montréal
Regulation of thecal endothelial cell function by growth factors in ruminants
par Morad Benkoura
Département de biomédecine vétérinaire Faculté de médecine vétérinaire
Mémoire présenté à la Faculté de médecine vétérinaire en vue de l’obtention du grade de Maîtrise ès sciences (M. Sc.)
en sciences vétérinaires option reproduction
Mai , 2019
2
Université de Montréal Faculté de médecine vétérinaire
Ce mémoire intitulé
Regulation of thecal endothelial cell function by growth factors in ruminants
présenté par Morad Benkoura
a été évalué par un jury composé des personnes suivantes: Younès Chorfi Président-rapporteur Christopher Price Directeur de recherche Gustavo Zamberlam Codirecteur Francis Beaudry Membre du jury
3 RÉSUMÉ
Cette étude a été réalisée afin d'étudier les effets de BMP4 et de TGFβ1 sur l'expression de gènes et de protéine des cellules endothéliales de la thèque chez l'ovin. Les ovaires ovins ont été obtenus à partir de brebis adultes, quel que soit le stade du cycle œstral, et les cellules endothéliales de la thèque ont été isolées à l'aide de la technologie pluriSelect et cultivées. Après exposition à BMP4 et à TGFβ1 pendant 24 heures, les acides ribonucléiques totaux (ARN) ont été isolés pour une analyse quantitative de la réaction en chaîne de la polymérase en temps réel (qRT-PCR) de gènes de rôles bien connus dans la prolifération des cellules endothéliales, la formation et/ou la perméabilité vasculaire. Une analyse protéomique a également été réalisée à l'aide de la spectrométrie de masse après exposition de cellules endothéliales de la thèque à BMP4 pendant 48h. Les résultats montrent que BMP4 et TGFβ1 régulent les gènes liés à la fonction endothéliale, incluant le facteur de croissance des fibroblastes 18 et l’endothéline-1. L'analyse par spectrométrie de masse a identifié 1488 protéines totales dont 28 protéines sont significativement régulées positivement (> 2 fois) et 29 protéines régulées négativement (<0,5 fois). L’analyse de l’interactome, réalisée à partir de deux bases de données biochimiques et biologiques distinctes, a mis en évidence un degré élevé d’interactions génétiques et physiques entre les voies de signalisation TIMP1, JUN, STAT3 et CD63. Ces observations ont été validées par une analyse par STRING. En conclusion, ces résultats montrent que l'administration exogène de BMP4 ou de TGFβ1 induit des modifications du protéome de la cellule endothéliale de la thèque chez l'ovin. Cependant, la présente étude ne portait que sur des changements d'expression des gènes liés à la fonction endothéliale. Des travaux additionnels seront nécessaires afin d’évaluer le transcriptome, grâce au séquençage d’ARN des cellules endothéliales primaires de
4
la thèque ovine pour identifier d'autres gènes susceptibles d'être régulés par la signalisation du TGF.
Mots-clés: facteur de croissance transformant β, ovaire ovin, cellules endothéliales, facteur de croissance fibroblastique de type 18, protéine osseuse morphogénétique.
5 ABSTRACT
This study was performed to investigate the effects of BMP4 and TGFβ1 on ovine thecal endothelial cell gene and protein expression. Ovine ovaries were obtained from adult ewes irrespective of stage of estrous cycle, and thecal endothelial cells were isolated using pluriSelect technology, and cultured. Following exposition to BMP4 and TGFβ1 for 24h, total ribonucleic acid (RNA) was isolated for quantitative real-time polymerase chain reaction (qRT-PCR) analysis of genes with well-validated roles in endothelial cell proliferation, vascular formation and/or permeability. Proteomic analysis was also undertaken using mass spectrometry following exposure of ovine thecal endothelial cells to BMP4 for 48h. The results show that BMP4 and TGFβ1 regulated genes related to endothelial function, including fibroblast growth factor 18 and endothelin-1. Mass spectrometry analysis identified 1488 proteins in total, with significant up-regulation (>2- fold) of 28 proteins and down-regulation (<0.5-fold) of 29 proteins. Interactome analysis, by two distinct biochemical and biological databases, identified a high degree of genetic and physical interactions between TIMP1 and JUN, STAT3, CD63 signaling pathways. These observations were validated by a STRING analysis. In conclusion, the results presented herein show that exogenous administration of BMP4 or TGFβ1 induces changes in the ovine thecal endothelial cell proteome. However, the current study only involved investigation of expression changes in genes related to endothelial function. Future work assessing the transcriptome using RNA sequencing in primary ovine theca ECs is required to identify other genes that may be regulated by TGF signaling.
Key words: Transforming growth factor β, ovine ovary, endothelial cells, fibroblast growth factor 18, bone morphogenetic protein.
6 TABLE OF CONTENTS RÉSUMÉ ... 3 ABSTRACT ... 5 TABLE OF CONTENTS ... 6 LIST OF TABLES ... 8 LIST OF FIGURES ... 9 LIST OF ABBREVIATIONS ... 10 ACKNOWLEDGEMENTS ... 15 INTRODUCTION... 16
CHAPTER 1: LITERATURE REVIEW ... 18
1.1. Sheep Ovary ... 19
1.2 Oocyte... 20
1.3 Granulosa cells ... 21
1.4 Theca cells ... 22
1.5 Stromal Cells ... 23
1.6 The ovarian follicle: classification, structure and folliculogenesis ... 23
1.7 Follicular selection, dominance and atresia ... 28
1.8 Bone Morphogenetic Proteins ... 30
1.8.1 Biological functions of BMP in reproductive system ... 31
1.8.2 Structure ... 32
1.8.3 Signaling pathways of BMPs ... 33
1.8.3.1 SMAD-dependent pathways ... 33
7
1.9 Fibroblast Growth Factors ... 35
1.9.1 Biological role of FGF Signaling Pathways in Reproduction ... 36
1.9.2 FGF Signaling Pathways ... 38
2. HYPOTHESIS AND OBJECTIVES ... 41
2.1 Hypothesis ... 41
2.2 Objectives... 41
CHAPTER 2: MATERIALS AND METHODS ... 42
2. MATERIALS AND METHODS ... 43
2.1 Cell Culture ... 43
2.1.1 Experimental treatments ... 43
2.2 Mass spectrometry ... 44
2.3 Total RNA extraction and RT-PCR ... 46
2.4 Statistical Analysis ... 46
CHAPTER 3: RESULTS ... 48
3.1 Effect of BMP4 and TGFβ1 on ovine endothelial cell gene expression……….49
3.2 Effect of BMP4 on ovine endothelial cell proteome ... 49
CHAPTER 4: DISCUSSION & CONCLUSION ... 56
DISCUSSION. ... 57
CONCLUSION ... 60
BIBLIOGRAPHY ... 61
REFERENCES ... 62
8
LIST OF TABLES
Table 1. Primer sequences used for real-time PCR ... 47 Table 2. List of the top three up-regulated proteins on ovine theca endothelial cells following BMP4 treatment ... 53 Table 3. List of the top three down-regulated proteins on ovine theca endothelial cells following BMP4 reatment ... 53
9
LIST OF FIGURES Figure 1. Stages of ovine ovarian follicular development ... 24
Figure 2. Schematic representation of a pre-ovulatory mammalian follicle ... 27
Figure 3. BMP signalling pathways ... 34
Figure 4. The fibroblast growth factor (FGF) signaling pathway ... 40
Figure 5. Dose-dependent effects of (A-D) BMP4 and (E-H) TGF-β1 on (A and E) ET-1, (B and F) VEGFa, (C and G) VEGFb and (D and H) VEGFc mRNA expression changes in ovine theca endothelial cells ... 50
Figure 6. Dose-dependent effects of BMP4 (A-E) and TGF-β1 (F-J) on VEGFd (A and F), MMP9 (B and G), IGFBP3 (C and H), BMP4 (D and I) and FGF18 (E and J) mRNA abundance in ovine theca endothelial cells ... ...51
Figure 7. Biological function of proteins identified by mass spectrometry ... ..54
Figure 8. Interactome analysis network. (A) Complete mapping of the Interactome Networks. (B) protein-protein interaction network maps using a distinct database (STRING) ... ..55
10 LIST OF ABBREVIATIONS Actc1 ActR-1A ActR2 ActR2B AKAP3 ATF BCL2L13 BMPR-1A or ALK3 BMPR-1B or ALK6 BMPR2 BMPs BRAM1 BSA CBP CGCs DAG DBN1 DNA E1A ECs ED ERK
Actin, Alpha, Cardiac Muscle 1 Type 1A activin receptor Type 2 activin receptor Type 2B activin receptor A-kinase anchoring protein 3 Activating transcription factor B cell lymphoma 2 like 13 Type 1A BMP receptor Type 1B BMP receptor Type 2 BMP receptor
Bone morphogenetic proteins
Bone morphogenetic protein receptor associated molecule 1 Bovine serum albumin
CREB-binding protein Cumulus granulosa cells Diacylglycerol Drebrin 1 Deoxyribonucleic acid Early region 1A Endothelial cells Embryonic day
11 ESI FBLN1 FGF FGFRs FRS2α FSH FWHM GAB1 GCs GDF GDF-9 GDNFs GNB4 GPX7 GRB2 GREL GS hESCs Hoxc HPLC HRAM HSD3B IGF-1 Electrospray ionization Fibulin-1
Fibroblast growth factors FGF receptors
FGFR substrate 2α
Follicle-stimulating hormone Full width at half maximum
GRB2-associated binding protein 1 Granulosa cells
Growth differentiation factors Growth differentiation factor-9 Glial derived neurotrophic factors G protein subunit beta 4
Glutathione peroxidase
Guanine nucleotide exchange factor 2 Gonadal ridge epithelial-like
Glycine-serine
human embryonic stem cells Homeobox gene c
High performance liquid chromatography High-resolution and accurate-mass
3β-hydroxysteroid dehydrogenase Insulin-like growth factor I
12 IGFBP6 IGFBP7 IP3 iPSCs JNK KGF LAP3 LH LHCGR LIF LMNB@ MAPK MARCKSL1 MGCs MKP1 MS MSG NF-κB NGF OAZ PBS PCSK PEBP
Insulin like growth factor binding protein 6 Insulin-like growth factor-binding protein-7 Inositol triphosphate
induced pluoripotent stem cells C-jun N-terminal kinase
Keratinocyte-growth factor Leucine aminopeptidase 3 Luteinizing hormone
luteinizing hormone/choriogonadotropin receptor leukemia inhibitory factor
Lamin B2
Mitogen activated protein kinase MARCKS like 1
Mural granulosa cells MAP kinase phosphatase Mass spectrometry
Melanocyte-specific gene or mad-supporting gene Nuclear factor kappa beta
Nerve growth factors
Olf1/EBF associated zinc finger Phosphate-buffered saline
Proprotein convertase subtilisin/kexin Polyomavirus-enhancer-binding protein
13 PGCs PHB2 PI3 PIP2 PKC PLCγ PTB RNA R-SMAD SCF SH2 SHP2 SIP SNIP SOS SSXS STAT3 TAB1 TAK1 TBCB TCs TFA TFE
Primordial germ cells Prohibitin 2 Phosphoinositide 3 Phosphatidylinositol (4,5)-bisphosphate Protein kinase C Phospholipase C gamma Phosphotyrosine binding Ribonucleic acid Receptor-regulated SMADs Stem cell factor
Src homology-2 Tyrosine phosphatase Smad-interacting protein
Smad nuclear interacting protein Son of sevenless
C-terminal Ser-Ser-X-Ser
Signal transducers and activators of transcription TAK1 binding protein
TGF-β activated kinase 1 Tubulin folding cofactor B Theca cells
Trifluoroacetic acid Transcription factor μ E3
14 TGFBI TGF- β TGM2 TIMP1 TMOD VEZF1 XIAP
Transforming growth factor beta induced transforming growth factor-β
Transglutaminase 2
Metalloproteinase inhibitor 1 Tropomodulin
Vascular endothelial zinc finger 1 X-linked inhibitor of apoptosis protein
16
ACKNOWLEDGEMENTS
I would never have been able to finish my Masters without the guidance of my supervisor, my co-supervisor, help from friends, and support from my family and my wife.
First and foremost, I want to gratefully acknowledge my supervisor Christopher Price for all his support, kindness, encouragement and confidence that he bestows upon me. I would also like to thank my Brazilian coach Gustavo Zamberlam for his excellent guidance, caring, patience and his kindness.
I want to express my deeply-felt thanks to Dr Francis Beaudry for his support and his help by doing mass spectrometry for our samples. I would like to thank to my lab mates: Anthony Estienne for all his knowledge, time and all his lessons. I am also very grateful with Lauriane Relav for all her skills and technical help. I would also like to thank to all CRRF members for their help and assistance.
Finally, and most importantly I would like to thank my parents for their unconditional support, love and advice, to my brothers and sisters for encouraging me spiritually throughout all my life and to my friends back in Libya for all the positive vibes.
16 INTRODUCTION
The development of the ovarian follicle is a highly complex process that involves physiological actions of multiple endocrine and paracrine signaling pathways (Price 2016). The role of the pituitary gonadotrophins, the main endocrine drivers, in various stages of follicular development is well-established (Price 2016). Indeed, the current methods available to regulate ovarian function in order to suppress or enhance fertility ultimately influence the hypothalamic–pituitary–ovarian axis (Apter 1997). In recent years, considerable attention has been focused on the paracrine signaling pathways between the oocyte and its adjacent somatic cells, namely the cumulus, granulosa and thecal cells. In specific, it has become increasingly evident that intraovarian growth factors, such as the members of transforming growth factor (TGF)-β super family, have potential roles as local regulators of ovarian function and fertility (Juengel and McNatty 2005).
The TGF-β superfamily is a structurally conserved, but functionally diverse, group of proteins with at least 35 members in vertebrates, and regulates a variety of biological processes in mammals by influencing cell proliferation, growth, differentiation, and apoptosis (Pangas 2007). The members of this TGF-β superfamily have been further classified into several subfamilies, including the TGF-β, bone morphogenetic protein (BMP), the growth and differentiation factor (GDF), the activin/inhibin, the glial cell-derived neurotrophic factor (GDNF), as well as the anti-Mullerian hormone (AMH) and nodal (Knight and Glister 2006). Research over the past two decades has revealed extremely important oocyte-derived paracrine (and possibly autocrine) roles for GDF9, BMP15 and BMP6 in the regulation of
17
oocyte maturation and cumulus and granulosa cell function (Knight and Glister 2006).
Previous work in our laboratory has shown a pro-apoptotic role for fibroblast growth factor (FGF)-18 in bovine granulosa cells (Portela et al. 2010, Portela et al. 2015). Furthermore, recent immunohistochemical studies have identified FGF18 protein in the small blood vessels of theca layer and the medulla of sheep ovary, and FGF18 messenger RNA (mRNA) and protein in ovine thecal endothelial cells following bone morphogenetic protein (BMP)-4 treatment in vitro (unpublished data). These data suggest a plausible crosstalk signaling between the endothelial cells and the theca and/or granulosa cells. This study was performed to investigate the effects of BMP4 and TGFβ1 on ovine thecal endothelial cell gene and protein expression. Recognition of the central role of intraovarian growth factors in controlling the follicular development and ovulation rate may lead to a paradigm shift in our understanding of the ovarian function. In addition, this information may form the basis for the development of new therapeutics for regulating fertility in mammals.
18
19 1. Literature Review
1.1. Sheep Ovary
The ovaries are the female gonads that are located in the pelvic area of the ewe’s reproductive system (Bartlewski et al. 2011). The ovarian development begins with the differentiation of gonadal ridge epithelial-like (GREL) cells from mesonephric epithelial cells (Smith et al. 2014). The primordial germ cells (PGCs) migrate from the endoderm of the yolk sac, through the developing hindgut and dorsal mesentery, to the developing gonads. This migration of the PGCs has been established to occur between embryonic day (ED) 17 to 21 in the ewe (Ledda et al. 2010). The ovary is apparent as a thickening of the coelomic epithelium on the medial aspect of the mesonephros around ED 22 in sheep (Smith et al. 2014). The gonadal primordia form a paired thickening of the coelomic epithelium and arise within the intermediate mesoderm between the pronephros (initial kidney) and metanephros (the definitive kidney) between ED 34– 38 in sheep (Oktem and Oktay 2008a, Smith et al. 2014).
Follicles are the functional units of the ovary and each follicle consists of an oocyte (germ cells) surrounded by one or more layers of somatic cells, viz. granulosa, theca and stromal cells. The complex cascade of interactions between these cells regulate the formation of follicles and development of oocytes/somatic cells (Richards and Pangas 2010). The two primary reproductive functions of the ovary include gametogenesis and endocrine function (Barnett et al. 2006). Gametogenesis is the process responsible for the differentiation and release of a mature oocyte for fertilization (Barnett et al. 2006). The endocrine role involves ovarian hormonal and growth factors production which is essential for follicle development, and maintenance of estrous cycle and the normal function of the reproductive tract (Barnett et al. 2006).
20 1.2 Oocyte
The oocyte is the female germ cell that is produced in the ovary by the process of female gametogenesis (Sigel and Minier 2005). Prior to fertilization, the number of oocytes in the mammalian ovary is fixed early in life. The development of an oocyte begins with the transformation of the PGCs to oogonia (Voronina and Wessel 2003). The oogonia subsequently differentiate into primary oocytes, through meiosis by replicating their deoxyribonucleic acid (DNA), and arrests at the diplotene stage of the first prophase with homologous chromosomes (Matova and Cooley 2001). Thus, at birth all oocytes are arrested in the stage of prophase I. The prophase oocyte then may spend various periods of time in the arrested state until puberty and the onset of follicle development (Voronina and Wessel 2003). In this protracted period, the oocyte accumulates an extensive collection of ribonucleic acid (RNAs), proteins, and organelles such as cortical granules, ribosomes, and mitochondria (Liu 2011, Conner et al. 1997).
Meiosis resumes in preovulatory follicles in response to a surge of luteinizing hormone (LH) from the pituitary gland, which ultimately induces rupture of the follicle, release of the oocyte and oocyte maturation (Mehlmann 2005). Oocyte maturation is a dynamic and highly coordinated process, in which the oocytes finish the first meiotic division, undergoes cytoplasmic alteration and progress to metaphase II (Mehlmann 2005). The first meiotic division ends with the emergence of two haploid cells, the oocyte and the first polar body (Mehlmann 2005). Subsequently, the oocytes become arrested at metaphase II and await the process of fertilization. The development and maturation of oocytes are tightly regulated by actions of several growth hormones (reviewed in detail elsewhere (Voronina and Wessel 2003, Smith et al. 2014, Webb et al. 2016)).
21 1.3 Granulosa cells
The granulosa cells (GCs) are vital for oocyte maturation as they provide nutrients that support further development (Albertini et al. 2001). During folliculogenesis, the GC layer separates into two anatomically and phenotypically different subtypes, the cumulus granulosa cells (CGCs) and the mural granulosa cells (MGCs) (Mcnatty et al. 1979). The CGCs are in direct contact with the oocyte, have a high rate of proliferation, low steroidogenic capacity, low or absent luteinizing hormone (LH) receptor (LHCGR) expression and express high levels of insulin-like growth factor I (IGF-1) (Makabe et al. 2006, Gilchrist et al. 2004). In contrast, the MGCs have a primary endocrine function and support follicular growth, and undergo terminal differentiation to luteal cells following ovulation (Makabe et al. 2006, Gilchrist et al. 2004).
The interaction between oocytes and CGCs, via gap junctions containing connexins 32, 43 and 45 (Gilchrist et al. 2004), is essential for normal growth and development of both the oocyte and the follicles, and plays a key role in disseminating local and endocrine signals (Gilchrist et al. 2004). Small molecules, such as ions, metabolites, and amino acids, are transported via the gap junctions, whereas larger molecules are transported by receptor-mediated endocytosis (Gilchrist et al. 2004, Senbon et al. 2003). Specifically, connexin 43 has been demonstrated to be essential for continued follicular growth and GC proliferation (Ackert et al. 2001). Indeed, mutations in the gene encoding connexin 43 leads to retarded oocyte growth and poor development of the zona pellucida (Ackert et al. 2001). The GCs produce sex steroids and numerous growth factors that interact with the oocyte during its development. The sex steroid production consists of the conversion of androgens produced by theca cells to estradiol by the aromatase enzyme (CYP19A1) under the
22
control of follicle- stimulating hormone (FSH) (Gilchrist et al. 2004). However, after ovulation the GCs differentiate into luteinized cells that produce progesterone (Erickson et al. 1985).
1.4 Theca cells
The theca consists of two layers–the outer layer called the theca externa and the inner layer known as the theca interna–both of which originate from mesenchymal cells (Gougeon 1996). Theca cells (TCs) are highly differentiated with structural features characteristic of steroid- secreting cells, with abundant mitochondria, agranular endoplasmic reticulum and lipid vesicles (Magoffin 2005).
The TCs are endocrine cells that play essential roles within the ovary by producing androgens under the control of LH (Adams et al. 2008). The hyperactivity of theca cells causes infertility due to hyperandrogenism and lack of estrogen (Magoffin 2005). Androgens are required for ovarian estrogen biosynthesis, and provide structural support for the growing follicle as it progresses through various developmental stages (Hillier et al. 1994). Unlike the GC layers, the TC layers are highly vascularized and this vascularization provides the rest of the follicle with essential nutrients and endocrine hormones from the pituitary axis (Young and McNeilly 2010).
The TCs are not associated with the primordial follicle, but only appear in the early secondary stage of follicular development (Magoffin 2005). Hence, it was hypothesized that the differentiation of TCs was stimulated by chemogenic signals originating from the growing follicles. Early work proposed the involvement of small-molecular-weight proteins secreted by the GCs to stimulate the differentiation of the TCs (Magoffin and Magarelli 1995). It is now believed that intraovarian growth factors such as insulin-like growth factor (IGF)-I and/or -II, growth
23
differentiation factor-9 (GDF-9), stem cell factor (SCF), and follistatin may contribute to thecal recruitment and differentiation (Magoffin 2005, Webb et al. 2016, Smith et al. 2014).
1.5 Stromal Cells
Ovarian stroma is primarily composed of peculiar spindle-shaped stromal cells which are similar to fibroblasts and are arranged into a characteristic whorled texture or storiform pattern (Furuya, 2012). The ovarian stroma is divided into cortex and medulla. In addition to the spindle shaped cells, they also contain other cell types including the polygonal-shaped luteinized stromal cells, decidualized cells in pregnant women, endometrial stromal-type cells, smooth muscle cells, fat cells, and stromal Leydig cells (Weidner et al., 2009). The ovarian stroma surrounding the follicle differentiates into theca interna and theca externa cells. Unlike any other connective tissue, ovarian stroma is highly cellular and vascular, while the supporting fibers (both reticular fibers and ordinary collagen) are inconspicuous (Furuya, 2012). The interstitial cells of the ovarian stroma possess steroidogenic enzymes, and secrete androgens and progesterone (Weidner et al., 2009). Therefore, stromal cells of adult ovary actively contribute to the synthesis and remodeling of extracellular matrix and blood vessels (Weidner et al., 2009). In adults, the ovarian stroma demonstrates active tissue remodeling during and after ovulation.
1.6 The ovarian follicle: classification, structure and folliculogenesis
The ovarian follicles are the basic structural and functional unit of the ovary which ensures proper oocyte development and maturation (Webb et al. 2016). Folliculogenesis, the growth and development of ovarian follicles from primordial to pre-ovulatory, is a complex cascade of events dependent on interactions between the oocyte and the somatic cells (Barnett et al. 2006). The structure of mammalian ovarian follicles changes during development and is classified as primary,
24
secondary, pre-antral, antral and pre-ovulatory follicles (Figure 1) according to their size and structure (Webb et al. 2016).
Figure 1. Stages of ovine ovarian follicular development. Adapted and redrawn from Bartlewski et al (2011). Primordial follicle is an oocyte surrounded by partial or complete layer of squamous follicular cells. In intermediate/transitory state, the follicles contain both squamous and cuboidal follicular cells. Primary follicle has a single layer of cuboidal granulosa cells. Secondary follicle has two or more layers of cuboidal granulosa cells and a small number of theca cells. In pre-antral phase, the follicles have antral cavity, filled with follicular fluid, and distinctive layers of theca cells separated from granulosa cells. Antral or Graafian follicle is the last stage of follicle development. Antral follicles are larger, have more antral fluid and may contain a secondary oocyte.
25
The process of folliculogenesis is systematically controlled not only by the actions of the pituitary gonadotropins, FSH and LH, but also by other hormones and growth factors (Barnett et al. 2006). Thus, the stages of follicular development are also classified depending upon their response to gonadotropins. These include, early gonadotropin- independent (primordial to early pre-antral), gonadotropin-responsive (pre-antral to small antral) and gonadotropin-dependent (antral to large antral) stages (Webb et al. 2016).
The process of folliculogenesis begins with the recruitment of the dormant primordial follicles. However, the mechanism underlying the activation of the resting primordial follicles remains to be elucidated (Oktem and Oktay 2008b). The resting primordial follicles are formed during fetal development in ruminants, with the first set of follicles formed around 70 days of gestation in sheep (Evans 2003). It has been estimated that the lamb ovary contains ~100,000 – 200,000 follicles at birth, with 50 antral follicles present in the ovaries of an adult sheep (Land 1970, Driancourt 1991). Hence, the proportion of primordial follicles that undergo folliculogenesis and reach the antral stage is very low as most of the follicles undergo regression and atresia (Webb et al. 2016).
The transition of the quiescent primordial follicles into primary and secondary follicles involves orchestrated communication between the oocytes and the somatic cells, as well as a multitude of extra-cellular components and growth factors (Oktem and Urman 2010). These include anti-Müllerian hormone, bone morphogenetic proteins (BMPs), growth differentiation factors
26
(GDF), leukemia inhibitory factor (LIF), nerve growth factors (NGF), fibroblast growth factors (FGF) and keratinocyte-growth factor (KGF) among others (Oktem and Urman 2010, Oktem and Oktay 2008b). The primary follicles are characterized by a single layer of cuboidal granulosa cells (GCs) surrounding the oocyte, whereas secondary follicles have two or three layers of cuboidal GCs (Bartlewski et al. 2011). Importantly, it is established that FSH is not required for transition of the primordial follicles, since they do not express FSH receptors (Oktay et al. 1997, Rannikki et al. 1995).
The progression of the primary follicle to the pre-antral stage is a continuous process. The pre- antral phase is characterized by zona pellucida formation, GC proliferation, recruitment of thecal cells to the follicular basal lamina and a dramatic increase in oocyte volume (Duranthon and Renard 2001). Like the primordial follicle transition phase, the pre-antral phase is also believed to be a gonadotropin‐ independent process (Oktay et al. 1998). Further progression of the developing pre-antral follicle to antral phase is characterized by the formation of the antrum (central liquid-filled cavity) as well as increased vascularization, oocyte growth, and the formation of a fibrous layer around the theca interna (Duranthon and Renard 2001). In contrast to during the pre-antral phase, FSH becomes a critical determinant during antral follicle growth whereas subsequent follicular development is independent of FSH concentrations (Duggavathi et al. 2005). Finally, the pre-ovulatory follicle (Figure 2) consists of an oocyte surrounded by the zona pellucida, several layers of cumulus cells, an antrum, and a basal lamina that separates mural GCs from the theca cells (Smith et al. 2014).
27
Figure 2: Schematic representation of a pre-ovulatory mammalian follicle. Shown in the diagram are the various cell types of a pre-ovulatory follicle (Kase 2013).
28
The growth of ovarian follicles exhibits a distinct wave-like pattern at all stages of the breeding season and throughout seasonal anoestrus in ewes (Bartlewski et al. 2011) as well as in non- seasonal breeders including cattle and humans. There are typically 3 or 4 waves of follicle emergence per inter-ovulatory interval (Evans 2003). This characteristic pattern of follicular development has been associated with temporal fluctuations in the levels of FSH and oestradiol (Cahill and Mauleon 1980a, Webb et al. 2016). It has been estimated that the period of follicular growth from the primordial to the pre-ovulatory stage in ewes exceeds 6 months (Cahill and Mauleon 1980a). Specifically, the growth from the primordial to the early preantral stage takes about 130 days, and it takes a further 35 – 55 days to reach the pre-ovulatory stage (Cahill and Mauleon 1980b). Thus, the ovine primordial follicles undergo sequential growth and development, under the control of endocrine and paracrine factors, forming pre-ovulatory follicle containing a mature oocyte.
1.7. Follicular selection, dominance and atresia
The selection process during a follicular wave is characterized by the continued growth of a developing 'dominant' follicle and reduced growth of the subordinate follicles (Aerts and Bols 2010b, a). Although the exact mechanisms of the dominant follicular selection remain to be elucidated, it has been suggested that the selected dominant follicle exhibits increased expression of FSH receptors, luteinizing hormone/choriogonadotropin receptor (LHCGR) and 3β- hydroxysteroid dehydrogenase (HSD3B) in the GCs (Scaramuzzi et al. 2011). This in turn has been proposed to facilitate the follicle’s responsiveness to LH and survival in the face of lower FSH concentrations (Scaramuzzi et al. 2011).
29
A functionally dominant follicle has the ability to inhibit the development of other competing follicles within both ovaries while continuing to thrive itself (Fortune 1994). The dominant follicles express high oestradiol, low progesterone, and LH and FSH receptors on the GCs (Driancourt 1991). Thus, there is a marked hierarchy between the cohort of activated follicles in terms of diameter and steroid production, resulting in dominance (Driancourt 1991). Furthermore, the emergence of a follicular wave occurs only after the dominant follicle diminishes its inhibitory effect on other follicles, subsequent to an increase in FSH concentrations (Adams et al. 1992). Removal of the dominant follicle has been shown to delay the regression of the largest subordinate follicle and/or induce early emergence of the next follicle wave (Ko et al. 1991, Adams et al. 1993).
More recent work has also attributed a role for insulin growth factor (IGF) signalling system as a ‘switch’ for follicular dominance (Webb and Campbell 2007, Scaramuzzi et al. 2011). It has been hypothesized that follicular dominance arises because one follicle first acquires proteolytic activity against the IGF binding proteins-4 and -5 before its subordinate follicles, resulting an increase in free IGF and oestradiol (Scaramuzzi et al. 2011). The resultant free IGF may then amplify the effects of FSH, facilitating an increased oestradiol production and decreased circulatory FSH (Webb and Campbell 2007, Scaramuzzi et al. 2011).
The above description describes best follicle dynamics in mono-ovulatory species such as cattle and humans. In the di- and tri-ovulatory sheep, there is broad agreement that the ovulatory follicles exerts dominance over other follicles during the follicular phase (Evans et al. 2000), however, contradictory reports exists for this phenomena during the luteal phase (Evans et al.
30
2000). In sheep, follicles in a subsequent wave has been demonstrated to emerge after the largest follicle in the previous wave had stopped growing (Bartlewski et al. 1999, Evans et al. 2000).
The process of folliculogenesis is also tightly regulated by crosstalk between cell death and survival signals (Webb et al. 2016). Throughout life, there is continous depletion of the ovarian follicular reserve and only a small proportion of the primordial follicles reach the ovulatory stage, whilst the rest undergo a degenerative process called atresia (Smith et al. 2014). Generally, atresia can occur at any stage of follicular development and is accompanied by a series of changes in steroidogenesis and morphology (Smith et al. 2014). It is believed that the process of atresia is initiated by loss of growth factors such as tumour growth factor (TGF)-α or FSH, and/or expression of death factors such as Fas ligand (Barnett et al. 2006).
1.8 Bone Morphogenetic Proteins
The bone morphogenetic proteins (BMPs) are part of the transforming growth factor-β (TGF-β) superfamily of proteins, which includes TGF-βs, activins, inhibins, GDFs, glial derived neurotrophic factors (GDNFs) and anti-Müllerian hormone (Wang et al. 2014). The TGF-β superfamily members have a wide array of functions in the body including regulation of cell proliferation/apoptosis, differentiation, migration, invasion and extracellular matrix production (Wang et al. 2014).
The physiological relevance of the BMPs was first identified in the 1960s when its role in the induction of ectopic bone formation was discovered (Urist 1965). Since then, BMP-dependent signalling has been shown to play a significant role in cell growth, apoptosis and differentiation, adult tissue homeostasis (i.e., fracture repair, vascular remodeling etc.), and bone and cartilage formation (Bragdon et al. 2011). To date, over 20 members of phylogenetically conserved BMPs
31
have been identified (Lochab and Extavour 2017a). These include BMP 2/4, BMP 5/6/7/8a/8b, BMP 9/10, and BMP 12/13/14 subgroups based on phylogenetic analysis (Ali and Brazil 2014).
1.8.1 Biological functions of BMP in reproductive system
The expression of BMP system in the ruminant ovary is well-documented. The mRNA for
BMP2, BMP4, BMP6, BMP7, BMP15 have been detected in the ovaries of sheep and cattle (Souza
et al. 2003, Pierre et al. 2004, Glister et al. 2005). The expression of BMP receptors, BMPR-1A and BMPR-1B, and that of downstream signaling proteins, Smad1/2, has been reported in ovine oocytes, GCs and TCs (Souza et al. 2002, Pierre et al. 2004). The importance of BMPs in the reproductive physiology of sheep is further attested by the phenotypes of mutant ewes (FecX, FecG
and FecB) which involve mutations in BMPR genes (Souza et al. 2002, Pierre et al. 2004).
The physiological functions in the reproductive system are exerted by tissue-specific expression of members of the BMP family (Shimasaki et al. 2004). A significant role for BMP signaling in the establishment of the germ line has been well-established (McLaren 1999). Specifically, the role of BMP4 in PGC specification has been demonstrated in mice, axolotl and crickets (Donoughe et al. 2014, Johnson et al. 2003, Ying and Zhao 2001). BMP4, but not BMP7/8, has been shown to induce germ cell differentiation from human embryonic stem cells (hESCs), and promote in vitro differentiation of cultured pluripotent stem cells into PGC-like cells from human and ruminant induced pluripotent stem cells (iPSCs) (Malaver-Ortega et al. 2016, Shah et al. 2015, Kee et al. 2006).
BMP signaling pathways have been shown to promote PGC proliferation and/or migration in chickens (Whyte et al. 2015), mice (Dudley et al. 2010, Dudley et al. 2007, Ross et al. 2007, Ying
32
et al. 2001, Lawson et al. 1999, Ying et al. 2000, Lopes et al. 2004, Tremblay et al. 2001, Chang and Matzuk 2001) and fruit flies (Sato et al. 2010, Gilboa and Lehmann 2004, Deshpande et al. 2014). Several studies have shown the vital role for BMP ligands in regulation of gametogenesis and folliculogenesis in chordates, nematodes and arthropods (Lochab and Extavour 2017a). These include BMP2, BMP4, BMP6, BMP7, BMP8, and BMP15, with specialized sex-specific reproductive roles for BMP6, BMP8 and BMP15 (Sugiura et al. 2010, Ying et al. 2000, Ying et al. 2001, Yan et al. 2001). Taken together, research over the last three decades have elucidated the evolutionarily conserved role for BMPs in PGC specification, PGC proliferation, PGC migration, and gametogenesis across protostome and deuterostome lineages (reviewed in detail elsewhere (Lochab and Extavour 2017b)), indicating the vital role of BMPs in the physiology of reproductive system.
1.8.2 Structure
TGF-β superfamily members are synthesized as precursor proteins comprising an N-terminal signal peptide, a prodomain for folding and secretion, and a C-terminal mature domain (Ali and Brazil 2014). The precursors are formed in the cytoplasm as dimeric pro-protein complexes and are then cleaved by pro-protein convertases to generate the N- and C-terminal fragments (Bragdon et al. 2011, Wang et al. 2014). The proprotein convertase family is composed of nine members called proprotein convertase subtilisin/kexin (PCSK1-PCSK9). A mature BMP protein contains seven cysteine residues, six of which form intramolecular disulfide bonds, also known as cysteine knots. A seventh cysteine amino acid facilitates dimerization with another BMP monomer via a disulfide bond (Ali and Brazil 2014).
33 1.8.3 Signaling pathways of BMPs
1.8.3.1 SMAD-dependent pathways
The physiological effects of BMPs are mediated via both canonical and non-canonical pathways. In the canonical signaling pathway, the BMPs initiate the signal transduction cascade by binding to cell surface receptors and forming a heterotetrameric complex (Heldin et al. 1997). The BMPs bind to two cell-surface serine/threonine kinase receptors, TGF-β type I and type II receptors. Amongst the 7 type-I and 5 type II TGF-β receptors, the BMPs are known to bind to type 1A activin receptor (ActR-1A), type 1A BMP receptor (BMPR-1A or ALK3), type 1B BMP receptor (BMPR-1B or ALK6), type 2 activin receptor (ActR2), type 2B activin receptor (ActR2B) and type 2 BMP receptor (BMPR2) (Heldin et al. 1997, Heldin 1997).
Upon formation of heterotetrameric complex, the constitutively active type-II receptor transphosphorylates the type-I receptor at glycine-serine rich motif (Heldin 1997). This in turn allows phosphorylation of downstream substrate proteins known as the receptor- regulated SMADs (R-SMADs) at a C-terminal Ser-Ser-X-Ser (SSXS) motif (Horbelt et al. 2012). The R-SMAD family includes SMAD-1/-5/-8, the co-mediator SMAD (SMAD-4) and the inhibitory SMADs (6 and -7) (de Caestecker 2004). The BMP type-I receptors activate the canonical SMAD-1/-5/-8 group, which then associates with SMAD4. This complex translocates into the nucleus to exert functions that regulate gene expression. The inhibitory SMAD-6 and -7 regulate the feedback inhibition of the BMP signaling pathway (Heldin 1997, Heldin et al. 1997, Wang et al. 2014) (Figure 3).
34
Figure 3. BMP signalling pathways. ATF, activating transcription factor; CBP, CREB-binding protein; E1A, early region 1A; Hoxc, homeobox gene c; MSG, melanocyte-specific gene or mad- supporting gene; OAZ, Olf1/EBF associated zinc finger; PEBP, polyomavirus-enhancer-binding protein; SIP, Smad-interacting protein; SNIP, Smad nuclear interacting protein; TFE, transcription factor μ E3 (Shimasaki et al. 2004).
35 1.8.3.2 SMAD-independent signaling
The activation of the type-I BMP receptors may also activate SMAD-independent pathways such as extracellular signal-regulated kinase (ERK), mitogen activated protein kinase (MAPK), C-jun N-terminal kinase (JNK) and nuclear factor kappa beta (NF-κB) (Lochab and Extavour 2017a, Wang et al. 2014). The activation of SMAD-independent pathways is believed to be achieved though protein–protein interactions of bone morphogenetic protein receptor associated molecule 1 (BRAM1), X-linked inhibitor of apoptosis protein (XIAP), TGF-β activated kinase 1 (TAK1) or TAK1 binding protein (TAB1) with the BMP type-I receptors (Oktay et al. 1997, Ornitz and Itoh 2001). BRAM1 directly associates with the cytoplasmic tail of type-I BMP receptors to link it to TAB1 (Chung et al. 2002). On the other hand, XIAP is recruited by type-I BMP receptors to link it with TAB1–TAK1 complex (Lu et al. 2007). It has been suggested that the activation of TAK-1 leads to downstream activation of the p38 MAPK, JNK and NF-κB pathways (Lu et al. 2007).
1.9 Fibroblast Growth Factors
The FGF family consists of structurally related polypeptides involved in several physiologic processes. These include embryonic development, organogenesis, tissue maintenance, repair, regeneration and metabolism (Ornitz and Itoh 2015). At the cellular level, FGF regulates cell proliferation, survival, migration, differentiation and metabolism (Ornitz and Itoh 2015). Genetic studies in mice have shown that mutations leading to disruption of FGF signaling cause a variety of developmental disorders including dominant skeletal diseases, infertility, and cancer (Turner and Grose 2010).
36
The FGFs exert their physiological roles through binding to one of four FGF receptors (FGFRs; FGFR 1 – 4), which are highly conserved transmembrane tyrosine kinase receptors (Teven et al. 2014). Although a fifth FGF receptor (FGF receptor-like 1; FGFRL1) lacking intracellular tyrosine kinase domain was discovered, its function remains controversial and poorly understood (Steinberg et al. 2010). The FGFRs contain 3 domains–an extracellular ligand-binding domain, a transmembrane domain and an intracellular tyrosine kinase domain (Turner and Grose 2010). The extracellular region contains two or three immunoglobulin (Ig)-like domains, and a heparin- binding domain (Yan et al. 2001). Activation of the FGFRs induces dimerization and phosphorylation of specific cytoplasmic residues, resulting in activation of cytoplasmic signal transduction pathways (Teven et al. 2014).
According to current consensus, the FGF family comprises 22 genes encoding 18 secreted FGF ligands (i.e., FGF1-10 and FGF16-23) (Yun et al. 2010). Four FGF family members, FGF11, FGF12, FGF13, and FGF14, are intracellular proteins that do not bind to FGFR, and are referred to as FGF homologous factors (Yun et al. 2010). Based on phylogenetic analysis and sequence homology, the FGF family can be divided into seven subfamilies, viz. FGF1, FGF4, FGF7, FGF8, FGF9, FGF11, and FGF19, with each containing two to four members (Itoh 2007).
1.9.1 Biological role of FGF Signaling Pathways in Reproduction
The fundamental physiological roles of FGF in mitogenesis, cellular migration and differentiation, angiogenesis and wound healing have been long been recognized (Itoh et al. 2015, Krejci et al. 2016). The expression of specific members of the FGF family within the reproductive system of humans and ruminants is documented (Chaves et al. 2012). These, taken together with the
37
critical role of FGF family ligands in the formation of gonadotropin-releasing hormone system in humans, rodents and ruminants, have suggested a plausible role for FGF in reproductive physiology (Chaves et al. 2012, Miraoui et al. 2011). In further support of this notion, humans with loss-of-function mutations in FGF receptor 1 (FGFR1) and FGF8 genes develop hypogonadotropic hypogonadism, delayed puberty and hypothalamic amenorrhea (Falardeau et al. 2008).
The expression of some FGF family members in the ovary is tissue specific and others are widely expressed. In the ovary, FGFs are predominantly expressed in theca cells, and granulosa cells mostly express FGF receptors (Chaves et al. 2012). Specifically, theca cells of rodents, ruminants and humans are known to express a number FGFs, including FGF1, FGF2, FGF7, FGF10 and FGF18 (Hawkins and Matzuk 2010, Price 2016). Within the female reproductive tract, the effects of FGFs have been focused on the ovary, and the most studied one is FGF2. Functional theca-to-granulosa signaling has been suggested by the ability of FGF2 to inhibit steroidogenesis, promote GC proliferation and prevent apoptosis in GCs (Buratini and Price 2011). More recently, several studies have implicated a role for FGF8 and FGF18 in folliculogenesis, oocyte and follicle survival, steroidogenesis and corpus luteum formation (discussed in detail in (Chaves et al. 2012, Price 2016)). FGF8 at first was detected and expressed in oocytes of small and large antral follicles of adult mice ovaries (Falardeau et al. 2008). In cattle FGF8 is detected in the oocyte, TCs and GCs, and both FGF8 receptors, FGFR3c and FGFR4, are expressed within the follicle (Buratini, Teixeira, et al. 2005, Buratini, Glapinski, et al. 2005). Likewise, FGF18 has been detected in oocytes in mice, and in GCs and TCs of cattle (Buratini, Teixeira, et al. 2005, Buratini, Glapinski, et al. 2005). Both FGF8 and FGF18 have emerged as key players of mesenchymal-epithelial signaling in a variety of
38
tissues, especially during organogenesis, and in modulation of ovarian function (Falardeau et al. 2008).
Not all FGFs appear to be mitotic, as previous work in our laboratory has shown that FGF18 increases the rate of granulosa cell death by apoptosis in cattle, through a caspase-3 mediated mechanism (Portela et al. 2010, Portela et al. 2015). Further, abundance of FGF18 in the theca of atretic follicles is higher than that in healthy follicles in cattle (Portela et al. 2010, Portela et al. 2015). More recently, immunohistochemical studies localized FGF18 protein to the small blood vessels in the theca layer and in the medulla of the sheep ovary, which suggest a plausible crosstalk signaling between the endothelial cells and the TCs and/or GCs.
1.9.2 FGF Signaling Pathways
The activation of FGFR results in recruitment of specific molecules that bind to phosphorylated tyrosines of the intracellular receptor domain (Ornitz and Itoh 2001). These subsequently serve as docking sites for the recruitment of Src homology-2 (SH2) or phosphotyrosine binding (PTB) domains of adaptor or docking proteins (Yun et al. 2010). Currently, the well-understood signaling pathways of FGF include the RAS/MAPK, PI3 kinase/AKT and PLCγ pathways (Figure 4; (Yun et al. 2010)).
The RAS/MAPK pathway is a common mechanism of signal transduction in eukaryotic cells. It is composed of multiple serine/threonine kinases that react to extracellular stimuli and regulate developmental changes in organisms (Teven et al. 2014, Ornitz and Itoh 2015). As already noted, a key event in the FGF signaling pathway is phosphorylation of the tyrosine residues. This leads to recruitment of FGFR substrate 2α (FRS2α), guanine nucleotide exchange factor 2 (GRB2),
39
the son of sevenless (SOS), the tyrosine phosphatase (SHP2) and the GRB2-associated binding protein 1 (GAB1), resulting in activation of the RAS/MAPK and the PI3 kinase/AKT pathways (Ornitz and Itoh 2015). On the other hand, FGF-FGFR mediated signaling that induces a MAPK- mediated negative feedback loop, causing threonine phosphorylation of FRS2α and reduction of tyrosine phosphorylation and recruitment of GRB2, has also been documented (Lax et al. 2002).
Similar to the RAS/MAPK pathway, the phosphoinositide 3 (PI3) kinase/AKT pathway is initiated by forming an FRS2α complex and activation of FGFR by linked GAB1 protein, resulting in a complex between the p110 catalytic unit of PI3 kinase and p85 adapter protein (Lamothe et al. 2004). The phospholipase C gamma (PLCγ) binds to the phosphorylated Tyr-766 of the FGFR and results in activation of the PLCγ pathway. The activated PLCγ hydrolyzes phosphatidylinositol, generating inositol triphosphate (IP3) and diacylglycerol (DAG) (Mohammadi et al. 1991).
40
Figure 4. The fibroblast growth factor (FGF) signaling pathway (Yun et al. 2010). FGFs stimulate tyrosine phosphorylation of the docking protein FRS. This then forms the GRB2- SHP2-GAB-1 complex, resulting in activation of RAS-MAP kinase pathway and PI3 kinase/AKT pathway. In PLCγ pathway, activated PLCγ hydrolyzes phosphatidylinositol, generating IP3 and DAG. This in turn activates PKC. FRS2: fibroblast growth factor receptor substrate 2, GRB: guanine nucleotide exchange factor, SOS: son of sevenless, RAS: monomeric G-protein, RAF: kinase, MEK: kinase, MKP1: MAP kinase phosphatase, PIP2: phosphatidylinositol (4,5)-bisphosphate, IP3: inositol triphosphate, DAG: diacylglycerol, PKC: protein kinase C.
41 2. HYPOTHESIS AND OBJECTIVES 2.1 Hypothesis
As this laboratory has preliminary data to suggest that FGF18 is expressed in follicular endothelial cells, and that TGFβ family members regulate endothelial cell migration and proliferation, we hypothesize that TGFβ family members alter function of endothelial cells derived from the theca of the sheep.
2.2 Objectives
The specific objectives of this work were:
1. To determine the effect of BMP4 and TGFβ1 on ovine endothelial cell gene expression. 2. To determine the effect of BMP4 on the ovine endothelial cell proteome.
42
43 2. MATERIALS AND METHODS
2.1 Cell Culture
Ovine ovaries were obtained from adult ewes, irrespective of their estrous cycle phase, from an abattoir. The ovaries were the transported to the laboratory at 30˚C in phosphate-buffered saline (PBS) solution containing penicillin (100 μg/mL) and streptomycin (100 μg/mL). Endothelial cells were isolated from the theca layer using S-pluriBead® Maxi Reagent Kit (pluriSelect Life Science, Germany). Briefly, the surface of the follicle was cut with a scalpel blade. The theca layer was removed using forceps and collected into 10 ml of DMEM/F12 (Thermo Fisher Scientific, Burlington, Canada). The theca layer was then incubated in a solution containing collagenase (1 mg/ml; 500µl;), trypsin inhibitor (100 µl/ml; 500µl) and 4 ml of DMEM/F12 at 37°C for 45min. Subsequently, the cell suspension was centrifuged at 800g for 10 min and the resultant cell pellet was resuspended in 1 ml of DPBS. Following osmotic lysis of the red blood cells using milliQ water, the cell suspension was filtered through a 30 µm pluristrainer. The cell viability was assessed using trypan blue dye and the cells were then seeded onto 24-well tissue culture plates (Sarstedt Inc., Montreal, Canada) at a density of 0.5 million in 1 mL DMEM/F12 containing bovine serum albumin (BSA) (0.1%; Sigma-Aldrich, St. Louis, Missouri, United States). The cells were grown to ~70 – 90% confluency prior to treatments. The cell cultures were maintained at 37°C in 5% CO 2, 95% O2 for 5 days, with medium changes on days 2 and 4.
2.1.1 Experimental treatments
To determine the effects of TGFβ1 and BMP4 on endothelial cells gene expression, and the effect of BMP4 on endothelial cells gene expression and secretory activity, cells were serum-starved for 8 h and treated from day 5 with different doses of human recombinant BMP4
44
(PeproTech, Rocky Hill, US) and different doses of human recombinant TGFβ1 acquaired from the same company . While some cells were recovered 24 h post- TGFβ1 and BMP4 treatment for RNA extraction, other cells and respective media were recovered after 48 h post-BMP4 treatment for total protein extraction using RIPA buffer for mass spectrometry analysis. All experiments were performed with three different pools of cells each collected on a different occasion.
2.2 Mass spectrometry
Proteins were extracted from cell samples and bottom-up proteomic analysis was performed. The total amount of protein in each sample was determined using Bradford assay (Thermofisher, Rockford US). Briefly, a volume corresponding to 50 μg of proteins was used for each sample. Proteins were isolated using a precipitation procedure with a ratio 1:3 (v:v) of acetone. The samples were centrifuged at 9,000 g for 10 min and the acetone was discarded. The resultant protein pellet was dried for 20 min in a vacuum centrifuge set at 60˚C. The protein pellet was then dissolved in 100 μL of 50 mM ammonium bicarbonate (pH 8.0) and the solution was sonicated for 60 min at maximum intensity to improve protein dissolution. Reduction and alkylation were performed as previously described [Ruiz et al. 2015], and then 2 μg of proteomic-grade trypsin was added. The reaction was performed at 40˚C for 24 h. The protein digestion was quenched by adding 10 μL of a 2% trifluoroacetic acid (TFA) solution. Samples were centrifuged at 12 000 g for 10 min and the supernatants were transferred into injection vials for analysis.
The HPLC system was a Thermo ScientificTM UltiMateTM 3000 Rapid Separation UHPLC
system (San Jose, CA, USA). The chromatography was achieved using a gradient mobile phase in a microbore C8 column (Thermo Biobasic) with a particle size of 5μm. The initial mobile phase consisted of acetonitrile and water (both fortified with 0.1% of formic acid) at a ratio of 5:95.
45
From 0 to 1 min, the ratio was maintained at 5:95. From 1 to 61 min, a linear gradient was applied up to a ratio of 50:50 and maintained for 2 min. The mobile phase composition ratio was reverted to the initial conditions and the column was allowed to re-equilibrate for 14 min for a total run time of 77 min. The flow rate was fixed at 75 μL/min and 2 μL of sample was injected.
The Q ExactiveTM OrbitrapTM Mass Spectrometer (San Jose, CA, USA) was interfaced with
the UHPLC system using a pneumatic assisted heated electrospray ion source. MS detection was performed in positive ion mode and operating in scan mode at high-resolution, and accurate- mass (HRAM). Nitrogen was used for sheath and auxiliary gases set at 10 and 5 arbitrary units. The Electrospray ionization (ESI) voltage was set at 4000V and the ion transfer tube temperature was set at 300°C. The default scan range was set at m/z 400 -1500. Data was acquired at a resolving power of 140,000 (full width at half maximum; FWHM) using automatic gain control targets of 3.0 x 10⁶ and maximum ion injection time of 200 ms. Additionally, MS data was acquired using a
data-dependent top-10 method to dynamically choose the most abundant precursor ions from the survey scans (400–1500 Da) and generate MS/MS spectra. Instrument calibration was performed prior to all analysis and mass accuracy was notably below 1 ppm using Thermo Pierce calibration solution and automated instrument protocol.
Database surveys were performed using Proteome Discoverer software (v2.1) with Uniprot ovine protein database (extracted FASTA file). Mass tolerance of precursor and fragment (i.e. typically b and y) were set at 5 ppm and 10 ppm, respectively. Phosphorylation at Y and T amino acids was set as a variable post translational modification. Quantification was based on MS1 ion intensity and peptide identification was based on precursor ion (MS1) and at least three characteristic (MS2). Label-free MS1 quantification of peptide/protein via peak intensity was
46
performed using SIEVE (v2.1), a label-free differential expression software that aligns the MS spectra over time from different data sets and then determines structures in the data (m/z and retention time pairs) that differ. These differences were examined using Uniprot ovine protein database and then sorted based on biological function obtained from the data of each biological replicate. STRING interfaces were used to perform the interactomic analysis. In addition to STRING, GeneMANIA (http://genemania.org) was used to evidence putative interactive functional association network illustrating the relationships among genes.
2.3 Total RNA extraction and RT-PCR
Total RNA was isolated from theca cells using RNA Mini Kit (Invitrogen) according to the manufacturer's instructions. Real-time PCR was performed in a 15μl reaction volume with 2× Power SYBR Green PCR Master Mix on CFX-96 Real-Time PCR Detection System (Bio-Rad Laboratories Ltd. CA, USA). The ovine-specific primer sequences were designed as shown in Table 1. The thermal cycling conditions were 3 min at 95 °C, followed by 40 cycles of 15 s at 95 °C, 30 s at 60 °C, and 30 s at 72 °C. Melting curve analyses were performed to verify product identity. Samples were run in duplicate and the results are expressed relative to the geometric mean of three housekeeping genes (RPL19, YWHAZ and SDHA). Data were normalized to a calibrator sample using the ΔΔCt method with correction for amplification efficiency.
2.4 Statistical Analysis
Data were tested for homogeneity of variance with Bartlett test, and log transformations were performed as appropriate. One-way ANOVA were performed with Tukey’s multiple comparisons tests, or Dunnett's compare with control, as appropriate. Culture data included culture replicate as a random variable. Data are presented as means SEM with p < 0.05 considered significant.
47 Table 1. Primer sequences used for real-time PCR
Gene symbol
Forward primer Reverse primer
Target genes
VEGFB AACACAGCCAGTGCGAATGC GTCACCTTCGCAGCTTCCG
VEGFC GTTTACAGACAAGTCCATTCAAT TGCAGACGTGGTTATTCC
VEGFD GAAGAAGATCGCTGCTCCCA ATGTGCTGACCACAGAGAGC
COX2 GATGACTGCCCAACACCCAT AAAGGCGACGGTTATGCTGT
MMP9 GCTTCTGGAGGTTCGACGTG ACGCCAGAAGAAGTGATCCTG
BMP4 TGGCTGTCAAGAATCATGGACT ACGACCATCAGCATTCGGTT
IGFBP3 CTACACGCGTTGTTGGACG GCTGTGGTCTTCTTCCGACT
ET1 AGGAAAAGAGCTCAAGGACCA TTGATGCTGTTGCTGATGGC
Housekeeping genes
RPL19 TATGGGTATAGGTAAGCGAAAG TGGCGGTCAATCTTAG
YWHAZ ACCAACACATCCTATCAGAC CTCTCAGTAACTGCATTAGC
48
49 3 RESULTS
3.1 Effect of BMP4 and TGFβ1 on ovine endothelial cell gene expression
Treatment of ovine theca endothelial cells (ECs) in culture with BMP4 or TGFβ1 altered the abundance of some but not all of the candidate target genes. Specifically, treatment of theca ECs with BMP4 caused a dose-dependent increase in the relative mRNA expressions of ET1 (Figure 5A), VEGFa (Figure 5B) and FGF18 (Figure 5C). However, treatment of the ECs with BMP4 did not significantly affect the relative mRNA expressions of VEGFb (Figure 5D), VEGFc (Figure 5E),
VEGFd (Figure 5F), MMP9 (Figure 5G), IGFBP3 (Figure 5H) or BMP4 (Figure 5I). In contrast,
treatment of theca ECs with TGFβ1 only dose-dependently increased the mRNA expression of ET1 (Figure 6A) but did not significantly affect the relative mRNA expressions of VEGFa (Figure 6B),
FGF18 (Figure 6C), VEGFb (Figure 6D), VEGFc (Figure 6E), VEGFd (Figure 6F), MMP9 (Figure
6G), IGFBP3 (Figure 6H) or BMP4 (Figure 6I).
3.2 Effect of BMP4 on ovine endothelial cell proteome
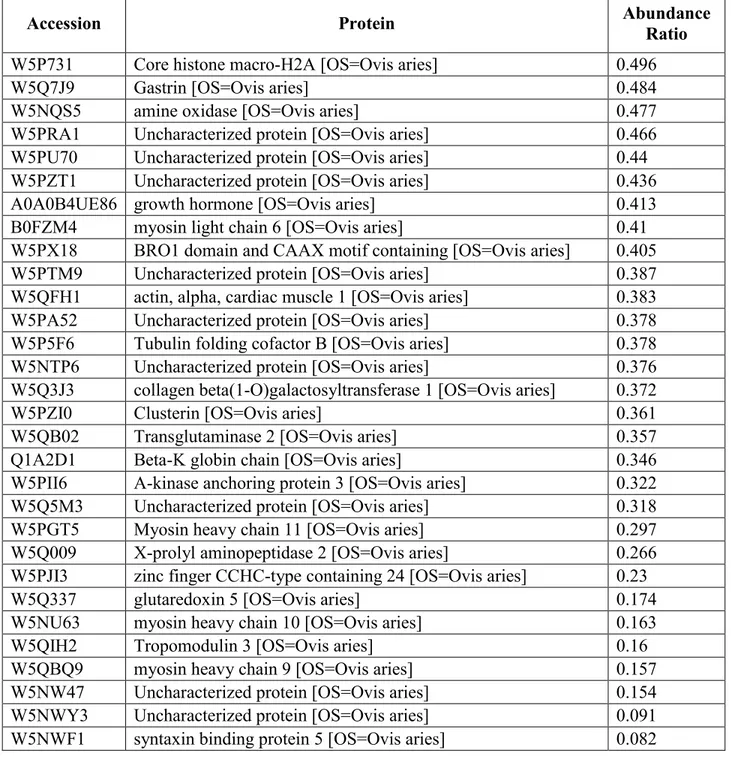
Overall, 1488 proteins were identified by mass spectrometry in ovine theca ECs in both treated and non-treated group. Treatment of ECs with BMP4 resulted in an increased expression (>2-fold) of 28 proteins (Appendix A; Table 1) and decreased expression (<0.5-fold) of 29 proteins (Appendix A; Table 2). There were also 31 proteins that were slightly up-regulated (1.5 – 2-fold; Appendix A; Table 3) and 52 proteins that were slightly down-regulated (0.5 – 0.67-fold;
Appendix A; Table 4). The three most significantly up-regulated and down-regulated proteins are given in Table 2 and Table 3, respectively. These proteins have well-characterized roles in
50
Figure 5. Dose-dependent effects of BMP4 on (A) ET1, (B) VEGFa, (C) FGF18, (D) VEGFb (E) VEGFc, (F) VEGFd, (G)
MMP9, (H) IGFBP3 and (I) BMP4 mRNA levels in ovine theca endothelial cells. *p<0.05 (One-way ANOVA; posthoc:
Dunnett); *n.d. – not determined.
52
Figure 6. Dose-dependent effects of TGFβ1 on (A) ET1, (B) VEGFa, (C) FGF18, (D) VEGFb (E) VEGFc, (F) VEGFd, (G)
MMP9, (H) IGFBP3 and (I) BMP4 mRNA levels in ovine theca endothelial cells. *p<0.05 (One-way ANOVA; posthoc:
Dunnett); *n.d. – not determined.
53
Table 2. List of the top three up-regulated proteins in ovine theca endothelial cells following BMP4 treatment.
Protein Accession
Abundance Ratio Aldehyde dehydrogenase 6 family member A1
[OS=Ovis aries] W5NS43 100
Bone morphogenetic protein 4 [OS=Ovis aries] A8VTF8 100 NADH dehydrogenase [ubiquinone] 1 beta
subcomplex subunit 8, mitochondrial [OS=Ovis aries] D5M8S1 100
Table 3. List of the top three down-regulated proteins in ovine theca endothelial cells following BMP4 treatment.
Protein Accession
Abundance Ratio Core histone macro-H2A [OS=Ovis aries] W5P731 0.496
Gastrin [OS=Ovis aries] W5Q7J9 0.484
54
The proteins that showed significant fold changes were also classified according to their biological processes (Figure 7).
Figure 7. Biological function of proteins identified by mass spectrometry.
Although TIMP1 was not upregulated by more than 1.5-fold, interactome analysis of the differentially expressed proteins identified a high degree of genetic and physical interactions between TIMP1 and JUN, STAT3, CD63 signaling pathways following the exposition of endothelial cell to BMP4 for 48h (Figure 8A). This observation was also validated with a STRING analysis (i.e. predicted protein–protein interactions) in Figure 8B.
55
Figure 8. Interactome analysis network. (A) Complete mapping of the Interactome Networks. (B) protein-protein interaction network maps using a distinct database (STRING).
56
57 4 DISCUSSION
The present study investigated the effects of TGFβ1 on ovine endothelial cell (EC) gene expression, and BMP4 on EC gene expression and protein secretion. The findings of the present study demonstrate that exogenous administration of TGFβ1 and BMP4 induced expression of endothelin-1 (ET-1) in ovine theca ECs. BMP4, but not TGFβ1, also significantly increased the expression of VEGF and FGF18. Proteomic analysis performed following 48h incubation of ovine theca ECs with BMP4 identified significant up-regulation (>2-fold) of 28 proteins and significant down-regulation (<0.5-fold) of 29 proteins. To the best of our knowledge, this is the first study that elucidates the effect of BMP4 and/or TGF-β1 on gene expression and proteome in primary ruminant theca ECs.
In this study, TGFβ1 stimulated the abundance of ET1 mRNA, as has been previously demonstrated in human pulmonary artery endothelial cells (Park et al. 2012, Star et al. 2009), and we also demonstrate that BMP4 also stimulated ET1 mRNA levels, which has not been previously reported. Other genes important for endothelial cell proliferation, vascular formation and/or permeability include VEGFa/b/c/d, MMP9, FGF18 and IGFBP3 (Datta et al. 2004, Rizov et al. 2017; Rossi et al. 2016), and these genes are regulated by TGFβ1 in human cancer cells and endothelial cells (Laulan and St-Pierre 2015, Genersch et al. 2000, Rossi et al. 2016), however in the present study only VEGFa and FGF18 mRNA levels were altered by BMP4. This growth factor has been shown to increase VEGFa mRNA levels in ruminant theca/granulosa cells and neuroblastoma cells (Nichols et al. 2019, HaDuong et al. 2015). The inability of TGFβ1/BMP4 to upregulate angiogenic genes in this study may be owing to the use of primary EC from the follicle, which likely exhibit different properties compared with cell lines.