THERMOSENSITIVE COATING DEDICATED TO SMART TPS FOR VERY HIGH
TEMPERATURE - 850 °C TO 1650°C
E. Copin(1), T. Sentenac(1), E. Mondou(2) L. Martinez(2)
(1) Institut Clément Ader (ICA) ; Université de Toulouse ; CNRS, IMT Mines Albi, INSA,
ISAE-SUPAERO, UPS; (Campus Jarlard, F-81013 Albi, France)
(2) NDT°physics, 23 boulevard Marcel Sembat, 69200 Vénissieux, France
ABSTRACTThis paper presents the recent development of a new thermosensitive coating and its associated reading device, which allows to determine thermal history in the 850°C-1650°C temperature range, providing access to a new easy way to detect hot spot on smart Thermal Protection System with a much better thermal resolution than commercially available thermochromic paints. This technology is suitable to be rapidly integrated on re-usable launcher or vehicle parts as a paint on the thermostructural surfaces or inside small machined cavities. A new device dedicated to detection of overheated zones in the overall range of temperatures achieved in the whole Thermal Protection System (from CMCs to Metallics) is presented, thus promising a considerable reduction in the effort required for post-flight inspection.
Index Terms— TPS, thermal history mapping, luminescence
1. INTRODUCTION
A Thermal Protection System (TPS) is an important system of each space vehicle that must be operated in a high temperature and harsh environment. The main functions of a TPS are:
- To limit the heat load transmitted to both non-pressurized structures such as wings, or non-pressurized structures such as tanks, so that the temperature of these structures remains within the acceptable range during the whole mission.
- To resist to the aerothermal fluxes.
- To ensure the external aerodynamic shape of the vehicle. As soon as the harsh environment conditions cease, the TPS would be able to come back to its original status [1,2], to be once more fully operational for the next operating cycle. Information about temperatures achieved by a TPS structure, also called thermal mapping, is of major importance in applications where temperature is a relevant and limiting factor for design. Due to the severe conditions to which is exposed the TPS tile’s surface, inspection of the operating conditions, once the re-usable launcher or vehicle has landed, could bring relevant information on the real behavior of the protective system.
Luminescent thermosensitive thin films or thermal mapping coatings for high temperature applications are based on the
application of a coating, or sensitive paint, which sees its luminescence properties undergoing permanent changes with temperature and time of exposure in the operating range of TPS, allowing to record thermal history [3]. Offline characterization of these luminescence properties can thus provide information on the maximum temperature at which the coating was exposed during a known past thermal event. This interesting concept make it possible to detect overheated zones in the overall range of temperatures achieved in the whole TPS (from CMCs to Metallics) after an operating cycle, therefore promising a considerable reduction in the effort required for post-flight inspection.
Technology Readiness Level 4 was achieved for the thermal mapping technology during a previous test campaign for space applications in 2006 with a first version of a luminescent marker [4], for which the underlying mechanism is the thermally activated diffusion of dopant species inside an inorganic matrix, which modifies permanently the optical properties of the material. An improved version of this thermosensitive paint was recently developed, which combines two photoluminescent markers, one of them being thermosensitive while the other one is not. The use of the latter as a reference allows to increase the robustness of the method regarding the influence of several parameters such as observation conditions, thickness variations, and surface contamination of the coating, with regard to the determination of the real value of temperature reached by the coating during temperature exposure from the interpretation of the photoluminescence signal.
This work presents the recent developments on this thermosensitive paint (2017-2019), which result from a recent close collaboration between the Institut Clément Ader (ICA) and the company NDT°physics, with backing from IMT Mines Albi incubator. The results presented hereafter deal with the upgrade of the initial thermal mapping technology solution, which was qualified to determine thermal history in the 850°C-1650°C temperature range in 2006, for a higher robustness regarding measurement conditions, thanks to the use of a more robust reading device which will combine both lifetime and intensity ratio approaches. This work will be the basis for the development of a mobile and compact design of a testing device dedicated to hot spot detection on smart TPS, which will be available at the end of 2019.
2. CHALLENGES AROUND TPS CONCEPT Generally, TPS consists of an insulating cover that attaches to the vehicle’s load bearing structure either directly or with joints. Coverings can be either flexible blankets or shaped tiles made of metals, ceramics or ceramic matrix composites in accordance to the temperature range in which they operate. The most important aspect to consider, after materials’ properties, is the life cycle cost. Life cycle cost is a function of area and weight along the whole life of the component, including maintaining, repairing, inspection, etc...
2.1. Smart TPS coated with luminescent thermosensitive thin films: TRL4 was achieved
Thirteen years ago, ESA launched an exploratory study on Smart TPS for future re-entry vehicles, which led to ESA/ESTEC Contract n º 17799/04/NL/PA [4]. Inasmet-Tecnalia, EADS ST and ALTA SPA were the main subcontractor during 2006 qualification and campaign test in order to study different Smart TPS concepts and to select the most promising ones. With regards to several cross criteria as mass, cost, maintainability, safety, improvement, maturity and development risks, three main technologies were selected at that point in order of usefulness [5]:
- Temperature sensitive luminescent paints, also named thermal mapping concept was ranked first.
- Piezo-electric technology for damage detection and control on ground.
- Phase change materials.
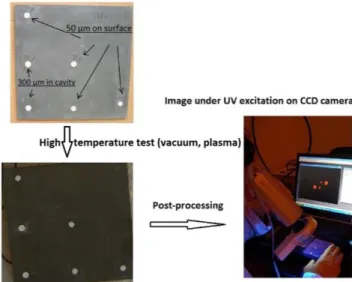
Figure 1 illustrate the qualification of the thermal mapping concept on PM2000 sheets (100x100x2mm3). Tiles were
coated in some areas with the sensitive paint, containing one thermographic material producing luminescence emissions in the visible range of the spectrum. After a high temperature test (here, with the plate subjected to a plasma in a vacuum environment), the luminescence intensity of the coatings is evaluated off-line at room temperature to derive the maximum temperature experienced by the material.
The thermal mapping concept was put in application on rocket nozzle engine during qualification runs for ARIANE 5 ECA launcher. In total, 24 runs on thermostructural component as Nickel alloy or thermal barrier coating (ZrO2-
8%Y2O3) coated with this specific temperature sensitive
luminescent paint were successfully performed during the 2003-2004 period. In the same manner, C/SiC shingle covered by thermal paint were tested later in 2007 during CNES/ASTRIUM/SAFRAN qualification run.
The thermal mapping concept was extensively tested in several conditions (maximum temperature at various thermal cycling, long duration plasma erosion), showing that:
Figure 1: thermal mapping measurement on a PM2000 plate covered by small dots of luminescent thermosensitive
paint (single thermographic phosphor) using
photoluminescence intensity measurement method.
• The paint provides accurate and repeatable measurement in vacuum and atmosphere.
• The optimal size of the dots to be used can be considered of 5 mm in diameter.
• If no pollution event takes place at high temperature during re-entry, the optimal configuration consists in depositing the paint directly deposited on the surface of the TPS (50 µm thickness), considering the deposition process, adherence and general roughness points of view.
• If some pollution event takes place at high temperature during re-entry, the optimal configuration consists in filling 300 µm deep cavities with thermal paint. Indeed, the greater thickness of thermal paint makes a cleaning with an abrasive paper possible.
• The measured temperatures are typically within a ±10 °C accuracy range for temperatures close to 1000 °C, with a typical difference of ±2 °C from the thermocouple measurement in calibration runs.
2.2. Opportunities to make further progress around thermal mapping technology
Although the level TRL 4 was reached, the thermal mapping concept developed suffered from some limitations. Part of these limitations came from the use of an intensity-based method on coatings containing a single temperature sensitive luminescent marker, which required the use of relatively complex procedures and post-processing to ensure the robustness of the measurements regarding the observation conditions. This intensified the effects of the two main critical
influencing factors on the real maximum reached temperature which were identified:
- A large pollution during re-entry phase may undermines subsequent determination of the maximum temperature reached (post-processing),
- Heat-sensitive paint thicknesses must be finely controlled.
The purpose of the current work was therefore to improve the robustness of the concept, by improving both the coating and the measurement chain. This was done by modifying the composition of the coating (addition of a luminescent temperature-insensitive reference) and the combination of an intensity based method and a temporal based method for the characterization of the luminescence properties (lifetime analysis), the latter being by nature less sensitive to the conditions of observation and already widely used in the aeronautic field [6,7].
3. NEW TEMPERATURE SENSITIVE COATING FOR DETERMINING THERMAL HISTORY OF TPS 3.1. State of the art
In systems operating at high temperature and in harsh environment, it is crucial to be able to determine the maximum temperature at which are exposed the components. Thermal history paints are currently the main solution for thermal mapping of hot spots on components in systems where standard in-situ methods for measuring temperature, such as thermocouples or IR thermography are not suitable due to their intrusiveness and/or the difficulty to access the area of interest during operations. Thermal paints are simply applied on the surface to monitor prior to the test of the system under known conditions, and the maximum temperature at which the component was exposed is later derived from the off-line characterization of some physical properties of the coating, in most cases color changes (thermochromic paints). In the case of photoluminescent thermal history paints, temperature maps are derived from the permanent changes in the luminescence emission parameters of the coating.
Inorganic photoluminescent materials, or phosphors, are materials composed of a small quantity of luminescent centers (transition metal ions or lanthanide ions) dispersed in an inorganic matrix. When excited by photons of appropriate energy from an incoming radiation in the visible or UV range, electrons from the electronic configuration of the luminescent centers are promoted to higher states of energy. During the de-excitation process, part of this energy is released in the form of photons, producing luminescence emission lines in the visible range of the spectrum.
Photoluminescent thermal history coatings rely on the fact that many thermo-activated chemical and physical transformations occurring within phosphors at high temperature can permanently modify the spectral (intensity, shape and position of the emission lines) and the temporal (luminescence decay time) characteristics of luminescence emissions. These changes can be used to monitor the maximum temperature of exposure during a past thermal event under known conditions (e.g. operation of an engine under cruising stationary conditions). The main advantage of this type of thermal history coatings over standard thermochromic paints is their higher thermal resolution, in general well below 10°C: contrary to discrete color changes, changes in luminescence properties are in most cases continuous, allowing to record temperature spectrum rather than temperature threshold. Furthermore, luminescence properties can be easily measured quantitatively using standard photosensitive equipment [8].
3.2 New bi-phosphor thermal history sensitive paint The first version of the thermal paint contained a single thermosensitive phosphor made of an inorganic matrix bonded to the surface by an inorganic, non-reactive binder. Initially, the phosphor is in the form of particles coated with a transition metal complex agent. Its thermal history sensing capability comes from the thermo-activated diffusion of the transition metal ions within the host matrix that causes significant increase of the luminescence intensity of its emission line in the red end of the visible spectrum (694 nm) over the 850°C-1500°C range. The degradation of the binder at 1650°C also provided an additional temperature threshold for the detection of hot spots. However, the use of a single phosphor necessitated to work with absolute intensities for determining temperature, hence great care and extensive post-processing were required to ensure the robustness of the measurement regarding experimental conditions, mostly related to the excitation source, the sample and the detection system (conditions of observation, thickness inhomogeneity, pollution etc.).
In order to overcome the dependency of absolute intensities over experimental factors, a typical intensity ratio approach [7,9] was proposed for a new version of the thermal paint. This new version includes a second phosphor, made of a different host matrix doped with a small amount of lanthanide ions Eu3+
, which exhibits emission lines little sensitive to
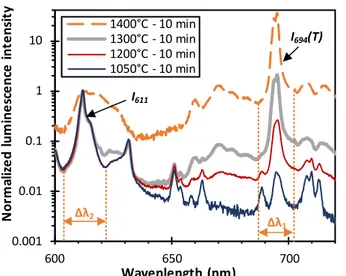
temperature for short time exposure in the investigated temperature range, and spectrally distinct from the sensitive phosphor (611 nm). The luminescence spectra in Figure 2 illustrates the evolution of the luminescence from the new coating between 1100°C and 1400°C. A temperature sensitive parameter R(T) is defined as the ratio of the temperature sensitive emission line of the main phosphor at
Figure 2: Evolution of the luminescence spectra with temperature of the new bi-phosphor thermal history coatings for 10 min long exposure between 1050°C and 1400°C. Spectra were normalized relatively to the emission peak of the reference phosphor at 611 nm.
694 nm (I694(T)) and the relatively temperature insensitive emission line at 611 nm of the reference phosphor (I611), according to the expression given in equation (1):
𝑅(𝑇) = ∫∆𝜆1𝐼694(𝑇)⁄∫Δ𝜆2𝐼611 (1)
where ∆𝜆1 and ∆𝜆2 are the integration intervals for the line at
694 nm and 611 nm respectively (Figure 2). If the thickness is sufficiently small and the amount of covering pollution not to important, R(T) parameter should provide a robust indicator of the thermal history, i.e. it should be insensitive to small variations in most of the measurement conditions such as distance of observation, viewing angle and inhomogeneities of the illumination.
Temperature sensitive phosphor powders were prepared by pre-coating particles from a commercial host matrix powder with transition metal complexes. The powders were then mixed with a commercial Eu3+-doped reference phosphor
powder and a small quantity of binder. The resulting slurry was used to deposit at room temperature coatings (<100 µm in thickness) on 20 mm x 10 mm zirconia coupons, which were subsequently heat treated at relatively low temperature for consolidation. Afterwards, the coupons were subjected to 10 min high temperature exposure in air under isothermal conditions at different temperature between 1050°C and 1500°C, followed by air quenching. This temperature range was selected since the coating was designed for hot spot detection in TPS applications. The range 850°C-1050°C, for which the thermal paint was qualified in 2006, will not be presented here. The spectral (intensity ratio) and temporal (luminescence decay time) luminescence properties of the
coatings were then evaluated to investigate the sensitivity of the new coating formulation to thermal history. Coatings from the previous version of the thermal paint (single phosphor) were also characterized.
3.3 Sensitivity of the luminescence intensity ratio to thermal history in the range 1050°C – 1400°C (10 min temperature exposure)
Coated coupons were illuminated using frequency-doubled, continuous wave diode-pumped Nd:YAG laser irradiating at 532 nm with maximum power of 1.1 W and a beam diameter of 1.2 mm (CNI laser). Emission intensity spectra in the 400– 700 nm range were collected with a USB 2000 + spectrometer (Ocean Optics, spectral resolution of 0.15 nm) equipped with an optical fibre which collecting lens was located about 20 cm above the sample surface. A high-pass filter with a cut-off wavelength of 535 nm was also used to limit contributions from the laser beam. Measurements were repeated several times at different location of each samples. For each spectrum, the integrated emission line intensities at 694 nm
I694(T) and 611 nm I611 (T) were determined to derive the
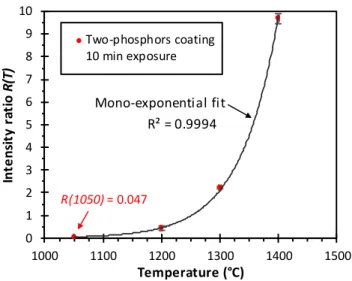
temperature sensitive ratio R(T) defined in Equation (1). Figure 3 shows the evolution of the intensity ratio R(T) with temperature for 10 min long heat treatments between 1050°C and 1400°C. It can be observed that R(T) increases steadily from 0.046 to 9.689 with increasing temperature, confirming the strong sensitivity of this new thermo-sensitive coating in the range 1050°C-1400°C (two order of magnitude increase). The sensitivity is in addition observed to increase with temperature. A fit of the experimental data points with a mono-exponential model, plotted on Figure 3 with dashed line, gives a fair approximation of the observed monotonic increase of the intensity ratio R(T) with temperature. Noise Equivalent Temperature Difference (NETD) [10] was used as a criterion for evaluating the thermal resolution of the coating and to compare the efficiency of the marker with standard thermography methods. Its expression is given by the following expression (Equation 2):
𝑁𝐸𝑇𝐷 = 𝜎𝑖
𝑆𝑇𝑖 (2)
where 𝜎𝑖 is the standard deviation of the measured intensity
ratio, related to the uncertainty of the detector (spectrometer) and 𝑆𝑇𝑖 is the absolute sensitivity around temperature Ti,
given by the following expression (Equation (3)): 𝑆𝑇𝑖 = (
𝑑𝑅 𝑑𝑇)𝑇
𝑖
(3) NETD were calculated for each experimental data point, using the analytical expression of sensitivity derived from the fit of the experimental data points with a monoexponential model. Over the range 1050°C-1400°C, NETD were found in
0.001 0.01 0.1 1 10 600 650 700 N or m al iz e d lum ine sc e nc e i nt e ns it y Wavenlength (nm) 1400°C - 10 min 1300°C - 10 min 1200°C - 10 min 1050°C - 10 min I694(T) I611 Δλ2 Δλ1
Figure 3: Calibration curve R(T) vs. Temperature for 10 min exposure of the bi-phosphor coatings between 1050°C and 1400°C. Dashed line corresponds to the fit of the experimental data points with a mono-exponential model. the range 2°C-6°C, which correspond to a much higher theoretical resolution than typical thermochromic paints (a few tens to a few hundred °C [11,12]).
It appears that the new bi-phosphor thermosensitive coating exhibits a strong sensitivity of its luminescence intensity with temperature for short time exposure heat treatment in the range 1050°C-1400°C, which make it a suitable indicator or thermal history for high temperature applications such as TPS. Notice that the results presented in Figure 3 corresponds to 10 min exposure time. For shorter or longer exposure time, the calibration curve would be simply shifted towards higher or lower temperature respectively.
The current limiting factor regarding the higher temperature sensing limit (1400°C) is the thermal stability of the reference phosphor used. Indeed, while the intensity of the thermosensitive sensor at 694 nm continues to increase exponentially up to 1500°C and higher (not shown here), phase transformation of the reference host matrix and possible interactions with the binders occurring above 1400°C cause a dramatic decrease of the emission line of Eu3+
ions at 611 nm. First signs of this transformation can be observed in Figure 2 for the coating heat treated at 1400°C, with the change of morphology of the Eu3+ emission peaks at
611 nm and 630 nm. Alternative reference phosphors with higher thermal stability will be investigated in a future work. 3.4 Sensitivity of the luminescence lifetime to thermal history in the range 1050°C – 1500°C (10 min and 2 min 30 s temperature exposure)
Luminescence lifetime corresponds to the time constant of luminescence decay when the source of excitation is turned
Figure 4: Experimental setup for luminescence lifetime measurements.
off. Like intensity, decay time can be modified by microstructural transformations at high temperature if they affect significantly radiative transition probabilities [3]. However, unlike absolute intensities, lifetime is by nature much less sensitive to the uniformity of intensity (excitation and emission), coating thickness, surface curvature, viewing angle and so on [7,9].
Fluorescence decay-time measurements were carried out on coated coupons using the experimental setup illustrated in Figure 4. Three series of coatings were used: i) new bi-phosphor coatings characterized in part 3.3 exposed for 10 min between 1050°C and 1500°C, ii) first version of coatings containing only the thermo-sensitive coating emitting at 694 nm exposed for 10 min between 1100°C and 1500°C and iii) the same but exposed 2min30s between 1200°C and 1500°C. A set of LED emitting at 520-530 nm were used to send short pulse of excitation light on the coatings. A pulse generator was used to control pulse duration (2 ms) and frequency (10 Hz). The fluorescence intensity decay after each pulse was collected with a Si photomultiplier (SensL) equipped with a narrow bandpass filter (FWHM ∼10 nm) centered on the main emission line of the thermo-sensitive phosphor (694 nm). The signal was then digitized and averaged over 64 consecutive pulses with a semi-digital oscilloscope (Fluke), and post-processed using the commercial software MATLAB. Decay time values were derived from the fit of the experimental decay with a mono-exponential model using a Nonlinear Least-Square approach.
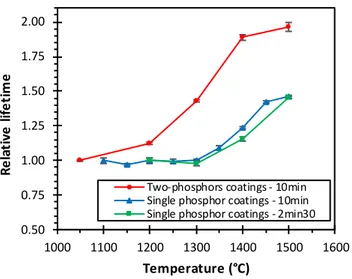
The evolution of the relative fluorescence decay-time for the three series of coatings are plotted in Figure 5. In all cases we observe a relative significant increase of the luminescence lifetime over part of the investigated temperature ranges. For the bi-phosphor coatings, one can observe a continuous increase of the luminescence lifetime from 1050°C to 1500°C, although with a noticeable decrease in slope between 1400°C and 1500°C, most likely as the lifetime starts to R² = 0.9994 0 1 2 3 4 5 6 7 8 9 10 1000 1100 1200 1300 1400 1500 Int e ns it y ra ti o R (T ) Temperature (°C) Two-phosphors coating 10 min exposure Mono-exponential fit R(1050) = 0.047
Figure 5: Evolution with thermal history of the relative luminescence decay time for the thermosensitive coatings: new version (two phosphors, 10 min exposure) and 2006 versions (single phosphor, 10 min and 2min30s exposure). converge to its final lifetime value after 10 min exposure at 1500°C. The good sensitivity to temperature of the lifetime between 1050°C and 1400°C (increase of the lifetime by 90%) provide a second parameter for marking thermal history in that range (with the intensity ratio discussed in part 3.3), especially between 1200°C and 1400°C (highest sensitivity). Former versions of the thermal paint, only containing the thermo-sensitive phosphor with a different formulation, do not show sensitivity of the luminescence lifetime to the temperature before 1300°C (Figure 5). Between 1300°C and 1500°C the lifetime value increase by 40% for both duration of exposure. Although the sensitivity range is lower than for the new bi-phosphor formulation, it shows that the thermal history marking capability is triggered even for short time exposure (2min30s). In that case, the curve is slightly shifted toward higher temperatures, and the decrease in the slope is not observed at 1500°C. This trend was confirmed for even shorter time of exposure (a few seconds), not shown here. These results allow consideration of these thermosensitive coatings emitting at 694 nm for hot spot detection applications between 1050°C and at least 1400 °C using a temporal-based approach. Moreover, if combined with the intensity ratio approach discussed in part 3.3, which showed a strong sensitivity in the same temperature range, it could therefore provide ways to increase the robustness of the thermal history sensing capability. Measurements at higher temperature between 1500 and 1650 °C will be carried out in the future to define the saturation temperature of the bi-phosphor thermosensitive coatings.
4. NEW DEVICE CONCEPT FOR ROBUST HOT SPOT DETECTION ON TPS USING LUMINESCENT
COATINGS
In the purpose of detecting overheated zones in the overall range of temperatures achieved in the whole Thermal Protection System, a new mobile and compact testing device allowing to perform thermal history mapping using the luminescent bi-phosphor coating solution developed is introduced. This prototype reading device, which will combine intensity- and temporal-based approaches (see part 3.3 and 3.4), was designed with the ultimate objective of providing a robust, cost-efficient and very high temperature sensitive reliable solution.
4.1. Temperature mapping on TPS – Methodology and prototype set-up
The experimental setup developed so far is based on the method described by Di Peng et al. in reference [6], which relies on changes of the luminescence decay time with temperature captured with a simple, low framerate CCD camera. This type of temporal method is being applied for many years with great success for deriving pressure and temperature maps on components with Pressure and Temperature Sensitive Paints in the field of aerodynamics [13].
The principle of the method is described schematically in Figure 6. LED are used as a source of excitation to illuminate the luminescent coating with a short rectangular pulse of light. During the pulse, after a short period of transition (area 1, Figure 6), the luminescence produced by the coating will reach a plateau of intensity I0 (area 2, Figure 6). A CCD camera synchronized with the LED signal will capture a first image of the luminescence intensity during a definite time window Δtimage. Right after the end of the pulse, the luminescence intensity will decay with time (area 3, Figure 6). A second picture will capture an image with the same acquisition length than the first picture at a define time after the end of the excitation pulse (t0 in Figure 6), in which intensity values correspond to a portion of the decay curve. Calculations detailed in reference [6] show that in that case the ratio Rτ of the intensities at each pixel captured in the second image I2 and first image I1 can be expressed by Equation (4): 𝑅𝜏= 𝐼2 𝐼1= −𝜏 × exp (− 𝑡0 𝜏) × (𝑒𝑥𝑝 (− ∆𝑡𝑖𝑚𝑎𝑔𝑒 𝜏 ) − 1) ∆𝑡⁄ 𝑖𝑚𝑎𝑔𝑒 (4)
where 𝜏 is the luminescence lifetime of the phosphor at a temperature T, Δtimage is the integration time of the CCD sensor and t0 is the time at which is taken Image 2 after the start of the decay. Although not giving access to the value of the luminescence lifetime, the parameter Rτ can be calibrated
0.50 0.75 1.00 1.25 1.50 1.75 2.00 1000 1100 1200 1300 1400 1500 1600 R e la ti ve l if e ti m e Temperature (°C)
Two-phosphors coatings - 10min Single phosphor coatings - 10min Single phosphor coatings - 2min30
Figure 6: Principle of the method used for the lifetime-based thermal history mapping with a simple CCD camera. vs. temperature to derive temperature maps from two pictures captured with a low framerate CCD camera (if lifetime values remain in the ms range). In practice, a third image (I3) taken after the luminescence has fully relaxed is used to subtract background offset from the first two pictures:
𝑅𝜏= 𝐼2−𝐼3
𝐼1−𝐼3 (5)
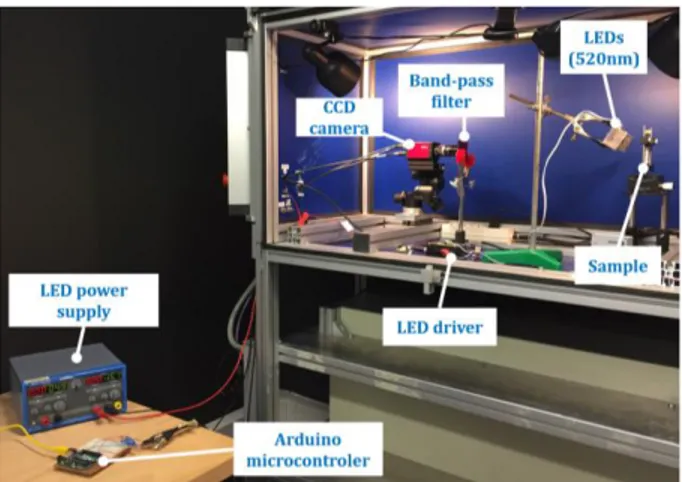
The experimental set-up for this lifetime-based phosphor thermography configuration is illustrated in Figure 7. A set of three LED emitting at 520-530 nm, designed to produce a 20 mm diameter illumination area, were used to send short pulse of excitation light on the coatings. Image of fluorescence intensities were obtained with a monochromatic 1.4M pixels CCD camera (AVT Pike F145B-15FPS) equipped with a narrow bandpass filter (FWHM ∼10 nm) centered on the main emission line of the phosphors investigated (694 nm). An Arduino microcontroller was used to drive the LED and to trigger the camera. Series of three pictures were taken for each LED pulse (Figure 6). Pictures were post-processed using the software Matlab to produce lifetime-based ratio maps Rτ according to Equation (5). Figure 8 shows an example of such processing on a luminescent coating heat treated 10 min at 1200°C. As expected, effects of non-uniform illumination and coating thickness variations visible on Figure 8 (a) and (b) were greatly reduced as the processed image shows relatively uniform Rτ values over the coating (standard deviation <8%, Figure 8 (d)).
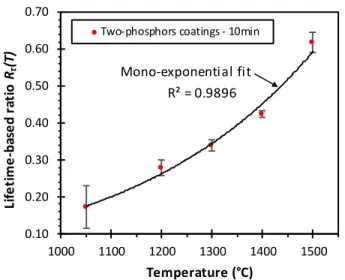
Figure 9 show the calibration curve Lifetime-based ratio Rτ vs. Temperature for the bi-phosphor coatings characterized in part 3.3 and 3.4 (10 min exposure between 1050°C and 1500°C). Each data point corresponds to the average value of the ratio calculated from each Rτ maps such as Figure 8 (d) and repeated 9 times for each sample. For all samples, spatial uncertainties remained in the range 3%-10% excepted for the
Figure 7: Prototype of the experimental setup for thermal history mapping on TPS using thermal history sensitive luminescent coatings.
Figure 8: (a)-(c) Example of a series of fluorescence intensity images captured by the camera CCD (at 694 nm) and (d)
corresponding lifetime-based ratio Rτ map obtained on a
15x20 mm2 coated sample after 10 min exposure at 1200°C.
sample at 1050°C (resulting from the lack of signal in the un-optimized configuration). Repeatability for the average value of Rτ over the 9 series of pictures for each sample was very good (standard deviation < 0.3%). The average Rτ parameter is observed to steadily increase over the range 1050°C-1500°C in a near-exponential fashion. No decrease of sensitivity is observed between 1400°C and 1500°C, contrary to luminescence lifetime measurements in Figure 5. Future work will try to compare and correlate Rτ and lifetime values. Overall, the results show that thermal history mapping with a low frame rate camera may be implemented, thus paving the way for the design of a low-cost reading device, even for the detection of very high temperature value of about 1500 °C. 4.2. Toward a robust device for hot spots detection The objective is to develop a portable reading device for on-
In ten si ty LE D s Lu mi n es cen ce in te n si ty Tr ig ge r si gn al ca mer a 0 1 0 1 0 1 t t0 ΔtLED ΔtLED
Δtimage Δtimage Δtimage
Δt1 Δt2 Δt2
1 2 3 4
Figure 9: Calibration curve Rτ vs. temperature for bi-phosphor coatings between 1050°C and 1500°C.
site thermal history mapping, which could combine both the intensity ratio and the lifetime-based approaches discussed in part 3.2 and 4.1 for better robustness of the measurement and higher versatility. Indeed, Image 1 from Figure 6 offer the possibility to implement the intensity ratio approach if intensity images at the emitting wavelength of both the temperature sensitive (I1,694nm) and the reference (I1,611nm) phosphors could be obtained separately:
𝑅(𝑇) =𝐼1,694𝑛𝑚(𝑇)
𝐼1,611𝑛𝑚 (6)
Different systems allowing to capture images of the same object at two different wavelengths using one (filter wheel, stereoscope) or two cameras (3D reconstruction, cube beam splitter) will be implemented and investigated in a future work.
5. CONCLUSIONS -OUTLOOKS
A new patented (priority application FR1902714) bi-phosphor thermosensitive coating exhibiting a strong sensitivity of its luminescence intensity with temperature for short time exposure heat treatment in the range 1050°C-1400°C, which make it a suitable indicator of thermal history for high temperature applications such as TPS, has been implemented and described. Moreover, an additional luminescence temporal-based approach fully confirms the robustness of such indicator in that temperature range. This new thermal paint is a more robust version of a thermal paint already qualified in 2006 for measuring temperature the range 850°C-1650°C.
A mono-phosphor thermosensitive coating containing only the thermo-sensitive coating emitting at 694 nm previously tested in 2006 ESA campaign (TRL 4 was achieved at this
time) is already available and can be used for hot spot detection applications between 1300 and 1500 °C with a classic lifetime-based phosphor thermography configuration. First results with a mobile and compact reading setup allowing thermal history mapping with a low frame rate CCD camera were obtained during this work, which will lead to the future industrialization of a robust, inexpensive and very high temperature sensitive reliable solution.
6. REFERENCES
[1] A. Santovincenzo, H. Ritter, “Smart TPS”, Hot Structures and
Thermal Protection Systems for Space Vehicles, Proceedings of the 4th European Workshop, Palermo, Italy, p. 287, 26-29 November
2002.
[2] ESA Statement of Work TOS-MCT/2002/3261/LN/hr. Issue 1., 2003.
[3] E.B. Copin, X. Massol, S. Amiel, T. Sentenac, Y.L. Maoult, P. Lours, “Novel erbia-yttria co-doped zirconia fluorescent thermal history sensor”, Smart Mater. Struct. 26 pp. 015001, 2017. [4] J. Coleto, Inasmet-Tecnalia ESA/ESTEC Contract no
17799/04/NL/PA.
[5] J. Coleto, M. Bausa, J. Maudes, T. Salmon, L. Martinez, A. Passaro, “Phase change materials and thermosensitive painting: Application on smart thermal protection systems”, 57th
International Astronautical Congress, American Institute of
Aeronautics and Astronautics, 2006.
[6] T. Cai, D. Peng, Y.Z. Liu, X.F. Zhao, K.C. Kim, “A novel lifetime-based phosphor thermography using three-gate scheme and a low frame-rate camera”, Experimental Thermal and Fluid Science. 80, pp. 53–60, 2017.
[7] S.W. Allison, G.T. Gillies, “Remote thermometry with thermographic phosphors: Instrumentation and applications”, Rev.
Sci. Instrum. 68, pp. 2615–2650, 1997.
[8] C. Pilgrim, “Progress on luminescence coatings for temperature mapping on turbine engines”, Thermal Barrier Coatings V
Proceedings, Irsee, Germany, 2018.
[9] A.H. Khalid, K. Kontis, “Thermographic phosphors for high temperature measurements: Principles, current state of the art and recent applications”, Sensors 8, pp. 5673–5744, 2008.
[10] S. Amiel, E. Copin, T. Sentenac, P. Lours, Y. Le Maoult, “On the thermal sensitivity and resolution of a YSZ:Er3+/YSZ:Eu3+
fluorescent thermal history sensor”, Sensors and Actuators A:
Physical 272, pp. 42–52, 2018.
[11] C. Lempereur, R. Andral, J.Y. Prudhomme, “Surface temperature measurement on engine components by means of irreversible thermal coatings”, Meas. Sci. Technol. 19, pp. 105501, 2008.
[12] K. Azar, Thermal Measurements in Electronics Cooling, CRC Press, 1997.
[13] T. Liu, J.P. Sullivan, Pressure and Temperature Sensitive
Paints, Springer-Verlag, Berlin Heidelberg, 2005.
R² = 0.9896 0.10 0.20 0.30 0.40 0.50 0.60 0.70 1000 1100 1200 1300 1400 1500 Li fe ti m e -ba se d ra ti o Rτ (T ) Temperature (°C)
Two-phosphors coatings - 10min