HAL Id: hal-00329295
https://hal.archives-ouvertes.fr/hal-00329295
Submitted on 1 Jan 2004
HAL is a multi-disciplinary open access
archive for the deposit and dissemination of
sci-entific research documents, whether they are
pub-lished or not. The documents may come from
teaching and research institutions in France or
abroad, or from public or private research centers.
L’archive ouverte pluridisciplinaire HAL, est
destinée au dépôt et à la diffusion de documents
scientifiques de niveau recherche, publiés ou non,
émanant des établissements d’enseignement et de
recherche français ou étrangers, des laboratoires
publics ou privés.
magnetosphere: one-to-one correlated observations by
Cluster and SuperDARN
A. Marchaudon, J.-C. Cerisier, J.-M. Bosqued, M. W. Dunlop, J. A. Wild,
Pierrette Décréau, M. Förster, D. Fontaine, H. Laakso
To cite this version:
A. Marchaudon, J.-C. Cerisier, J.-M. Bosqued, M. W. Dunlop, J. A. Wild, et al.. Transient plasma
in-jections in the dayside magnetosphere: one-to-one correlated observations by Cluster and SuperDARN.
Annales Geophysicae, European Geosciences Union, 2004, 22 (1), pp.141-158.
�10.5194/angeo-22-141-2004�. �hal-00329295�
Annales
Geophysicae
Transient plasma injections in the dayside magnetosphere:
one-to-one correlated observations by Cluster and SuperDARN
A. Marchaudon1, J.-C. Cerisier1, J.-M. Bosqued2, M. W. Dunlop3, *, J. A. Wild4, P. M. E. D´ecr´eau5, M. F¨orster6, D. Fontaine7, and H. Laakso81Centre d’Etude des Environnements Terrestre et Plan´etaires, 4 avenue de Neptune, 94107 Saint-Maur-des-Foss´es Cedex, France
2Centre d’Etude Spatiale des Rayonnements, CESR/CNRS, B.P. 4346, 31028 Toulouse Cedex 4, France 3Space and Atmospheric Physics, Blackett Laboratory, Imperial College, London SW7 2BZ, UK
4Department of Physics and Astronomy, University of Leicester, University Road, Leicester, LE1 7RH, UK 5LPCE and Universit´e d’Orl´eans, 45071 Orl´eans, France
6Max Planck-Institute f¨ur Extraterrestrische Physik, 85741 Garching, Germany
7Centre d’Etude des Environnements Terrestre et Plan´etaires, 10-12 avenue de l’Europe, 78140 V´elizy, France 8Space Science Division, ESTEC, Noordwijk, The Netherlands
*now at: RAL, Rutherford-Appleton Laboratory, Chilton, Didcot, Oxon, OX11 0QX, UK
Received: 11 December 2002 – Revised: 2 June 2003 – Accepted: 9 June 2003 – Published: 1 January 2004
Abstract. Conjunctions in the cusp between the four Clus-ter spacecraft and SuperDARN ground-based radars offer unique opportunities to compare the signatures of transient plasma injections simultaneously in the high-altitude day-side magnetosphere and in the ionosphere. We report here on such observations on 17 March 2001, when the IMF initially northward and duskward, turns southward and dawnward for a short period. The changes in the convection direction at Cluster are well correlated with the interplanetary magnetic field (IMF) Byvariations. Moreover, the changes in the
iono-sphere follow those in the magnetoiono-sphere, with a 2-3 min de-lay. When mapped into the ionosphere, the convection ve-locity at Cluster is about 1.5 times larger than measured by SuperDARN.
In the high-altitude cusp, field and particle observations by Cluster display the characteristic signatures of plasma in-jections into the magnetosphere suggestive of Flux Transfer Events (FTEs). Simultaneous impulsive and localized con-vection plasma flows are observed in the ionospheric cusp by the HF radars. A clear one-to-one correlation is observed for three successive injections, with a 2–3 min delay between the magnetospheric and ionospheric observations. For each event, the drift velocity of reconnected flux tubes (phase ve-locity) has been compared in the magnetosphere and in the ionosphere. The drift velocity measured at Cluster is of the order of 400–600 m s−1 when mapped into the ionosphere, in qualitative agreement with SuperDARN observations. Fi-nally, the reconnected flux tubes are elongated in the north-south direction, with an east-west dimension of 30–60 km in the ionosphere from mapped Cluster observations, which is Correspondence to: A. Marchaudon
(aurelie.marchaudon@cetp.ipsl.fr)
consistent with SuperDARN observations, although slightly smaller.
Key words. Ionosphere (plasma convection) – Magneto-spheric physics (magnetopause, cusp, and boundary layers; magnetosphere-ionosphere interactions)
1 Introduction
Plasma entry from the solar wind into the magnetosphere oc-curs mainly through the dayside magnetopause. Three main regions just inside the magnetopause with different plasma characteristics, have been recognized since the initial survey by Heos-2 (Haerendel et al., 1978): the low-latitude bound-ary layer (LLBL), the high-altitude cusp and the plasma man-tle. Across these boundary regions, a competition exists be-tween diffusion and reconnection for mass, momentum and energy transfer from the solar wind to the magnetosphere. The low-latitude magnetopause adjacent to the LLBL is the main site for reconnection (Eastman et al., 1976; Newell and Meng, 1988; Fuselier et al., 1999), when the interplan-etary magnetic field (IMF) is southward. The LLBL is pop-ulated by a mixture of plasmas of magnetosheath and mag-netospheric origin and is partly located on closed field lines. The LLBL is magnetically connected to the ionospheric cleft (Newell and Meng, 1988), where particle fluxes are lower in intensity and extend to higher energies than in the cusp located just poleward (Aparicio et al., 1991). The high-altitude cusp (Paschmann et al., 1976) is located on open field lines, where magnetosheath plasma entry is more direct, as indicated by the spectral characteristics of the particles which are close to those observed in the magnetosheath (Newell and
Meng, 1988). The high-altitude cusp is magnetically con-nected to the “cusp proper” at lower altitudes, where plasma with magnetosheath characteristics is also observed. The persistency of the cusp proper has led many authors (e.g. Newell et al., 1989) to conclude that processes other than patchy or transient merging occur in the high-altitude cusp such as steady-state merging or diffusion. Poleward of the high-altitude cusp, is the plasma mantle (Rosenbauer et al., 1975; Crooker et al., 1977). This boundary layer consists of magnetosheath-like plasma with a tailward-directed bulk flow parallel to the local magnetic field. Particles entering the cusp may move on mantle field lines through convection and are dispersed by the velocity filter effect (Reiff et al., 1977). For strongly northward IMF, the high-latitude magnetopause adjacent to the mantle is the preferred site of reconnection (Maezawa, 1976).
Reconnected magnetic flux tubes allow energy and mo-mentum transfer from the solar wind to the magnetosphere. Initially considered as a steady-state process, its intermittent and spatially limited nature was discovered, independently by Haerendel (1978) and by Russell and Elphic (1978, 1979). Russell and Elphic (1978) named these bursts of magnetic re-connection, the Flux Transfer Events (FTEs) and first recog-nised their main observational characteristic, the bipolar sig-nature in the magnetic field component normal to the magne-topause. Later studies allowed one to refine the description of FTEs, namely the plasma signature inside the reconnected flux tube, consisting of a mixture of magnetosheath and mag-netospheric plasma (e.g. Farrugia et al., 1988), the acceler-ated ion flows (e.g. Paschmann et al., 1982) and their larger occurrence rate during periods of southward interplanetary magnetic field (e.g. Berchem and Russell, 1984; Lockwood and Smith, 1992).
Flux transfer events map into the ionosphere along mag-netic field lines. The first observation of the ionospheric sig-nature of an FTE was made by Goertz et al. (1985) with the STARE VHF coherent radar. Sporadic and spatially limited flow bursts moving in the northwest direction were attributed to magnetic merging, as indicated by the simultaneous obser-vation of a satellite signature at the magnetopause. Several studies with the PACE HF radar followed, and Pinnock et al. (1991, 1993, 1995) presented cases of enhanced convec-tion channels superimposed on the continuous cusp echoes. Inside flow channels, the velocity was larger than in the am-bient plasma and directed mainly northward, as expected by the Southwood (1987) model for FTEs. Most of these con-vection channels are also characterized by an azimuthal ve-locity component, the sign of which depends upon the sign of the IMF Bycomponent. It was observed that in the
North-ern Hemisphere, the flow is westward for positive By and
eastward for negative Byand reversed in the Southern
Hemi-sphere, in agreement with the convection models (Reiff and Burch, 1985; Crooker, 1979, 1988; Cowley et al., 1991), which assume that the convection is driven by the magnetic tension at the reconnection site. It was also observed that the longitudinal extent of these flow bursts is generally larger than their latitudinal extent and that their average repetition
rate is about 7 min. Parallel currents flowing on the flanks of the flow burst have been modelled (Southwood, 1987; Lock-wood et al., 1990, 2001a) and observed (Milan et al., 2000). All the above observations and models suggested that inter-mittent and patchy magnetic reconnection was the source of FTEs, including sporadic flow bursts which represent their ionospheric signature. Observations by SuperDARN radars have complemented this set of observations. For example, Provan et al. (1998), with a high resolution scan mode, and Milan et al. (2000) and Thorolfsson et al. (2000), with the as-sociation of radars and optical observations, determined the size, shape, velocity and recurrence rate of the ionospheric signatures of FTEs. These case studies have been confirmed by statistical studies of the location, occurrence and relation with the IMF By of the flow bursts (Provan and Yeoman,
1999; Provan et al., 1999; McWilliams et al., 2000). Thus, flux transfer events (FTEs) have been extensively studied during the last twenty years, both in the magne-tosphere by satellites and in the ionosphere by radars or imagers. However, simultaneous observations in the high-altitude magnetosphere and in the ionosphere are less nu-merous. Elphic et al. (1990) showed a clear association be-tween an FTE, identified near the magnetopause by its mag-netic bipolar signature observed by the ISEE2 satellite, and poleward-moving ionospheric flow bursts and auroral forms observed by the EISCAT radar and photometers. Almost ten years later, Neudegg et al. (1999) have associated the signatures of an FTE observed at the magnetopause by the Equator-S satellite and in the ionosphere by a SuperDARN radar. In a statistical study, Neudegg et al. (2000) showed a clear one-to-one association between reconnected flux tubes at the magnetopause and ionospheric poleward moving flow bursts.
The four-spacecraft Cluster mission, with an optimised inter-satellite separation, is well-suited to analyze the de-tailed structure of FTEs in the magnetosphere (Bosqued et al., 2001; Owen et al., 2001). Coordinated studies be-tween Cluster and magnetically conjugate ground-based in-struments are of primary importance to characterize the elec-trodynamic coupling between the ionosphere and the dis-tant magnetosphere (Opgenoorth et al., 2001; Lockwood et al., 2001b). Clear FTE signatures have been recently observed simultaneously by ground-based instruments and Cluster (Lockwood et al., 2001c; Wild et al., 2001), illustrat-ing the ionosphere-magnetosphere couplillustrat-ing caused by the magnetopause reconnection.
On 17 March 2001, between 05:05 and 06:50 UT, Clus-ter crosses the high-altitude northern cusp while the Super-DARN CUTLASS radars measure line-of-sight (l-o-s) veloc-ities typical of cusp echoes in the conjugate ionosphere. The interplanetary conditions are very quiet, with a mainly north-ward and dusknorth-ward IMF and a low solar wind pressure. The study presented in this paper is limited to a short interval between 05:15 and 06:00 UT, characterised by a southward and dawnward excursion of the IMF, leading to an increased rate of magnetic reconnection at the magnetopause. Dur-ing that time period, characteristic FTE signatures are
ob-served by Cluster in the magnetosphere, and duskward flow bursts are simultaneously observed by the CUTLASS radars in the ionosphere, at the magnetic footprint of Cluster. Clus-ter and radar observations are well correlated. A detailed comparison for three successive injections shows that the lo-cal plasma convection velocity and the drift velocity of the flux tubes, evaluated in the ionosphere and at 7–8 RE
alti-tude (and then mapped into ionosphere) are fully consistent.
2 Instrumentation 2.1 Cluster
The Cluster mission is composed of four identical spacecraft in a tetrahedral formation in order to discriminate between small-scale spatial and temporal structures. Cluster is lo-cated on an elliptical orbit with a perigee of 4 RE, an apogee
of 19.6 RE and a period of ∼58 h. In this paper, we use
data from several experiments: the Cluster Ion Spectrometer (CIS), the Fluxgate Magnetometer (FGM), the Plasma Elec-tron and Current Experiment (PEACE), the Waves of High frequency and Sounder for Probing of Electron density by Relaxation instrument (WHISPER), the Electric Field and Wave experiment (EFW) and the Electron Drift Instrument (EDI).
The Cluster Ion Spectrometry (CIS) experiment (R`eme et al., 2001) provides a full, three-dimensional energy/velocity distribution of the major magnetospheric ions from ther-mal energies up to about 40 keV/e and the moments with a time resolution up to 4 s. The experiment is composed of two different instruments: the COmposition and DIstribu-tion FuncDIstribu-tion analyser (CIS1/CODIF), which gives the mass per charge composition with a medium angular resolution (22.5◦), and the Hot Ion Analyser (CIS2/HIA), which offers a better energy and angular resolution without mass resolu-tion. In this study, we use energy spectrograms and the mo-ment data (ion velocity components and density) provided by the CIS1/CODIF and CIS2/HIA instruments on Cluster 1.
In support of CIS observations, data from four other instru-ments have been used in this paper. The PEACE instrument (Johnstone et al., 1997) is designed to measure the electron velocity distribution. The WHISPER instrument (D´ecr´eau et al., 2001) yields the electron density determined via the pas-sive mode of the relaxation sounder. The EFW instrument (Gustafsson et al., 2001) measures the electric field and the spacecraft potential, of which the variations are, to a large extent, proportional to those of the plasma density. The EDI instrument (Paschmann et al., 2001) measures the drift ve-locity of artificially injected electron beams, from which the perpendicular electric field can be deduced.
The magnetic field data are provided by the Fluxgate Mag-netometer (FGM) experiment (Balogh et al., 2001). Each FGM instrument is composed of two tri-axial fluxgate mag-netic field sensors. In this study, the magmag-netic field data are used with a resolution of ∼0.125 s. By identifying similar but time-lagged signatures of boundaries on each of the four
spacecraft, the FGM data are used to derive the velocity of these boundaries.
2.2 SuperDARN
The ionospheric convection is measured by the CUTLASS SuperDARN coherent HF radars at Hankasalmi (Finland) and Pikkvibær (Iceland) (Greenwald et al., 1995). Each radar measures the l-o-s plasma velocity in the F-region of the ionosphere. As the CUTLASS radars share a common field-of-view, convection velocity vectors can be obtained from the simultaneous measurement of two independent compo-nents. The SuperDARN radar beam is narrow, typically 3.3◦ in azimuthal width, and scans successively 16 adjacent di-rections divided into 75 range bins of 45 km length. The field-of-view of each radar is large: over 3000 km in range and 53◦in azimuth. During the period under study, the two radars were operated in the high-resolution common mode, with each beam sounded for 3 s, resulting in a full scan every 1 min.
3 Geometry of observations and interplanetary condi-tions
On 17 March 2001, the magnetic footprint of the Clus-ter spacecraft crosses the field-of-view of the CUTLASS radars between 04:50 and 09:20 UT. During the shorter in-terval 05:05–06:50 UT, the Cluster spacecraft (with an av-erage separation of ∼600 km) encounters the northern ex-ternal cusp. Cluster is moving sunward from the northern lobe through the cusp towards the dayside magnetopause close to the noon magnetic plane, as shown in Fig. 1, which represents a sketch of the projection of Cluster in the XZ GSM plane. The overall cusp crossing has been analysed by Vontrat-Reberac et al. (2003). In the present paper, we fo-cus on a short period between 05:15 and 06:00 UT, during which Cluster and SuperDARN observe in the cusp the re-sponse to a southward and dawnward excursion of the IMF. During this period, the radars are located in the pre-noon sector and observe cusp echoes in the ionosphere at very far horizontal ranges between 2700 and 3300 km. Figure 2 shows a map of the field-of-view of the CUTLASS radars at 05:30 UT, in Altitude-Adjusted Corrected GeoMagnetic co-ordinates (AACGM) (Baker and Wing, 1989). The mapped ionospheric footprint of Cluster (black dot) is calculated by projection along magnetic field lines, with the Tsyganenko T96 model (Tsyganenko, 1995) and real inputs of IMF and solar wind pressure from the ACE satellite. During the period of interest, the Cluster footprint remains almost fixed and is located near 79◦Magnetic Latitude (MLAT) and 165◦ netic Longitude (MLON), corresponding to ∼11:30 Mag-netic Local Time (MLT), where cusp echoes are observed by the Hankasalmi radar.
The IMF and solar wind data are provided by the ACE satellite located near the Lagrangian L1 libration point, at about 226 RE upstream of the Earth. The IMF data are
plot-5 0 5 10 4 2 0 2 4 6 8 10 12 14
Cluster Orbit & s/c configuration 17/03/2001
X Re Z Re 01 UT 03 UT 05 UT 09 UT 07 UT
Figure 1
15Fig. 1. Sketch of the projection of the Cluster 1 orbit (black solid
line) in the GSM XZ plane, for the period 01:00–09:00 UT on 17 March 2001. Magenta dots along the orbit are separated by one hour. The Cluster spacecraft configuration is shown around 06:45 UT, each spacecraft corresponding to a coloured dot with the Cluster colour-code (SC1-black, SC2-red, SC3-green, SC4-blue). The separation of the spacecraft has been expanded by a factor of ten to better indicate the tetrahedral configuration in the cusp. Sev-eral magnetospheric field lines (blue solid lines) have also been plot-ted.
ted in GSM coordinates with an 86-min delay in Fig. 3. The propagation delay to the dayside ionosphere is evalu-ated between 86 and 91 min, taking into account a 78-min delay between the ACE and the bowshock (with a solar wind bulk speed of ∼290 km s−1), a 5- to 10-min delay across the magnetosheath (Spreiter and Stahara, 1980) and a 3-min de-lay between the magnetopause and the dayside ionosphere (Etemadi et al., 1988). During the interval 05:05–06:50 UT when Cluster is in the cusp, the solar wind pressure is low, less than 0.5 nPa (not shown), and the IMF is characterised by mainly positive By and Bz, both with a mean value of
+3 nT (Fig. 3b and c). The Bx component also remains
slightly positive, oscillating between 0 and +3 nT (Fig. 3a). But during the interval under study (05:15–06:00 UT), a ro-tation of the IMF is observed. Initially duskward and north-ward, the IMF progressively turns dawnward and then south-ward to reach Bz ∼−2 nT and By ∼−5 nT between 05:30
and 05:45 UT, after which the IMF returns to its initial di-rection. As Bzremains smaller than By, the convection
pat-tern is mainly controlled by the By component. The
rota-tion of the IMF is evidenced by the clock angle (Fig. 3d) which reaches a maximum of 110◦at ∼05:40 UT. Following Taguchi and Hoffman(1996), who showed that the IMF By
control of the convection requires clock angles larger than
SuperDARN FOV and Cluster footprint - 05:30 UT
-165 75 90 105 120 135 150 165 180 70 80 90 12:36 MLT 06:36 MLT E F Cluster b2 b14
Figure 2
Fig. 2. Common field-of-view (magnetic coordinates) of the
Super-DARN Hankasalmi (Finland: F) and Pikkvibær (Iceland East: E) radars at 05:30 UT, with the Pikkvibær beam 2 and the Hankasalmi beam 14 (dashed lines) and the Cluster footprint (black dot) super-imposed.
70◦, we may expect a By control starting around 05:25 UT
and lasting up to 05:43 UT. The IMF clock angle rotation is also favourable to reconnection between the IMF and magnetospheric field lines at the dawnside northern magne-topause. Thus, except for the short period between ∼05:30 and ∼05:45 UT, when IMF Bz <0, the IMF and solar wind
data confirm that very quiet conditions are prevailing and support the observation of a polar cusp at very high latitudes, as it will be shown from Cluster and radar data in the next section.
4 Observations 4.1 High-altitude cusp
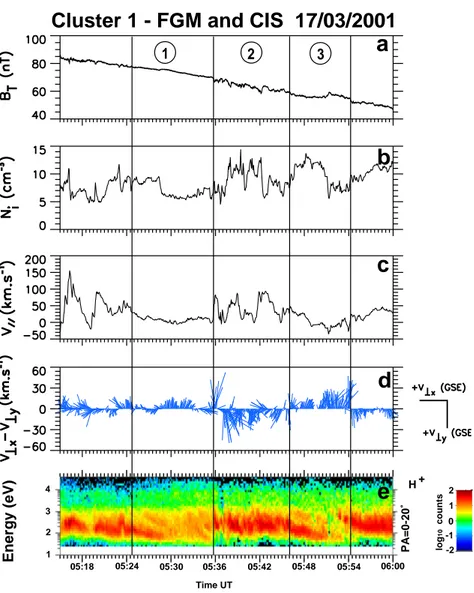
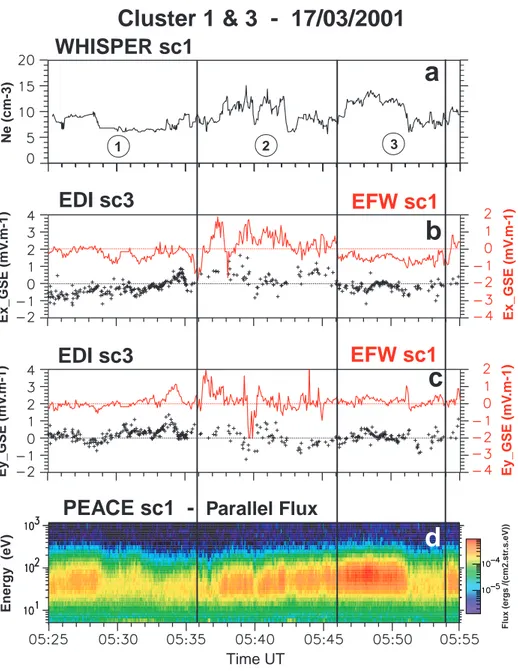
In this section, the presentation will be organised around the CIS and FGM data, with reference to the other instruments when useful. Figure 4 presents data from CIS and FGM on board Cluster 1, for the interval 05:15–06:00 UT. The panels from top to bottom display the magnetic field amplitude, the total ion density, the ion parallel velocity, the ion perpendic-ular velocity projected in the XY GSE plane and the energy-time spectrogram of precipitating H+ions in the 0 − −20◦ pitch angle range. Figure 5 presents data from other instru-ments of the Cluster 1 and 3, from top to bottom, the WHIS-PER (SC1) electron density, the x and y GSE components of the electric field from EFW (SC1) and EDI (SC3), and the
Figure 3
Fig. 3. Interplanetary magnetic field (IMF) from the ACE spacecraft on 17 March 2001 for the period 04:30– 06:30 UT. Data are lagged by 86 min to take into account the delay from the spacecraft to the ionosphere. Panels (a),
(b) and (c) show, respectively, the IMF Bx, By and Bz components in GSM
coordinates. Panel (d) shows the IMF clock angle.
PEACE (SC1) energy-time spectrogram of the electrons in the parallel direction.
Cluster is in the cusp from 05:05 to 06:50 UT (Vontrat-Reberac et al., 2003). During the shorter period displayed in Fig. 4, the ion density (Fig. 4b) fluctuates between 5 and 15 cm−3and the mean ion parallel energy (Fig. 4e) is 300 eV, both values being typical of the high-altitude cusp. The PEACE data also exhibit typical cusp properties, such as an electron mean energy of 40 eV (Fig. 5d) and essentially bi-directional electron fluxes (parallel and anti-parallel). The WHISPER electron density is of the same order and well correlated with the CIS ion density (Figs. 4b and 5a). Sev-eral characteristics of a northward IMF cusp are also ob-served, namely its location at very high latitude, between 79◦ and 81◦MLAT (Newell et al., 1989; Palmroth et al., 2001) and the energy-time dispersion of the ion injections (Vontrat-Reberac et al., 2003).
The interval 05:25–05:54 UT can be divided into three sub-intervals, numbered 1, 2 and 3 in Figs. 4 and 5, according to the sign of the dawn-dusk component of the perpendicu-lar ion velocity in Fig. 4d, which closely follows the IMF By
variations. Before interval 1, plasma injections are observed at Cluster, with large parallel velocities. This period is asso-ciated with positive IMF Byand Bzbefore the IMF turning.
Because Cluster and SuperDARN observations are not con-jugate, we will focus only on later injections observed during interval 2.
Between 05:25 and 05:36 UT (interval 1 in Figs. 4 and 5), the perpendicular convection velocity is less than 20 km s−1 and points primarily dawnward. The CIS density is low (∼6–7 cm−3) with only small fluctuations. The magnetic field amplitude is fairly steady, typical of a quiet period. These observations correspond to a transition phase in the cusp, associated with the period when the IMF is rotat-ing from a northward-duskward orientation to a southward-dawnward orientation.
Between 05:36 and 05:46 UT (interval 2 in Figs. 4 and 5), the convection at Cluster turns duskward (in the +YGSE
di-rection). The convection velocity increases up to 50 km s−1, with numerous fluctuations in direction and amplitude. The parallel ion flux and the ion density exhibit a series of en-hancements with multiple peaks. More precisely, when the
Cluster 1 - FGM and CIS 17/03/2001
a
d
c
b
05:18 05:24 05:30 05:36 05:42 05:48 05:54 06:00 Time UT 1 4 3 2 P A = 0 -2 0 ˚ H+ E n e rg y ( e V ) lo g 1 0 c o u n ts -2 -1 0 1 2e
1 2 3Figure 4
Fig. 4. Cluster 1 FGM and CIS data for
the period 05:15–06:00 UT, with three sub-intervals. (a) Magnetic field am-plitude. (b) Total ion density. (c) Ion parallel velocity. (d) Ion velocity vec-tors perpendicular to the magnetic field projected in the XY GSE plane. (e)
Energy-time spectrogram of precipitat-ing H+ ions, in the 0–20◦pitch angle range.
perpendicular velocity shows three successive duskward in-tensifications centred at 05:38, 05:40 and 05:43 UT, the par-allel ion velocity (defined as the moment of the total ion dis-tribution function) shows three weak downward peaks (50 and 100 km s−1), characteristic of an excess of precipitating ions. Notice that a first peak of parallel velocity also occurs at 05:36 UT, associated with dawnward perpendicular velocity and located at the boundary between intervals 1 and 2. Mag-netic field perturbations are also observed, in particular, the magnetic field amplitude decreases during each velocity en-hancement and ion injection (diamagnetic effect). These ob-servations coincide with the period of dawnward and south-ward IMF, favouring the solar wind plasma entry at the dawn-side magnetopause. Therefore, one can anticipate that these observations are signatures of cusp plasma injections due to magnetic reconnection.
Between 05:46 and 05:54 UT (interval 3 in Fig. 4), the per-pendicular convection velocity turns dawnward again, with characteristics similar to interval 1, but the speed remains large (around 30 km s−1). The density presents a large-scale enhancement, the ion energies decrease slightly and
the energy-time (latitude) dispersion profile is more contin-uous, suggesting a change in the reconnection process. In addition to the general decrease due to the motion of Clus-ter towards the magnetopause, the magnetic field amplitude shows a reduction followed by an enhancement, which is in-verse to the density variation, implying a diamagnetic effect. This interval is associated with the return to the conditions of duskward and northward IMF. After 05:54 UT, the increase in ion energies suggests the occurrence of a new injection, and the perpendicular velocity turns duskward again for sev-eral minutes, but no apparent change in the IMF can be as-sociated with it. All the above observations of the density and perpendicular ion velocity during intervals 1-2-3 are con-firmed by the PEACE, WHISPER, EFW and EDI data: the ion and electron density profiles measured by CIS, PEACE and WHISPER (Figs. 4b and 5a) are very similar, resulting from the need to maintain quasi-neutrality in the cusp (Reiff et al., 1977; Burch, 1985). Also, the electric field measured by EFW and EDI (Fig. 5b and c) confirms the convection velocity obtained by the CIS instrument. The electric field profiles of both experiments are comparable, in spite of the
Ne (cm-3) Ey_GSE (mV .m-1) Ex_GSE (mV .m-1) Ey_GSE (mV .m-1) Ex_GSE (mV .m-1)
Cluster 1 & 3 - 17/03/2001
Figure 5
1 2 3EDI sc3
EFW sc1
EDI sc3
EFW sc1
WHISPER sc1
a
c
b
Ener gy (eV) Flux (er gs /(cm2.str .s.eV))PEACE sc1 -
Parallel Flux
Time UT
d
Fig. 5. WHISPER, EFW, EDI and PEACE data for the period 05:25–05:55 UT, with three sub-intervals. (a) WHISPER (SC1) electron
density. (b) and (c) x and y components of the electric field in GSE coordinates for EFW (SC1) (red line) and EDI (SC3) (black crosses). The offset of the EFW data has been corrected. (d) PEACE (SC1) energy-time spectrogram of precipitating electrons, in the 0 − 20◦pitch angle range (Calibration 1.5).
use of spacecraft 3 for EDI with less data gaps, introducing a small lag of about 1 min between EDI and EFW. In addi-tion, data (not shown) from the same experiment but from different satellites show similar signatures, suggesting that multipoint measurements can be used safely to deduce the velocity of propagation of the flux tubes in which injection occurs.
4.2 Ionospheric convection
Figure 6 presents three pairs of range-time colour-coded plots showing the ionospheric convection measured by the CUTLASS Hankasalmi and Pikkvibær radars between 05:15
and 06:15 UT. In each pair, the upper plot shows the l-o-s velocity and the lower plot shows the amplitude (dB) of the backscattered signal. Three beams are presented: from top to bottom, beams 13 and 14 of Hankasalmi and beam 2 of Pikkvibær. These three beams are directed mainly eastward and thus, measure essentially the dawn-dusk component of the convection velocity. The Hankasalmi beam 14 and the Pikkvibær beam 2 are the beams on which the Cluster foot-print is located during this period (black and white lines in the middle and bottom panels). For both radars, the l-o-s velocity shows cusp echoes, and the time period can be sub-divided into the same three intervals as for the Cluster data. Before 05:27 UT and after 05:48–05:50 UT, the two radars
SuperDARN radial velocity and power
V elocity (ms -1 ) -450 -300 -150 0 150 300 450 Ionospheric scat only58
60
62
64
66
68
70
Range gate
58
60
62
64
66
68
Range gate
Beam 2 - Thikkvibaer
05:20
05:30
05:40
05:50
06:00
06:10
56
58
60
62
64
66
68
70
Range gate
60
62
64
66
Range gate
0 5 10 15 20 25 P o wer (dB) Ionospheric scat onlyUT
05:20
05:30
05:40
05:50
06:00
06:10
56
58
60
62
64
66
68
70
Range gate
60
62
64
66
68
Range gate
58
60
62
64
66
68
70
Range gate
58
60
62
64
66
68
Range gate
Beam 13 - Hankasalmi
UT
58
60
62
64
66
68
70
Range gate
58
60
62
64
66
68
Range gate
Beam 14 - Hankasalmi
05:20
05:30
05:40
05:50
06:00
06:10
56
58
60
62
64
66
68
70
Range gate
60
62
64
66
68
Range gate
V elocity (ms -1 ) -450 -300 -150 0 150 300 450 Ionospheric scat only V elocity (ms -1 ) -450 -300 -150 0 150 300 450 Ionospheric scat only 0 5 10 15 20 25 P o wer (dB) Ionospheric scat only 0 5 10 15 20 25 P o wer (dB) Ionospheric scat only Cluster ClusterUT
Figure 6
Fig. 6. Pairs of range-time plots (l-o-s velocity and backscattered power) for three beams of SuperDARN radars for the period 05:15–
06:15 UT. The Cluster footprint is superimposed on beam 14 of Hankasalmi and beam 2 of Pikkvibær (black or white line). The slope of the range-time dispersed structures are depicted by black segments on the power plot of the beams 13 and 14 of the Hankasalmi radar.
measure dawnward (positive) velocities associated with the periods of positive IMF By. Between 05:27 and 05:48 UT,
i.e. during the period of stronger negative IMF By, they show
duskward (negative) velocities. During the whole interval 05:15–06:15 UT, the plasma velocity is fairly weak, less than 600 m s−1, probably due to the quiet conditions prevailing
during the overall period. The cusp echoes are located at large ranges, between 09:30 and 12:30 MLT and between 74◦ and 82◦MLAT. The dawnward and southward rotation of the IMF is too short for a clear equatorward motion of the cusp echoes to be observed, as expected for a southward IMF ex-cursion.
During the interval of duskward convection velocity, each radar observes strong flow enhancements (flow bursts) also moving duskward, with an increased velocity. These bursts are typical ionospheric signatures of plasma injection events (Pinnock et al., 1995). Therefore, the two radars observe dif-ferent flow bursts, with those of Hankasalmi being located over the Cluster footprint track, while those of Pikkvibær are closer to the radar. Then the flow bursts detected simultane-ously by the two radars do not represent the same structure. This also explains why, in the range-time velocity plots of Fig. 6, the shapes of the velocity flow bursts are different for the two radars. The range-time slope of the bursts in the Pikkvibær beam clearly indicates a predominantly duskward motion of the burst, whereas no clear motion of the veloc-ity structures is observed along the Hankasalmi beams. Al-though no echoes are observed by the Pikkvibær radar at the Cluster position, the flow bursts observed at closer range gates should reach the Cluster footprint after the end of the negative IMF Byperiod. On the contrary, the flow bursts
ob-served by the Hankasalmi radar pass the Cluster position at the beginning of their lifetime during the negative IMF By
period. Therefore, we will later compare only the convection data from the Hankasalmi radar with Cluster. The Pikkvibær data can be used only to demonstrate the global scale of the changes in the ionospheric convection observed at the Clus-ter footprint by the Hankasalmi radar, and that the negative IMF Byperiod is associated with several injections.
Figure 6 also indicates that the amplitude of the backscat-tered signal is weak during the periods of dawnward ve-locity before 05:25 UT and after 05:51 UT. Between 05:25 and 05:51 UT, the amplitude increases strongly, particularly within the velocity flow bursts, possibly due to intense par-ticle precipitation related to upward field-aligned currents. In the range-time backscattered power plots, the flow bursts are characterized by a time dispersion on both radars, con-trary to the velocity structures, where no clear dispersion is seen on the Hankasalmi beams. Two structures are observed on the Pikkvibær radars and three on the Hankasalmi radars (see the three black lines in the top two panels), with the first two being hardly separated. The backscattered power is larger along the Pikkvibær beams than along the Hankasalmi beams, and the shape of the structures varies between the two radars, which again confirms that the flow bursts seen by the two radars are different. From the slope of the three power structures observed with the Hankasalmi radar, it will be pos-sible to derive the velocity of the flow bursts structures and to compare it with the velocity of plasma structures observed at Cluster and projected into the ionosphere.
5 Comparison between SuperDARN and Cluster 5.1 Plasma convection velocity
In this section, we present a detailed comparison between the convection velocity measured in the ionosphere by Su-perDARN and in the magnetosphere by Cluster. For
map-ping the Cluster velocity into the ionosphere, magnetic field lines are assumed to be equipotential and the Tsyganenko T96 model (Tsyganenko, 1995) is used with inputs of IMF and solar wind data measured by ACE and lagged by 86 min. Each data point of perpendicular ion velocity measured by the CIS instrument on Cluster 1 is projected along magnetic field lines into the ionosphere and then compared with Su-perDARN radial velocities at the Cluster footprint location. We checked the validity of the T96 model by comparing the magnetic field vectors obtained by the model at the Cluster position and by the FGM instrument. The agreement is good within less than 15% in amplitude and 5◦in direction.
The comparison of plasma convection velocity at Cluster and SuperDARN is shown in Fig. 7. Panel (a) presents the time variation of the CIS ion perpendicular velocity in the form of vectors at the Cluster position. Each vector repre-sents the perpendicular-to-B component of the plasma con-vection velocity projected onto the XY GSE plane. Because the local magnetic field is close to the zGSE direction, the
−yGSE component is mainly dawnward. Panel (b) shows
the same data after projection into the ionosphere at 250 km altitude, where Vwest and Vnorth correspond to the veloc-ity components in the magnetic west and north directions in AACGM coordinates. For comparison, panel (c) displays the range-time plot of the l-o-s velocity for the Hankasalmi beam 14 with the Cluster footprint (black line). In order to better il-lustrate the correlation between the Cluster and SuperDARN velocities, the mapped CIS velocity is first averaged with a running mean over one minute (the time resolution of Su-perDARN measurements), and then projected along the di-rection of the Hankasalmi beam 14 and plotted in panel (d), together with the velocity measured in the appropriate Super-DARN range gate where the Cluster footprint is located (red segments).
The correlation between satellite and radar convection ve-locity is satisfactory, particularly if a short delay of 2 min between Cluster and SuperDARN is allowed. This is the rea-son why the Cluster data are plotted for the 05:15–06:00 UT period (panels (a) and (b)) whereas the SuperDARN data and the SuperDARN-Cluster correlation are plotted at the iono-spheric time for the 05:17–06:02 UT period (panels (c) and (d)). At the range gate of the Cluster footprint, the direction of the beam 14 of Hankasalmi is close to dawn-dusk (west-east), making positive velocities essentially dawnward and negative velocities duskward. Except for the short interval of dawnward velocities measured by Cluster between 05:35 and 05:36 UT (panels (a) and (b)) which is not observed by SuperDARN, probably because this structure is too short to be detected by SuperDARN with its 1-min resolution, Super-DARN and Cluster show the same global behaviour of the east-west component of the convection. A first dawn-to-dusk reversal at 05:34 UT (Cluster time) is followed by a step in-crease of the duskward velocity at 05:36 UT after which three duskward intensifications between 05:36 and 05:46 UT are associated with the injections (see below) and followed again by a dusk-to-dawn reversal at 05:46 UT. The last dawn-to-dusk reversal observed at Cluster at 05:56 UT is not observed
Dawn Ionospheric pojection of Cluster con vection velocity Cluster 1 - con vection velocity 05:20 05:30 05:40 05:50 06:00 55 60 65 70 Rang e gate -450 -300 -150 0 150 300 450 V elocity (m.s -1 ) Ionospheric scat only Cluster footprint
Radial velocity Finland
radar - beam 14
Ionospheric con
vection velocity
along the beam 14 (m.s )
Cluster SuperDARN Time UT
a
d
c
b
Figure 7
Dawnward DuskwardCluster & SuperDARN convection velocity
Fig. 7. Convection velocity measured by SuperDARN and Cluster. (a) Cluster 1 CIS ion perpendicular velocity vectors. Each vector
represents the perpendicular-to-B component of the plasma velocity projected onto the XY GSE plane. Because the local magnetic field is close to the zGSEdirection, the −yGSE component is mainly dawnward. (b) Projection into the ionosphere at 250 km altitude of the CIS
velocity vectors, where Vwestand Vnorthcorrespond to the velocity components in the magnetic west and north directions, respectively, in AACGM coordinates. (c) Range-time plot of l-o-s velocity for the SuperDARN Hankasalmi beam 14 with the Cluster footprint superimposed (black line). (d) Comparison of velocity measured by Cluster (solid black line) and SuperDARN (red segments). The Cluster CIS velocity has been averaged over 1 min and projected along the beam 14 of Hankasalmi. The SuperDARN velocity is the radial velocity measured at the Cluster footprint.
at the same location by SuperDARN, but about one range gate (45 km) westward of the Cluster footprint (panel (c)). However, this discrepancy remains within the error range, since the uncertainty of the Cluster footprint with respect to the SuperDARN pattern is as large as ±4 gates (±180 km). This evaluation takes into account model-dependent
uncer-tainties in mapping Cluster to the ionosphere and range un-certainties in the localization of SuperDARN echoes for large ranges. Detailed examination of the 05:36–05:46 UT inter-val shows that the three duskward intensifications observed by Cluster (mentioned above) are also observed by Super-DARN, although the one-minute time resolution of the radars
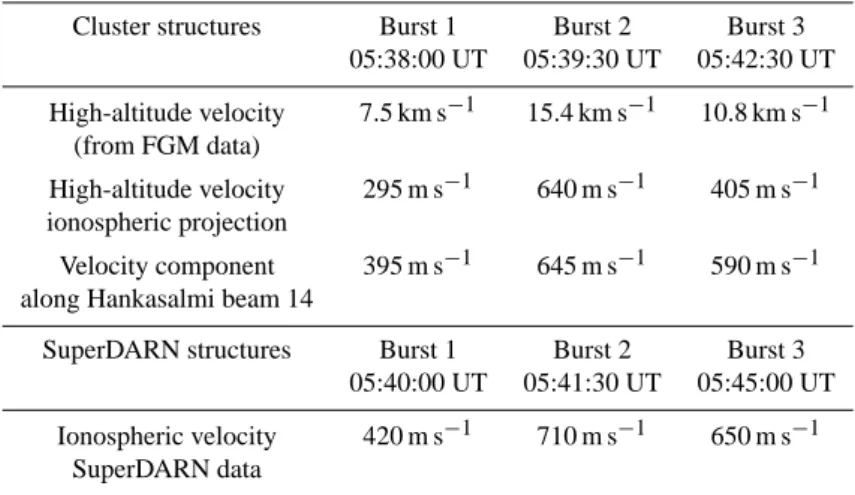
Table 1. Comparison of the velocity of plasma structures (phase velocity) measured by Cluster and SuperDARN. The Cluster velocity has
been deduced from FGM data (first row) and mapped into the ionosphere with T96 model (second row) and projected along beam 14 of the Hankasalmi radar (third row). The SuperDARN phase velocity is deduced from the slope of the backscattered power in the range-time plot of beam 14 of the Hankasalmi radar (bottom row). The different observation times at Cluster and at SuperDARN is due to the propagation from the magnetosphere to the ionosphere
Cluster structures Burst 1 Burst 2 Burst 3
05:38:00 UT 05:39:30 UT 05:42:30 UT High-altitude velocity 7.5 km s−1 15.4 km s−1 10.8 km s−1 (from FGM data) High-altitude velocity 295 m s−1 640 m s−1 405 m s−1 ionospheric projection Velocity component 395 m s−1 645 m s−1 590 m s−1 along Hankasalmi beam 14
SuperDARN structures Burst 1 Burst 2 Burst 3
05:40:00 UT 05:41:30 UT 05:45:00 UT Ionospheric velocity 420 m s−1 710 m s−1 650 m s−1
SuperDARN data
does not allow one to separate clearly the first two. Only the third velocity burst is clearly separated by both instru-ments. Moreover, during this interval of negative velocities, a general decrease in the amplitude of the velocity is also observed by both instruments. The average velocity (panel 6(d)) is systematically larger when deduced from the CIS data (up to 1000 m s−1) than when measured by SuperDARN (up to 600 m s−1). This difference can possibly be explained by the uncertainty in the mapping of the static electric field from Cluster to the ionosphere and by the fairly large spatial smoothing in the SuperDARN data.
5.2 Velocity of plasma structures
Independent of convection velocity, we can also compare the velocity of plasma structures (hereafter named phase ve-locity) observed at Cluster and the velocity of correlated plasma structures in the ionosphere. This comparison is limited to the interval of duskward convection velocity be-tween 05:36 and 05:46 UT (Cluster time), during which well-defined plasma structures associated with the injections are detected. In the magnetosphere, the phase velocity of the plasma structures is deduced from the simultaneous four-point Cluster FGM data and in the ionosphere from the slope of the range-time SuperDARN power plots (Fig. 6). At the Cluster altitude, each drifting plasma structure is character-ized by mostly similar magnetic and particle signatures on the four spacecraft, assuming the size of the structure is larger than the spacecraft separation (∼600 km). Magnetic signatures from FGM have been preferred because of their higher time resolution and because the magnetic field vari-ations directly reflect the structure of the plasma injection tube (diamagnetism affecting the parallel component) and the presence of parallel currents (affecting the direction of the
magnetic field) (Southwood, 1987; Lockwood et al., 2001a). However, we have checked that the phase velocity deduced by the same method, but from the electron density profiles measured by the four WHISPER instruments, is very similar (not shown). We have chosen a coordinate system in which the z direction is along the mean field direction (averaged over a 2–3 min period around the event). The x and y di-rections are given by the maximum and minimum variance in the perpendicular component. Because Cluster is situated at about 8 RE, this coordinate system has been preferred to
the usual L, M, N system used when observations are made close to the magnetopause (Russell and Elphic, 1978).
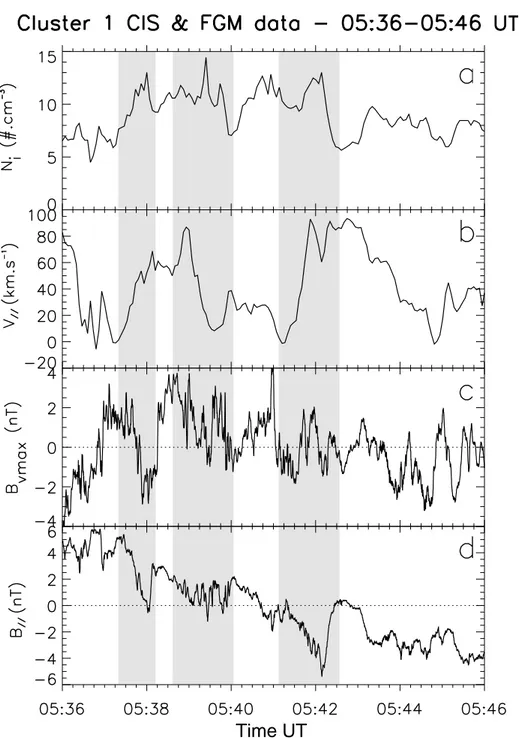
The parallel and maximum variance components, together with the ion density and parallel velocity given by CIS, are plotted for the 05:36–05:46 UT interval in Fig. 8. Three minima are observed in the parallel component of the mag-netic field (shaded zones) superposed on the large scale de-crease due to the motion of the spacecraft and correlated with density maxima. Each of them is associated with a bipo-lar signature in the perpendicubipo-lar component of the magnetic field, suggestive of a pair of field-aligned currents of opposite signs, and with a sharp gradient in the parallel velocity. All these signatures are typical of plasma injections and FTEs (Russell and Elphic, 1978; Paschmann et al., 1982).
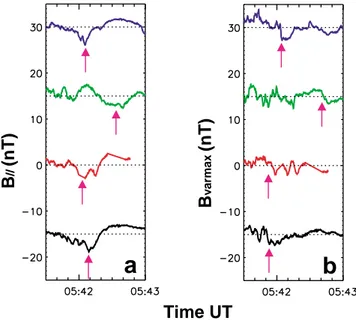
In order to calculate the phase velocity of these three struc-tures in the magnetosphere, we have identified similar fea-tures on each spacecraft. As an example, Fig. 9 shows the magnetic field signatures of the third event, in the direction of the mean magnetic field and in the direction of maximum perpendicular variance. Arrows on Fig. 9 show identified similar features. Assuming a plane structure with a uniform velocity through the four Cluster satellites, we determined the velocity of the plane along its normal from the time de-lay between the observation of similar signatures at the
dif-Figure 8
Time UT
Fig. 8. Plasma injection events observed at Cluster. (a) Ion density. (b) Ion parallel velocity. (c) Perpendicular component and (d) parallel
component of the magnetic field (see text).
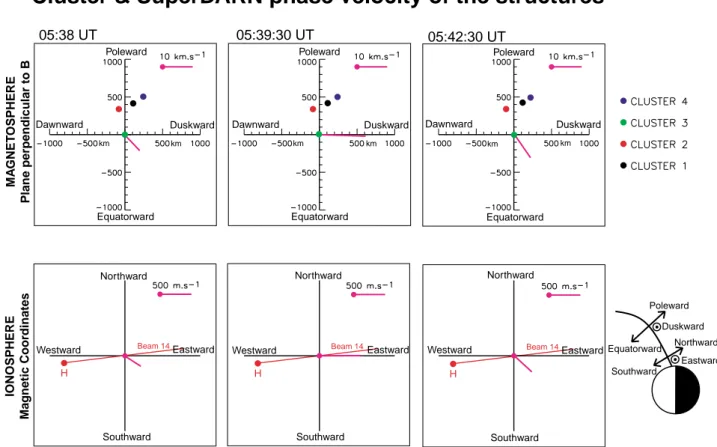
ferent spacecraft (Dunlop et al., 2002). This perpendicular velocity is then mapped into the ionosphere with the Tsyga-nenko T96 model. Finally, the Cluster projected velocity is compared with the velocity of the SuperDARN ionospheric signature of the flow burst by projecting the phase velocity along the Hankasalmi beam 14 and assuming a 2–3 min de-lay between the structures observed by Cluster and by Super-DARN (as for the plasma convection velocity). The results are presented in Fig. 10. The top row shows for each event the phase velocity at the Cluster location in the plane per-pendicular to the magnetic field, together with the relative
positions of the four spacecraft. The bottom row shows the velocity projected into the ionosphere with the direction of beam 14 of the Hankasalmi radar. The first and third struc-tures move equatorward and eastward, whereas the second structure moves essentially eastward. As it was the case for convection velocity, the Pikkvibær data cannot be used to de-termine a second component of the phase velocity, and there-fore, we are limited to one single component, along the Han-kasalmi beam 14 for the comparison. Table 1 shows the ve-locities at the different stages for each event. The first line gives the velocity in the magnetosphere, while the second
B
//(nT)
Time UT
B
v armax(nT)
a
b
Figure 9
Fig. 9. Cluster magnetic field variations around the burst at 05:42:30 UT (Burst 3 of Fig. 10). (a) Parallel component. (b) Per-pendicular component in the direction of maximum variance. The colour identification of the spacecraft is the same as for Fig. 1. Ar-rows indicate the time of observation of a similar variation at each spacecraft.
and the third lines give the velocity in the ionosphere and its component along the Hankasalmi beam 14. Notice that the apparent (phase) velocity of a plane structure along any direction is larger than the velocity along the normal to the structure. The last line gives the SuperDARN radial phase velocity obtained from a linear least-square fit to the slope of the backscattered power (Fig. 6b). Surprisingly, for all three events, the agreement between the two independent determi-nations of the phase velocity is excellent, owing to the large uncertainties (∼20%) of each determination.
6 Discussion
6.1 Plasma convection velocity and phase velocity of the flow events
In the Southwood (1987) model of the ionospheric signature of FTEs, the plasma convection velocity is equal to the ve-locity of the flux tube, because of plasma incompressibility. Any discrepancy between these two velocities should then be attributed to a phase effect, for instance, related to the motion of the reconnection site on the magnetopause. From SuperDARN, the plasma convection velocity inside the three flow events remains relatively stable in amplitude between 350 and 500 m s−1, and the phase velocity is between 400 and 700 m s−1(see Table 1). Therefore, the plasma convec-tion velocity is almost equal to the phase velocity for the first flow burst and is half of it for the last two events. These re-sults are in good agreement with those obtained by Provan et al. (1998) and particularly by McWilliams et al. (2001),
who also found that during the first half of the lifetime of a pulsed ionospheric flow, its phase velocity is twice the con-vection velocity, with both velocities being measured in the ionosphere. The main difference between our results and the two papers listed above is that in our case, there are lower values of the plasma flow and phase velocities, which can be explained by the low solar wind pressure associated with the dominant northward IMF. On the contrary at Cluster, the plasma velocity measured by CIS appears larger than the phase velocity in two of the bursts (respectively, 25 km s−1 and 20 km s−1in bursts 2 and 3) and slightly smaller in burst 1. So, the mean ratio between the plasma velocity and the phase velocity reverses between Cluster and the ionosphere. However, this result must be considered with care, owing to the fairly large uncertainty of the phase velocity determina-tions. Furthermore, the bursts observed at Cluster are char-acterised by large gradients in the plasma velocity.
6.2 Flow events dimensions
Here, we evaluate and compare the ionospheric dimensions of the three flow events. Using the power data of the Han-kasalmi radar, and by identifying the number of beams, as well as the number of gates for each beam where the struc-tures are observed, the north-south and east-west dimensions of the flux tubes can be obtained. Since the structures are observed on 2 beams and on 1 or 2 gates for each beam, their typical dimensions are about 300 km in the north-south direc-tion and 45–90 km in the east-west direcdirec-tion. Although these ionospheric dimensions are characteristic of reconnected flux tubes, the north-south elongation of the structures are un-usual (Provan et al., 1998; McWilliams et al., 2001). Be-cause the structures are moving in the east-west direction, the flow events move over the Cluster satellites along their smaller dimension. This result supports the hypothesis of a plane structure used for the determination of the phase veloc-ity at Cluster. At the Cluster altitude, the east-west smaller dimension of the reconnected flux tubes can be evaluated to
∼700–1500 km (given by the product of the phase velocity of the structure by the time during which Cluster remains inside the structure). Now, we can compare the east-west dimen-sion of each ionospheric structure observed by the radar with the dimension deduced from Cluster data and mapped into the ionosphere. The ionospheric dimension in the east-west direction of each injection, as deduced from Cluster data, is
∼30 km for the first, ∼60 km for the second, and ∼40 km for the third. These dimensions are slightly smaller than those determined from the SuperDARN data, but owing to their poor spatial resolution, the comparison is quite satisfactory and adds consistency to the comparison between the convec-tion and phase velocities made in the previous secconvec-tions. 6.3 Global ionospheric convection and location of the
re-connection site
In order to replace the previous results with respect to the large-scale ionospheric flow pattern and then to infer the
lo-Poleward Equatorward Duskward Dawnward km km Poleward Equatorward Duskward Dawnward km km Poleward Equatorward Duskward Dawnward km km Northward Southward Eastward Westward Beam 14 H Northward Southward Eastward Westward Beam 14 H Northward Southward Eastward Westward Beam 14 H IONOSPHERE Ma gnetic Coor dinates MA GNET OSPHERE Plane perpendicular to B 05:38 UT 05:39:30 UT 05:42:30 UT Southward Northward Poleward Equatorward Eastward Duskward
Figure 10
Cluster & SuperDARN phase velocity of the structures
Fig. 10. Phase velocity vector of three injections events determined from Cluster FGM and associated with flow bursts observed by
Super-DARN. Top: at the Cluster location in the plane perpendicular to the magnetic field and in GSE coordinates with the relative position of the four spacecraft. Bottom: projection of the Cluster velocity into the ionosphere in AACGM coordinates. The direction of beam 14 of the Hankasalmi radar at the Cluster footprint is also shown.
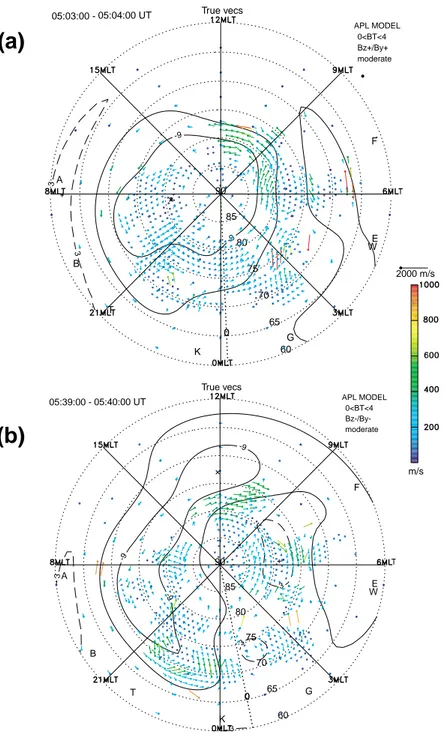
cation of the reconnection site, we have employed the “map potential” technique developed by Ruohoniemi and Baker (1998). This technique yields large-scale global convec-tion maps from the l-o-s velocity measurements by multi-ple radars, via mathematical fitting of the data, to an ex-pansion of the electrostatic potential in spherical harmonics. First, the l-o-s data are filtered and then mapped onto a polar grid. These “gridded” measurements are then used to deter-mine the most consistent electrostatic potential distribution. The iso-potential lines represent the plasma streamlines of the convection. Since l-o-s velocity measurements are not always available, information from the statistical model of Ruohoniemi and Greenwald (1996), parameterised by IMF conditions, is used to stabilise the solution where no mea-surements are made. Two of these global maps are plotted in Fig. 11 to show the variations of the global ionospheric convection.
During the interval 04:40–05:25 UT, when the IMF Byand
Bzare positive, before the observations described in this
pa-per, the Cluster footprint is located close to the Hankasalmi radar echoes, and both instruments observe repeated plasma injection signatures. These injections observed by Cluster were already mentioned in Sect. 4.2. The global convection map at 05:03–05:04 UT (Fig. 11a) shows an almost
circu-lar clockwise cell, centred close to the magnetic pole. The convection velocity is largest in the dawn sector between 06:00 and 12:00 MLT. The plasma in the cusp region around noon is purely dawnward, indicating the strong control of the dayside convection by the positive IMF By component.
Since the IMF Bzcomponent is positive, this central cell can
be the lobe cell driven by reconnection on the high-latitude magnetopause, tailward of the cusp region, as expected from the anti-parallel merging concept of the associated three-cell model of Cowley and Lockwood (1992) for positive IMF By
and Bz. From this model, the reconnection site is probably
located on the dusk side of the northern lobe. Two classical viscous cells are also expected on both sides of a single lobe cell. In Fig. 11a, only the dawn side cell is clearly observed, probably because very few radar echoes are obtained on the dusk side ionosphere below 75◦MLAT. The reduced size of the polar cap and the small convection velocity, both due to the northward IMF, can explain why the radars do not de-tect the sunward return flow on the equatorward sides of the two viscous cells expected around 75◦MLAT, between 03:00 and 09:00 MLT on the morningside and between 15:00 and 21:00 MLT on the eveningside.
Between 05:27 and 05:37 UT, an important reorganisation of the convection occurs, with a strong decrease in the plasma
0 0 60 65 70 75 80 85 90 A F B G T E K W -9 -9 -9 3 3 3 3 APL MODEL 0<BT<4 Bz-/By-moderate True vecs 05:39:00 - 05:40:00 UT 2000 m/s m/s F 0 0 60 65 70 75 80 85 90 A F B G T E K W -9 -9 3 3 APL MODEL 0<BT<4 Bz+/By+ moderate True vecs 05:03:00 - 05:04:00 UT
(a)
(b)
Fig. 11. Global convection velocity maps deduced from SuperDARN data of the Northern Hemisphere radars ac-cording to the method of Ruohoniemi and Baker (1998), at two selected times for (a) IMF By > 0 and (b) IMF By<0. The black solid lines
repre-sent the equipotential contours and the colour dots represent the grid points where the convection vectors are deter-mined.
velocity in the cusp region, probably associated with the By
turning, which is observed both by SuperDARN (not shown) and Cluster (Vontrat-Reberac et al., 2003). Then between 05:37 and 05:48 UT, during the time interval studied in this paper, the convection velocity in the cusp increases again but the ionospheric flow turns suddenly duskward, as shown by the global convection map at 05:39–05:40 UT in Fig. 11b. In particular, the flow bursts in the polar cusp are injected in the pre-noon sector between 11:00 and 12:00 MLT and are dragged duskward. Moreover, a large duskside cell is also observed with a clear crescent-shape due to magnetic tension effect. These observations confirm that even during this
pe-riod of negative Bz, the global dayside convection
contin-ues to be controlled by the IMF By. Several other
charac-teristics are in agreement with a negative IMF Bz, such as
the lower latitude (74◦MLAT) of the flow bursts appearance, the global convection pattern extending to slightly lower lat-itudes in the dayside and displaying the well-known two-cell circulation. These observations support a reconnection on the low-latitude dayside magnetopause. However, the phase velocity of two of the flow bursts determined from Cluster data (Fig. 10) shows a southward component, which could be interpreted as indicating a reconnection site on the high-latitude magnetopause, tailward of the cusp (Maezawa, 1976;
Crooker, 1979; Sandholt et al., 1992). A possibility is that because the convection is clearly controlled by the IMF By,
the reconnection site could be located on the dawn flank of the magnetopause (|By| > |Bz|) (Crooker, 1979, 1988) and
neither on the high- nor on the low-latitude magnetopause. After 05:48 UT, the convection velocity in the cusp turns dawnward again. A clockwise central cell reappears with the same characteristics as during the interval 04:40–05:27 UT, confirming the return to a positive IMF Byand Bzconvection
pattern and a reconnection site on the high-latitude magne-topause.
7 Conclusion
A conjunction between the Cluster spacecraft in the dayside external cusp and the SuperDARN radars in the ionosphere allows one to compare the plasma convection velocity and the drift velocity of plasma injection structures at the two lo-cations. We have first compared convection velocity in the magnetosphere and in the ionosphere. The convection pat-tern is dominated by the IMF By component and reacts
al-most instantaneously to its variations. The comparison be-tween the convection directions at both locations is satisfac-tory, if one assumes a 2–3 min delay between the cusp at 7–8 RE altitude and the ionosphere. The convection
veloc-ity measured at Cluster after mapping into the ionosphere, is systematically about 1.5 times larger than at SuperDARN, but the relative variations are at both locations very consis-tent.
The most important result is the clear one-to-one corre-lation observed between three successive particle injection structures, each associated with magnetic bipolar signatures typical of FTEs, and three subsequent bursts of enhanced convection observed in the ionosphere. The best correla-tion is achieved when a time delay of 2–3 min is applied between the 7–8 RE altitude and the ionosphere.
Evalua-tion of the drift (phase) velocity at Cluster (7.5–15 km s−1, or 400–600 m s−1when mapped into the ionosphere) and of the phase velocity of the associated flow bursts in the ionosphere gives similar results. From SuperDARN measurements, de-pending on the flow bursts, the phase velocity varies from equal to twice the convection velocity and is in agreement with previous works (Provan et al., 1998; McWilliams et al., 2001). On the contrary at Cluster, the phase velocity is smaller than the convection velocity. The size of reconnected flux tubes at Cluster and of their elongated counterpart in the ionosphere has been evaluated. From SuperDARN HF radar, the size at ionospheric altitudes is of the order of 45–90 km in the east-west direction and elongated up to ∼300 km in the north-south direction. The ionospheric east-west dimen-sions evaluated at Cluster are consistent, although smaller (30–60 km). Thus, we may suggest that, during a ∼15-min interval of IMF pointing southward-dawnward, simultaneous magnetospheric transient observations at Cluster, i.e. spo-radic particle injections within newly-opened flux tubes mov-ing eastward, and in the ionosphere, i.e. transient flow bursts
moving duskward, are related signatures of a pulsed netic reconnection occurring on the dawn flank of the mag-netopause.
Acknowledgements. The authors are grateful to the Principal
Inves-tigators, A. Balogh, (FGM), A. Fazakerley (PEACE), G. Gustafsson (EFW), G. Paschmann (EDI) and, H. R`eme (CIS), for providing the Cluster data. The authors acknowledge A. Vontrat-Reberac for helpful discussions. The CUTLASS HF radars are deployed and operated by the University of Leicester, and are jointly funded by the UK Particle Physics and Astronomy Research Council (grant number PPA/R/R/1997/00256), the Finnish Meteorological Insti-tute, and the Swedish Institute of Space Physics. The authors ac-knowledge the principal investigator N. Ness and the ACE Science Center for providing the ACE magnetic field data.
Topical Editor T. Pulkkinen thanks two referees for their help in evaluating this paper.
References
Aparicio, B., Thelin, B., and Lundin, R.: The polar cusp from a particle point of view: a statistical study based on Viking data, J. Geophys. Res., 96, 14 023–14 031, 1991.
Baker, K. B. and Wing, S.: A new magnetic coordinate system for conjugate studies at high latitudes, J. Geophys. Res., 94, 9139– 9143, 1989.
Balogh, A., Carr, C. M., Acu˜na, M. H., Dunlop, M. W., Beek, T. J., Brown, P., Fornac¸on, H., Georgescu, E., Glassmeier, K.-H., Harris, J., Musmann, G., Oddy, T., and Schwingenschuh, K.: The CLUSTER Magnetic Field Investigation: overview of in-flight performance and initial results, Ann. Geophysicae, 19, 1207–1217, 2001.
Berchem, J. and Russell, C. T.: Flux transfer events on the magne-topause: spatial distribution and controlling factors, J. Geophys. Res., 89, 6689–6703, 1984.
Bosqued, J. M., Phan, T. D., Dandouras, I., Escoubet, C. P., R`eme, H., Balogh, A., Dunlop, M. W., Alcayd´e, D., Amata, E., Bavassano-Cattaneo, M.-B., Bruno, R., Carlson, C., DiLellis, A. M., Eliasson, L., Formisano, V., Kistler, L. M., Klecker, B., Ko-rth, A., Kucharek, H., Lundin, R., McCarthy, M., McFadden, J. P., M¨obius, E., Parks, G. K., and Sauvaud, J.-A.: CLUSTER observations of the high-latitude magnetopause and cusp: ini-tial results from the CIS ion instruments, Ann. Geophysicae, 19, 1545–1566, 2001.
Burch, J. L.: Quasi-neutrality in the polar cusp, Geophys. Res. Lett., 12, 469–472, 1985.
Cowley, S. W. H., Morelli, J. P., and Lockwood, M.: Dependence of convective flows and particle precipitation in the high-latitude dayside ionosphere on the X and Y components of the interplan-etary magnetic field, J. Geophys. Res., 96, 5557–5564, 1991. Cowley, S. W. H. and Lockwood, M.: Excitation and decay of
so-lar wind-driven flows in the magnetosphere-ionosphere system, Ann. Geophysicae, 10, 103–115, 1992.
Crooker, N. U.: The magnetospheric boundary layers: a geometri-cally explicit model, J. Geophys. Res., 82, 3629–3633, 1977. Crooker, N. U.: Dayside merging and cusp geometry, J. Geophys.
Res., 84, 951–959, 1979.
Crooker, N. U.: Mapping the merging potential from the magne-topause to the ionosphere through the dayside cusp, J. Geophys. Res., 93, 7338–7344, 1988.
D´ecr´eau, P. M. E., Fergeau, P., Krasnoselskikh, V., Le Guirriec, E., L´evˆeque, M., Martin, Ph., Randriamboarison, O., Rauch, J. L., Sen´e, F. X., S´eran, H. C., Trotignon, J. G., Canu, P., Cornil-leau, N., de F´eraudy, H., Alleyne, H., Yearby, K., M¨ogensen, P. B., Gustafsson, G., Andr´e, M., Gurnett, D. C., Darrouzet, F., Lemaire, J., Harvey, C. C., Travnicek, P., and Whisper experi-menters: Early results from the Whisper instrument on Cluster: an overview, Ann. Geophysicae, 19, 1241–1258, 2001.
Dunlop, M. W., Balogh, A., and Glassmeier, K.-H.: Four-point Cluster application of magnetic field analysis tools: the discontinuity analyzer, J. Geophys. Res., 107, 1385, doi:10.1029/2001JA005089, 2002.
Eastman, T. E., Hones, Jr., E. W., Bame, S. J., and Asbridge, J. R.: The magnetospheric boundary layer: site of plasma, momentum and energy transfer from the magnetosheath into the magneto-sphere, Geophys. Res. Lett., 3, 685–688, 1976.
Elphic, R. C., Lockwood, M., Cowley, S. W. H., and Sandholt, P. E.: Flux Transfer Events at the magnetopause and in the ionosphere, Geophys. Res. Lett., 17, 2241–2244, 1990.
Etemadi, A., Cowley, S. W. H., Lockwood, M., Bromage, B. J. I., and Willis, D. M.: The dependence of high-latitude dayside iono-spheric flows on the north-south component of the IMF – A high time resolution correlation analysis using EISCAT ‘Polar’ and AMPTE UKS and IRM data, Planet. Space. Sci., 36, 471–498, 1988.
Farrugia, C. J., Rijnbeek, R. P., Saunders, M. A., Southwood, D. J., Rodgers, D. J., Smith, M. F., Chaloner, C. P., Hall, D. S., Chris-tiansen, P. J., and Woolliscroft, L. J. C.: A multi-instrument study of flux transfer event structure, J. Geophys. Res., 93, 14 465– 14 477, 1988.
Fuselier, S. A., Lockwood, M., Onsager, T. G., and Peterson, W. K.: The source population for the cusp and cleft/LLBL for southward IMF, Geophys. Res. Lett., 26, 1665–1668, 1999.
Goertz, C. K., Nielsen, E., Korth, A., Glassmeier, K.-H., Hal-doupis, C., Hoeg, P., and Hayward, D.: Observations of a pos-sible ground signature of flux transfer events, J. Geophys. Res., 90, 4069–4078, 1985.
Greenwald, R. A., Baker, K. B., Dudeney, J. R., Pinnock, M., Jones, T. B., Thomas, E. C., Villain, J.-P., Cerisier, J.-C., Senior, C., Hanuise, C., Hunsucker, R. D., Sofko, G., Koehler, J., Nielsen, E., Pellinen, R., Walker, A. D. M., Sato, N., and Yamagishi, H.: Darn/SuperDARN: a global view of the dynamics of high-latitude convection, Space Sci. Rev., 71, 761–796, 1995. Gustafsson, G., Andr´e, M., Carozzi, T., Eriksson, A. I., F¨althammar,
C.-G., Grard, R., Holmgren, G., Holtet, J. A., Ivchenko, N., Karlsson, T., Khotyaintsev, Y., Klimov, S., Laakso, H., Lindqvist, P.-A., Lybekk, B., Marklund, G., Mozer, F., Mur-sula, K., Pedersen, A., Popielawska, B., Savin, S., Stasiewicz, K., Tanskanen, P., Vaivads, A., and Wahlund, J.-E.: First results of electric field and density observations by Cluster EFW based on initial months of operation, Ann. Geophysicae, 19, 1219–1240, 2001.
Haerendel, G., Paschmann, G., Sckopke, N., Rosenbauer, H., and Hedgecock, P. C.: The frontside boundary layer of the magne-topause and the problem of reconnection, J. Geophys. Res., 83, 3195–3216, 1978.
Johnstone, A. D., Alsop, C., Burge, S., et al.: ‘PEACE: a Plasma electron and current experiment’, Space Sci. Rev., 79, 351–398, 1997.
Lockwood, M., Cowley, S. W. H., Sandholt, P. E., and Lepping, R. P.: The ionospheric signatures of flux transfer events and solar wind dynamic pressure changes, J. Geophys. Res., 95, 17 113–
17 135, 1990.
Lockwood, M. and Smith, M. F.: The variation of reconnection rate at the dayside magnetopause and cups ion precipitation, J. Geo-phys. Res., 97, 14 841–14 847, 1992.
Lockwood, M., Milan, S. E., Onsager, T., Perry, C. H., Scudder, J. A., Russell, C. T., and Brittnacher, M.: Cusp ion steps, filed-aligned currents and poleward auroral forms, J. Geophys. Res., 106, 29 555–29 569, 2001a.
Lockwood, M., Opgenoorth, H. J., van Eyken, A. P., et al.: Coor-dinated Cluster, ground-based instrumentation and low-altitude satellite observations of transient poleward-moving events in the ionosphere and in the tail lobe, Ann. Geophysicae, 19, 1589– 1612, 2001b.
Lockwood, M., Fazerkerley, A., Opgenoorth, H. J., et al.: Coordi-nated Cluster and ground-based instrument observations of tran-sient changes in the magnetopause boundary layer during an in-terval of predominantly northward IMF: relation to reconnection pulses and FTE signatures, Ann. Geophysicae, 19, 1613–1640, 2001c.
Maezawa, K.: Magnetospheric convection induced by the positive and negative Z components of the interplanetary magnetic field: quantitative analysis using polar cap magnetic records, J. Geo-phys. Res., 81, 2289–2303, 1976.
McWilliams, K. A., Yeoman, T. K., and Provan, G.: A statistical survey of dayside pulsed ionospheric flows as seen by the CUT-LASS Finland HF radar, Ann. Geophysicae, 18, 445–453, 2000. McWilliams, K. A., Yeoman, T. K., and Cowley, S. W. H.: Two-dimensional electric field measurements in the ionospheric foot-print of a flux transfer event, Ann. Geophysicae, 18, 1584–1598, 2001.
Milan, S. E., Lester, M., Cowley, S. W. H., and Brittnacher, M.: Convection and auroral response to a southward turning of the IMF: Polar UVI, CUTLASS, and IMAGE signatures of transient magnetic flux transfer at the magnetopause, J. Geophys. Res., 105, 15 741–15 755, 2000.
Neudegg, D. A., Yeoman, T. K., Cowley, S. W. H., Provan, G., Haerendel, G., Baumjohann, W., Auster, U., Fornac¸on, K.-H., Georgescu, E., and Owen, C. J.: A flux transfer event observed at the magnetopause by the Equator-S spacecraft and in the iono-sphere by the CUTLASS HF radar, Ann. Geophysicae, 17, 707– 711, 1999.
Neudegg, D. A., Cowley, S. W. H., Milan, S. E., Yeoman, T. K., Lester, M., Provan, G., Haerendel, G., Baumjohann, W., Nikutowski, B., B¨uchner, J., Auster, U., Fornac¸on, K.-H., and Georgescu, E.: A survey of magnetopause FTEs and associated flow bursts in the polar ionosphere, Ann. Geophysicae, 18, 416– 435, 2000.
Newell, P. T. and, Meng, C.-I.: The cusp and the cleft/boundary layer: low-altitude identification and statistical local time varia-tion, J. Geophys. Res., 93, 14 549–14 556, 1988.
Newell, P. T., Meng, C.-I., Sibeck, D. G., and, Lepping, R.: Some low-altitude cusp dependencies on the interplanetary magnetic field, J. Geophys. Res., 94, 8921–8927, 1989.
Opgenoorth, H. J., Lockwood, M., Alcad´e,D., et al.: Coordinated ground-based, low altitude satellite and Cluster observations on global and local scales during a transient post-noon sector excur-sion of the magnetospheric cusp Ann. Geophysicae, 19, 1367– 1398, 2001.
Owen, C. J., Fazakerley, A. N., Carter, P. J., Coates, A. J., Krauk-lis, I. C., Szita, S., Taylor, M. G. G. T., Travnicek, P., Watson, G., Wilson, R. J., Balogh, A., and Dunlop, M. W.: CLUS-TER PEACE observations of electrons during magnetosheric