HAL Id: tel-01599361
https://tel.archives-ouvertes.fr/tel-01599361
Submitted on 2 Oct 2017
HAL is a multi-disciplinary open access archive for the deposit and dissemination of sci-entific research documents, whether they are pub-lished or not. The documents may come from teaching and research institutions in France or abroad, or from public or private research centers.
L’archive ouverte pluridisciplinaire HAL, est destinée au dépôt et à la diffusion de documents scientifiques de niveau recherche, publiés ou non, émanant des établissements d’enseignement et de recherche français ou étrangers, des laboratoires publics ou privés.
coli in vivo by whole genome sequencing
Adrien Launay
To cite this version:
Adrien Launay. Study of the emergence of the diversity of Escherichia coli in vivo by whole genome sequencing. Bacteriology. Université Pierre et Marie Curie - Paris VI, 2016. English. �NNT : 2016PA066692�. �tel-01599361�
Thèse de Doctorat de L’université Pierre et Marie Curie - Paris IV Ecole doctorale Complexité du vivant CDV (ED 515)
UMR1137 - IAME : équipe QEM
Présenté Par :
Mr Adrien LAUNAY
Pour obtenir le grade de DOCTEUR de l’UNIVERSITE PARIS 6
ETUDE DE L'EMERGENCE DE LA DIVERSITE
D'ESCHERICHIA COLI IN VIVO PAR SEQUENÇAGE DE
GENOMES COMPLETS
Directeur de thèse : Olivier Tenaillon
Présenté et soutenue publiquement le 27 octobre 2016 Devant un jury composé de :
Dr P. GLASER - Président du jury Dr MA. JACQUES - Rapportrice Dr S. DA-RE - Rapportrice Dr G. ACHAZ - Examinateur Dr L. LANDRAU - Examinatrice Dr C. TINSLEY - Examinateur Dr O. Tenaillon - directeur de thèse
2
Je dédie ce travail à Brice
3
REMERCIEMENTS
Ce manuscrit représente le cheminement de 3 années de recherche, et de rebondissements. J’ai eu durant ces années la chance de pouvoir travailler sur le sujet de l’évolution qui me passionne depuis de nombreuses année. Les études d’évolution expérimentale, et Escherichia coli représentent pour moi une opportunité inégalable de véritablement observer l’évolution dans le vif du sujet. Ce projet m’a par conséquent particulièrement tenu à cœur, et je me dois de remercier tous les gens qui y ont participé directement comme indirectement.
Je tien tout d’abord à remercier particulièrement mon directeur de thèse Olivier, de m’avoir accueilli dans son équipe de recherche. Je le remercie pour sa supervision scientifique, ses conseils en informatiques et toutes les idées qu’il a pu me proposer (Bien qu’il m’ais parfois fallu un certain temps pour bien comprendre ce qui était demandé). Cette expérience a été très enrichissante tant sur le plan humain que scientifique.
Je tiens aussi à remercier tout particulièrement Erick Denamur pour sa précieuse aide, mais surtout pour son accueil chaleureux, au sein de ce qui allait devenir l’unité de recherche IAME.
Je tiens à remercier chaleureusement les membres de mon comité de thèse :
Philippe Glaser pour sa participation en tant que président du Jury, Sandra Da-Re et Marie Agnès Jacques qui ont accepté d’être mes deux rapportrices, Colin Tinsley et Luce Landreau pour leur participation a ce jury, et Guillaume Achaz pour son aide tout au long de ma thèse.
Merci aussi à tous les membres des équipes 1 et 2 de IAME pour ce qu'ils m'ont apporté scientifiquement mais aussi personnellement: Alejandro pour les cours d'espagnol, Alexandra pour son énergie, Harry pour les corrections d'anglais, Mélanie pour les corrections de français, Mohamed pour les discussions interminables, Meril, pour les bons moments, André, Audrey, Jérémie et Marine pour leur bonne humeur, Herve Lenagar pour son aide en informatique, Olivier Clermont, Herve Jaquier, Jean Paul Feugeas et Mathilde pour leur soutien. De même, je tiens à remercier Edouardo Rocha pour ses conseils avisés durant mes deux comités qui m’ont guidé et permis de peaufiner ma thèse.
4 Je tiens aussi, bien entendus, à remercier ma famille française et mexicaine et plus particulièrement mes deux parents et ma sœur sans qui tout cela n'aurait pas été possible. Merci de m'avoir donné le goût de la science et de m'avoir soutenu dans cette voie toutes ces années.
Merci à Alheli, ma merveilleuse femme, qui m’a supporté pendant ces trois années, et m’a apporté calme et réconfort au travers des meilleurs comme des plus mauvais moments.
Merci à mes amis pour les moments de détentes partagés, autour de quelques verres, ou de quelques jeux de société. Merci aux magisteriens et merci aux Palaisiens. Merci Benoit et Raphoo pour les jams sessions endiablés.
5
T
ABLE DES MATIERES
Remerciements ... 3
Table des matières ... 5
List of abbreviations: ... 8
I - INTRODUCTION ... 9
1 E. coli: from ecology to genomics... 10
1.1 E. coli a commensal of the gut of vertebrates ... 10
1.2 E. coli a versatile pathogen ... 11
1.2.1 E. coli are responsible for intra intestinal infections ... 11
1.2.2 E. coli are responsible for extra intestinal infections ... 14
1.3 E. coli a structured species ... 15
1.3.1 Variability in strain carriage as commensals ... 17
1.3.2 Variability among pathogenic isolation ... 17
1.4 E. coli genome ... 18
1.4.1 Core genome and pan genome ... 18
1.4.2 Difference in gene content and adaptation ... 19
1.4.3 Difference in conserved genes and adaptation ... 20
2 In vitro experimental evolution: ... 22
2.1 The different types of in vitro experimental evolution ... 22
2.2 Long term evolution experiment (LTEE) ... 23
2.3 Fitness improvement ... 24
2.4 Mutator selection ... 25
2.5 Genetics of mutation rate ... 26
2.5.1 Control of mutation rate ... 26
2.5.2 Selection for and against increased mutation rate ... 29
2.6 Molecular bases of adaptation ... 30
6
2.6.2 Clonal interference ... 31
2.6.3 Recruitment of mutations in global regulators ... 31
3 Short term evolution in vivo and objectives ... 36
3.1 Evolution in the mice ... 36
3.2 Evolution in human ... 37
3.3.1 Chronic infections ... 37
3.3.2 Acute infections ... 40
3.3.3 Commensal evolution ... 41
3.4 Objectives ... 42
4 Next generation sequencing (NGS) ... 43
4.1 Sequencing technologies ... 43
4.1.1 Sanger Sequencing ... 43
4.1.2 Next generation sequencing principle: the case of 454 ... 44
4.1.2 Next generation sequencing’s various technologies ... 48
4.2 Bioinformatics of genomics ... 50
4.2.1 With reference genome: alignment and SNP calling algorithms ... 51
4.2.2 – Assembly of genome when there are no clear reference genome ... 54
4.3 Computational challenges for bacterial sequencing and repeated regions ... 57
4.3.1 Mapping and repetitions ... 57
4.3.2 Assembly and repetitions ... 58
4.4 NGS for the study of the ecology and evolution of E. coli ... 59
II - EXPERIMENTAL EVOLUTION OF NATURAL STRAINS OF E. COLI IN A COMMENSAL ENVIRONMENT: THE MICE GUT MODEL ... 64
1 E. coli experimental evolution in the mice gut ... 65
2. Article n°1 ... 67
2.1 Abstract. ... 68
2.2 Background. ... 69
7
2.5 Results... 75
2.6 Discussion ... 81
2.7 Figures and tables. ... 87
2.8 Suplementary data ... 94
III - E. COLI EVOLUTION IN HUMANS: THE CASE OF ACUTE INFECTIONS ... 100
1. Evolution of E. coli during acute infection: ... 101
2. Article n°2 ... 103
2.1 Abstract: ... 104
2.2 Background ... 105
2.3 Materials and Methods ... 108
2.4 Results and discussion ... 113
2.5 Conclusion ... 123
2.6 Figures ... 125
2.7 Suplementary data ... 130
IV - DISCUSSION... 145
1. E. coli experimental evolution: getting outside the lab ... 146
2. Evolution in commensal environment ... 146
3. Adaptation during acute infections... 147
4. Perspectives: ... 149
Supplementary studies ... 151
nhaAR operon and the nhaA phylogeny ... 151
The CC87 and its specific genes ... 153
RESUME EN FRANCAIS: ... 155
1 Evolution expérimentale chez la souris : ... 157
2 Evolution lors d’infection aigüe ... 158
Bibliography ... 161
RESUME : ... 176
8
LIST OF ABBREVIATIONS:
SNP Single nucleotide polymorphsimes RA Read alignment evidence
MMR Methyl directed miss-match repair JC New Junction evidence
MC Missing coverage
EXPEC Extra intestinal pathogenic E. coli EHEC Enterohaemoragic E. coli
EIEC Enteroinvasives E. coli ETEC Enterotoxigenic E. coli EAEC Enteroaggregative E. coli DAEC diffusely adherent E. coli EPEC Enteropathogenic E. coli UPEC Uropathogenic E. coli UTI Urinary tract infection CRF Cerebrospinal fluid
LTEE Long term evolution experiment ABU Asymptomatic bacteriuria strains NGS Next generation sequencing dNTPs deoxynucleosidetriphosphates ddNTPs di- deoxynucleosidetriphosphates MLST Multilocu sequence typing LB lysogeny broth
K Killer
NK Non killer
10
1
E.
COLI
: FROM ECOLOGY TO GENOMICS
Amongst all the model organisms in biological studies, E. coli, and more specifically the K12 strain, remains one of the most used and studied. Since its discovery, it has been analyzed in depth and is now the most characterized bacteria. This success is linked to the ease with which E. coli can be cultivated in the laboratory and to the fact that it is amenable to genetic modifications, making it a first choice tool for biotechnologies. E. coli was used to discover bacterial conjugation in 1946, by Joshua Lederberg and Edward Tatum (Lederberg and Tatum, 1946), and has been at the heart of the development of modern genetics, allowing, for instance, Seymour Benzer to show that the gene is not an indivisible entity, as previously believed, and that they were furthermore linear(Benzer, 1959). More genetics and biochemical studies along the years allowed for the high quality annotation and understanding of the genome of the E. coli K12 laboratory strain. Besides its role in the laboratory and in biotechnologies, the ecological interaction of the E. coli species with human is also of great medical and scientific interest.
1.1 E. coli a commensal of the gut of vertebrates
E. coli is a gram negative, nonsporulating, and facultative anaerobe bacterium inhabiting the
lower intestine of warm blooded animals and reptiles. It seems to have a special relationship with human: its prevalence is more than 90% in that host, but only 56% in wild animals, 23% in birds and 10% in reptiles (Gordon and Cowling, 2003). As a member of the gut microbiota, E. coli is the predominant aerobic organism in the large intestine, especially in the caecum and the colon, where it is encountered in the mucus layer. E. coli metabolism is adapted to this ecological niche from which it extracts nutrients, most notably gluconate (Tenaillon et al., 2010). E. coli’s doubling time is ranging from around 30 minutes in vitro to 120 minutes in its natural environment. The difference between the two conditions is partly explained by the fact that inside the gut, all the species forming the microbiota have to compete for the resources provided by the intestines. The natural environment of
E. coli is therefore defined by the gut microbiota, the properties of the host digestive tract and its diet.
The host is a resource provider as well as a mean of transport and dissemination. As such, the ecological interaction between E. coli and its host can be categorized as commensalism: one of the two organisms (the bacteria) benefits from the interaction, while the other (the host) is neither notably
11
harmed nor helped by it. However, with a more detailed analysis, E. coli can be considered as a somewhat helping factor for the host as it protects it against colonization by gut-pathogens, thanks to its competitive characteristics, and through the production of bacetriocins (Vollaard and Clasener, 1994). E. coli was also proved to help in the production of vitamins (Bentley and Meganathan, 1982), and for the stimulation of the immune system (Nowrouzian et al., 2003). The relationship between E.
coli and its host can therefore be connected to “mutualism”.
1.2 E. coli a versatile pathogen
E. coli is a multiple faced species. In fact, it can also be qualified as the “enemy within”, as it
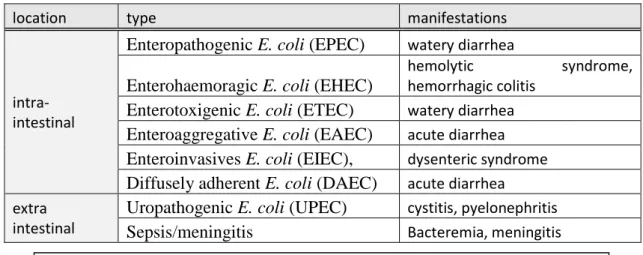
turns out in any case to be a dangerous pathogen. The afflictions caused by E. coli are classified in mainly two syndromes: intraintestinal diseases (enteric/diarrheal diseases), and extraintestinal diseases (urinary tract infections (UTI) and sepsis/meningitis) (table 1). Each year, E. coli causes about a million deaths due to diarrhea in infants (Kosek et al., 2003; Kotloff et al., 1999) and extraintestinal infections (Russo and Johnson, 2003). Moreover, E. coli is also responsible for approximately 150 million cases of uncomplicated cystitis (Russo and Johnson, 2003).
location type manifestations
intra-intestinal
Enteropathogenic E. coli (EPEC) watery diarrhea
Enterohaemoragic E. coli (EHEC)
hemolytic syndrome,
hemorrhagic colitis
Enterotoxigenic E. coli (ETEC) watery diarrhea
Enteroaggregative E. coli (EAEC) acute diarrhea
Enteroinvasives E. coli (EIEC), dysenteric syndrome
Diffusely adherent E. coli (DAEC) acute diarrhea extra
intestinal
Uropathogenic E. coli (UPEC) cystitis, pyelonephritis
Sepsis/meningitis Bacteremia, meningitis
1.2.1 E. coli are responsible for intra intestinal infections
The strains responsible for intraintestinal infections are divided in six well characterized categories (Kaper et al., 2004). The enteropathogenic E. coli (EPEC) responsible of watery diarrhea
12
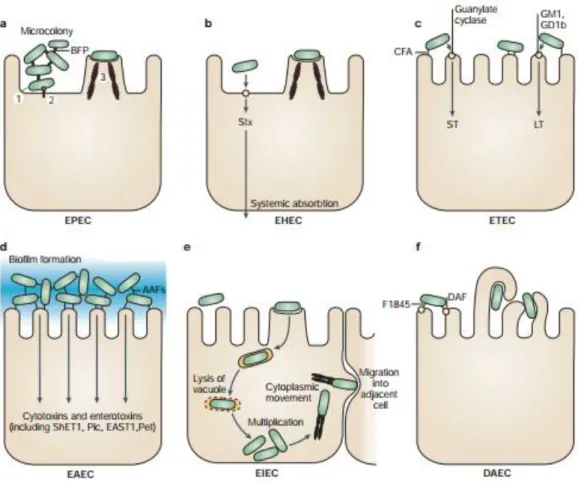
was the first E. coli pathotype described in 1945 in the United Kingdom (fig 1a). This type of E. coli tightly binds to the epithelial cells of the intestines and modifies its cytoskeleton creating a pedestal like shape. Similarly, the enterohaemoragic E. coli (EHEC) can modify the shape of the cells of the intestines, but also produce shiga toxins. It is generally found in the bovine intestinal tract, and can contaminate humans mainly through the consumption of undercooked meat, and raw vegetables (fig 1b). EHEC are responsible of bloody diarrhea as well as the life threatening complication: hemolytic uremic syndrome, particularly among children. The most frequent serogroup found among these strains, is E. coli O157:H7, however other serogroups have been described. EHEC O104:H4 for instance, was responsible for the mostly German outbreak in 2011 that provoked 53 deaths and over 4000 cases of bloody diarrhea. The putative source of contamination originated from some Egyptian organic fenugreek sprouts (Buchholz et al., 2011). The enterotoxigenic E.coli (ETEC) is responsible for traveler’s diarrhea that results from enterotoxin production (fig 1c). The enteroaggregative E.coli (EAEC) also produces enterotoxins and cytotoxines, but most notably creates a biofilm by stacking bacteria on one another on the epithelia. These strains are responsible of watery diarrhea in young children from developing countries. (fig 1d). The enteroinvasives E. coli (EIEC), are highly invasive strains that produce no toxins but use adhesion proteins to bind and enter the epithelial cells, multiply inside it and moves from adjacent cells to adjacent cells causing cell destructions (fig 1e). They are closely related to Shigellas, a group of E. coli that have acquired a virulence plasmid and that produce shiga toxins. They exhibit the same clinical syndrome as the Shigella ranging from a mild diarrhea to dysentery. Finally, the diffusely adherent E. coli (DAEC), induce the development of long cellular extensions that wraps around the adherent bacteria (fig 1f). These strains are associated with persistent diarrheas among children in developing countries.
13
Figure 1 Pathogenic schema of diarrhoeagenic E. coli. The six recognized categories of diarrhoeagenic E. coli each have unique features in their interaction with eukaryotic cells. Here, the interaction of each category with a typical target cell is schematically represented. These descriptions are largely the result of in vitro studies and might not completely reflect the phenomena that occurs in infected humans. a | EPEC adhere to small bowel enterocytes, but destroy the normal microvillar architecture, inducing the characteristic attaching and effacing lesion. Cytoskeletal derangements are accompanied by an inflammatory response and diarrhoea. 1. Initial adhesion, 2. Protein translocation by type III secretion, 3. Pedestal formation. b | EHEC also induce the attaching and effacing lesion, but in the colon. The distinguishing feature of EHEC is the elaboration of Shiga toxin (Stx), systemic absorption of which leads to potentially life-threatening complications. c | Similarly, ETEC adhere to small bowel enterocytes and induce watery diarrhoea by the secretion of heat-labile (LT) and/or heat-stable (ST) enterotoxins. d | EAEC adheres to small and large bowel epithelia in a thick biofilm and elaborates secretory enterotoxins and cytotoxins. e | EIEC invades the colonic epithelial cell, lyses the phagosome and moves through the cell by nucleating actin microfilaments. The bacteria might move laterally through the epithelium by direct cell-to-cell spread or might exit and re-enter the baso-lateral plasma membrane. f | DAEC elicits a characteristic signal transduction effect in small bowel enterocytes that manifests as the growth of long finger-like cellular projections, which wrap around the bacteria. AAF, aggregative adherence fimbriae; BFP, bundle-forming pilus; CFA, colonization factor antigen; DAF, decay-accelerating factor; EAST1, enteroaggregative E. coli ST1; LT, heat-labile enterotoxin; ShET1, Shigella enterotoxin 1; ST, heat-stable enterotoxin. (from Kaper et al, 2004)
14
1.2.2 E. coli are responsible for extra intestinal infections
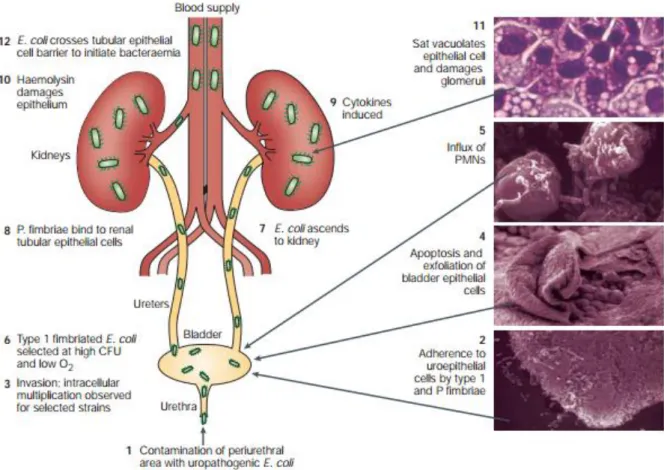
In addition to the intraintestinal pathologies, some E. coli (named ExPEC) also behave as opportunistic pathogens involved in extraintestinal diseases (fig2), making E. coli the most common infecting bacteria of the urinary tract. Indeed, E. coli infects every other woman at least once in her life (Russo and Johnson, 2003). In this type of infection, the Uropathogenic E. coli (UPEC) strains bind to urinary tract urothelial cells using type 1 fimbriae to colonize the bladder. The attachment then triggers apoptosis and exfoliation of the bladder epithelial cells.
In cystitis, the type I fimbriae is continually expressed and the infection is confined to the bladder, while in pyelonephritis the type I fimbriae expression is turned off which allows the organism to ascend through the ureter to the kidneys where it can attach by P fimbriae to receptors on the kidney epithelium, that end up being damaged by the haemolysin and other bacterial products.
E. coli can also cross the one cell thick blood barrier to cause a bacteremia. From the blood, E. coli can invade further the central nervous system especially in premature newborn for which the
full development of the brain barrier is not yet achieved. This results in neo-natal meningitis with a fatality rate of 15-40%, and severe neurological defects in the survivors. Finally, E. coli is responsible for bacterial pneumonia, spontaneous peritonitis and even ascending cholangitis (Russo and Johnson, 2003). These extraintestinal pathologies have long been neglected as a major public health, partly because of their versatility. However in 2003, a global study revealed that they could produce close to a million death a year and more than 100,000,000 hospitalizations worldwide (Russo and Johnson, 2003). All these factors make E. coli a public health enemy, and as not all the members of the species have the same propensity to produce different pathologies, it is of great interest to understand the underlying evolutionary mechanisms that rules its adaptation, and to understand what factors determines the pathogenicity and the life style of the strains.
15
1.3 E. coli a structured species
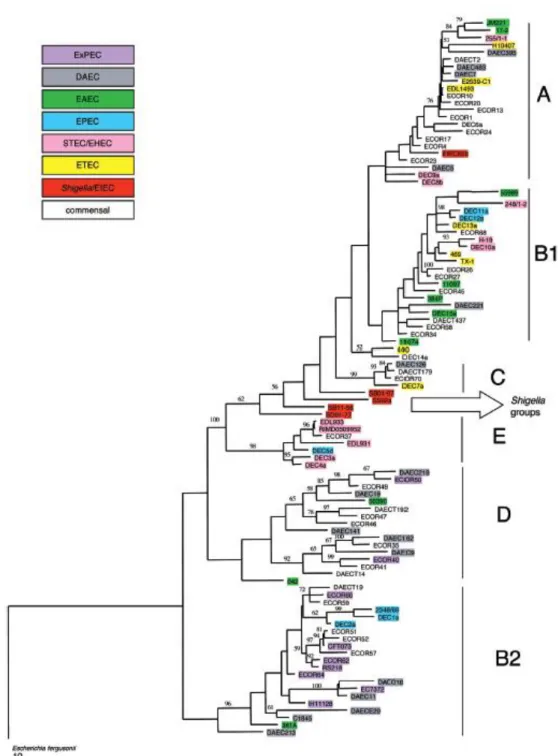
To study adaptation, an epidemiological approach can be used to track down the diversity of the species. Along those lines, the first step is to produce a phylogeny of the different E. coli known strains. Studies based on both multilocus enzyme electrophoresis and DNA markers allowed the identification of 4 main phylogenetic groups A, B1, D and B2 and a potential fifth group E (fig 3). With more genomics input and more strains, up to 7 groups have now been identified, adding groups C and F (Herzer et al., 1990). Interestingly these phylogenetic groups, or phylogroups, are also characterized by different profiles of isolation both as commensal and as pathogens suggesting an association between those groups and the different lifestyles of E. coli strains (Escobar-Paramo, 2004).
Figure 2: Pathogenesis of urinary tract infection caused by uropathogenic E.
coli. The figure shows the different stages of a urinary tract infection. Panels 2, 4,
5 and 11 are courtesy of N. Gunther, A. Jansen, X. Li and D. Auyer (University of Maryland), respectively. CFU, colony-forming units; PMNs, polymorphonuclear leukocytes. (from Kaper et al, 2004)
16
Fig 3: tree based on the simultaneous analysis of the trpA, trpB pabB, putP,
icd and polB using parsimony and rooted on E. fergusonii. Bootstrap values
higher than 50% are indicated above the nodes. The vertical bars delineate the major phylogenetic groups: A, B1, C, E, D, and B2.(from Escobar-Paramo, 2004)
17 1.3.1 Variability in strain carriage as commensals
The different E. coli phylogroups appear to be differentially distributed in the different commensal habitats. For instance the prevalence of the four main phylogroups varies significantly between humans and animals. In human, A group is predominant (40, 5%), followed by B2 strains (25, 5%), and lastly B1 and D that are the least represented (17% each). In animals it is the B1 strains that are dominant (41%), followed by A (22%), B2 (21%) and D with the lower prevalence (16%) (Tenaillon et al., 2010). Domesticated animals have also an increased proportion of A strains than their wild counterparts (from 14% in the wild to 27% in zoo animals), and less B2 (from 30% to 11% respectively). Further studies, showed that those observations could not be simply explained by the existence of a host specific strain, as only a low number of strains seemed to exhibit such a relation with their host. Indeed large variations in the prevalence of the different subgroups could also be found among human populations, suggesting that environmental factors were playing a major role in shaping the distribution of the subgroups. Comparative studies focusing on human (Duriez et al., 2001; Tenaillon et al., 2010) showed that commensal E. coli strains isolated from Europe in the 1980’s (France and Croatia), Asia (Pakistan), Africa (Mali and Benin), and South America (French Guiana, Colombia and Bolivia) belonged predominantly to the A (55%) and B1 (21%) groups, whereas strains from the D (14%) and B2 (10%) phylogroups were less common. On the other hand, strains isolated from Europe in the 2000’s (France and Sweden), Japan, North America (USA), and Australia belonged mainly to the B2 group (43%), followed by the A (24%), D (21%), and to a lesser extend B1 (12%) groups (table 2) (Escobar-Paramo, 2004). Here, we can clearly see a contrast between B2 prevalences, which is high in the industrialized countries, whereas it is lower in tropical countries. This observation was confirmed by the study of metropolitan French people that moved to French Guyana (Skurnik et al., 2008). Their E. coli phylogroup prevalence became somewhat intermediary between the two patterns, having a prevalence of A similar to metropolitan French people, and a prevalence of B2 similar to the one of the native resident. We could consider that those differences could be related to geographical localization or climate, but the shift in B2 proportion in France between 1980 and 2000, seems to favor socioeconomics factors, such as dietary or hygiene habits.
18
Associations could also be found between phylogroups and pathogenicity (Escobar-Paramo, 2004). Indeed it is obvious that ExPEC strains are clustered mostly in two phylogenetic groups, B2 and D (Duriez et al., 2001). Concerning intraintestinal pathogenic strains, we can see that the EPEC strains are distributed in two groups: B1 and B2. EHEC strains on the other hand are distributed among groups A and B1, but the major concentration of those strains are found in strains of serotype O157:H7 of group E. ETEC strains are found in groups A, B1, and C. Shigellas and EIEC strains are highly localized and represent highly specialized monophyletic groups. Lastly, DAEC and EAEC strains are more or less distributed all over the phylogroups, except in the E group (fig 3). With those observations, we can clearly see a relation between the life style of the strains and their phylogroups, but we can still wonder what the determinants of such behaviors are. Part of the answer came around the year 2000 and with the beginning of the sequencing era that gave a better understanding of the genome architecture of E. coli.
1.4 E. coli genome
1.4.1 Core genome and pan genome
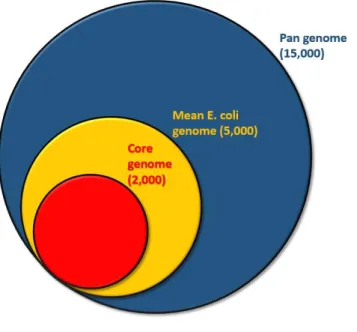
Even though E. coli is considered the preferred model for biochemical genetics, and was one of the earliest organisms suggested for whole genome sequencing, the K12 strain of E. coli was only the seventh organism to be fully sequenced. The first complete genome sequence of E. coli was published in 1997 (Blattner et al., n.d.). It was followed in 2001 by the O157:H7 strain that was responsible for a hemorrhagic colitis outbreak in the school of Sakai city in Japan (Hayashi et al., 2001). This study revealed a new facet of E. coli genomics as it identified important differences between the genome of the two strains, with a 859kb difference, and 1632 proteins not encoded in K12. Further studies showed similar results, and it became useful to distinguish between two categories of genes (fig 4). In the first one, called the genes of the core genome, we would consider the genes that are ubiquitous among the species or the group of genomes studied, meaning genes that we are assured to find in every new strain sampled. This group is accounting for around 2,000 genes in the E. coli genome. On the other hand, the second group represents the totality of the gene collected from the specie, which combines both the core genome and the accessory genes. It is composed of more than 15,000 genes. The extended set of genes is usually called the pan genome, but pan genome can sometimes also be used in opposition to the core genome, to designate the variable part of the
19
genome, meaning the genes for which the presence in a newly sequenced strain is uncertain. In this thesis, we will refer to pan genome for the whole set of genes and to accessory genes for the genes that are found only in subset of strains. Taking into account that the mean gene content of an E. coli strain is around 4 to 5 thousand genes, we can see that only half of those belongs to the core genome, while the rest of the genes are only partially found in the species. Those differences in genome could be explained by horizontal gene transfer, in which one strain from the same species, or not, transfers genes to a second one using plasmids or bacteriophages that mediate the dissemination of genetic material. Overall, those observations showed how plastic the genomes of E. coli can be, changing the vision that the scientific community had of a rather stable genome, to a highly dynamic structure with a constant flux of insertion and deletions of genes. As the conserved part is highly conserved and genes are not inserted randomly, the genomic organization of E. coli can be qualified as organized disorder (Touchon et al., 2009).
1.4.2 Difference in gene content and adaptation
Among the genes of the accessory genome that differed between pathogenic and non-pathogenic strain, one could identify genes related to non-pathogenicity that can be considered as
Fig 4: Representation of the all gene repertoire of E. coli. The pan genome designates the ensemble of gene that may be found in some E. coli genomes, while the core genome indicates the part of the genome that is common to all strain. Numbers given represent an approximate number of genes.
20
virulence factors. Indeed, when searching through the difference in gene content of the non-pathogenic K12 and non-pathogenic 0157:H7 strain, from Japan, the researcher were able to identify 131 genes that seemed to be related to virulence (Hayashi et al., 2001). Because those factors are generating diarrhea, we can easily understand that they have an adaptive value, as diarrhea offers a good way for a strain to move from one host to another. However things do not look so obvious when looking at extraintestinal pathogenic strains, for which the pathogenic phenotype does not confer any transmission advantage. It then became interesting to look into the reasons for the existence of such virulence factors. Indeed, they could seem to drive their carrier into an evolutionary dead end that would, by killing or weakening the host, reduce its own transmission to other host. This is even more troubling when we know that the loss of virulence seems relatively easy to achieve. Such a paradox could be explained by looking at the extraintestinal strains of the B2 phylogroup, for which virulence factors were identified as genes coding for adhesins or proteins involved in iron metabolism for instance. Indeed, such genes where also identified as being associated with persistence of the strains in the commensal microbiota (Le Gall et al., 2007). Furthermore, it was shown that deletion of all pathogenicity island of strain 536 came at a cost in a mice model of commensalism (Diard et al., 2010). In other words, it is because E. coli strains are selected to be highly competitive in one particular environment, the human gut for instance, that they can survive, grow and become consequently pathogenic in another environment such as the urinary tract. In the end, extraintestinal virulence in E. coli is suggested to be a coincidental by product of commensalism.
1.4.3 Difference in conserved genes and adaptation
Besides presence and absence of genes, adaptation may also rely on variation in conserved genes. How much of adaptation does rely on gene acquisition and how much is achieved by modifying the core genome remains an important question. Looking at gene presence and absence is easy, therefore, as soon as genomes were sequenced it was possible to do so. Researchers looked for instance at how to set apart the pathogenic strains from the commensal ones using the differences in genes content. While the virulence factors were identified in that way, presence and absence could not explain all the specificities of the E. coli phylogroups. As mentioned before these groups have specific patterns of prevalence and associated pathologies, yet, no clear group of genes were identified as being determinant for such a differentiation. For example, there was no clear signature in gene content of the B2 group, and horizontal transfer alone wasn’t sufficient to account for the differences between the different groups (Touchon et al., 2009). This shows that the differentiation of E. coli
21
phylogroups and phenotypes does not only come from the variation in gene content, but can also arise from modifications inside the core genome. An example of such gene modifications could be the ones observed in the fimH gene. This gene code for the type I fimbriae, a protein that is implicated in the binding of E. coli to mucosa. It was showed that naturally occurring mutations in fimH result in a better binding to the urinary tract. FimH mutations are therefore an important factor when shifting from the gut commensal habitat to the urinary tract more pathologic habitat (Sokurenko et al., 1998). Therefore it is of great interest to look at the microevolution of E. coli, if we want to gain a full insight its adaptation process in the different habitats humans offer.
22
2
I
N VITRO EXPERIMENTAL EVOLUTION
:
While ecological and evolutionary questions can be tackled using comparative and theoretical observations, bacteria offer the unique opportunity to study their adaptation in the laboratory, in the course of experimental evolution experiments. In such a approach, an organism is placed in a controlled environment in which growth is assured, and its evolution is assessed along the way by phenotypic and genotypic studies.
2.1 The different types of in vitro experimental evolution
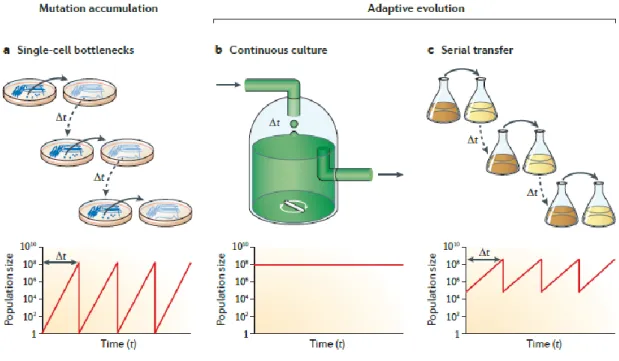
Three main techniques can be used to perform experimental evolution (Barrick and Lenski, 2013) (fig 5). They can be adapted to both unicellular and multicellular organisms:
- In the first method called mutation accumulation experiments, a random single individual of a population is sampled at each cycle (fig 5a). The resulting strong genetic bottleneck impedes the opportunity for selection and leads to the fixation of arbitrary mutations with any (but lethal) fitness value. This protocol is therefore used to quantify the mutation rates, biases and effect in the absence of the filtering action of natural selection. The simplest protocol is to plate a colony on a fresh agar plate daily and to pick a random colony on the incubated plate to initiate the next cycle.
-In the two other methods, on the other hand, selection for the fittest individual is at play, leading to an adaptive evolution. In these two methods, repeated growth is assured by a renewal of the media. The first way to do so, is to use a chemostat (fig 5b). A chemostat is a form of test tube in which a constant flow of new media is incoming while old media is continuously discarded from the culture. Bacteria present in the culture are therefore kept in a constant environment at the limit of starvation as they reach an equilibrium in which they exhaust all resources but the new coming ones. This system has several main drawbacks. First, expensive peristaltic pumps are needed so the replication is always limited as well as the power to analyze evolved lineages. Second contamination of the incoming nutrients is always an issue. Third, the bacteria can evolve to stick to the tube walls and are then no longer affected by the outgoing flux. Fourth, as bacteria are close to starvation the first mutations to invade the population are inactivation of rpoS, the general stress response that allow growth to persist in very low nutrient concentration. However such a pleiotropic mutation may not necessarily be desired.
23
- The last method developed to evolve bacteria in the laboratory is the use of serial transfers (fig 5c). In that setting, every cycle is characterized by the inoculation of a subsample of the previous cycle’s population in a fresh tube or flask filled with fresh media. The size of the bottleneck is set to maintain a sufficient number of individuals to keep genetic diversity high enough from transfer to transfer to allow adaptation to proceed (Barrick and Lenski, 2013). It is this form of experiment that was mainly used for experimental evolution studies implying E. coli. It has several benefits: it requires low technology equipment’s allowing (i) high replication, (ii) high analytical power for evolved lineages characterization (iii) low contamination rate. Moreover, there are no issues with biofilm formation. However, this system has one drawback: the environment is quite complex with a daily cycle of lag, exponential growth and stationary phase.
2.2 Long term evolution experiment (LTEE)
Since the 90ies serial transfer has become the dominant system with notably the most famous experiment using it. In 1988, Richard Lenski, at the University of California Irvine, (and now at
Fig 5: the different methods of experimental evolution and their effect on population sizes. (from Barrick and Lenski, 2013)
24
Michigan State university) started his now famous long term evolution experiment (LTEE) that is still running today (Lenski et al., 1991; Wiser et al., 2013). In that experiment, 12 replicate populations derived from E. coli B (a strain isolated by Felix d’Herelle) has been left to evolve through serial transfer on a daily basis with a 100 fold dilution in 10ml of fresh media containing very limited amount of glucose buffered with citrate. Every 500 generations (75 days) a frozen record of every population was stored for further studies. The revival of these samples allowed direct comparison with the ancestral clones for phenotypic assays or fitness measurements. In February 2016, the strains from Lenski’s experiment reached 64,000 generations of evolution. Many landmark papers have been published from that experiment, dealing with the emergence of innovation or, studying more basic facets of adaptation: fitness improvement (Wiser et al., 2013), and changes in mutation rates (Sniegowski et al., 1997). For instance, one of the most famous observations was the apparition of strains able to use the citrate of the media around the generation 31,000 (Blount et al., 2012, 2008). , Citrate is normally not accessible as a nutrient for E. coli. This interesting observation was furthermore reproducible with 19 different successful attempts at evolving citrate usage from the ancestor of the same lineage but only after the generation 20,000, suggesting that another older mutation was required for such a phenotype to appear.
2.3 Fitness improvement
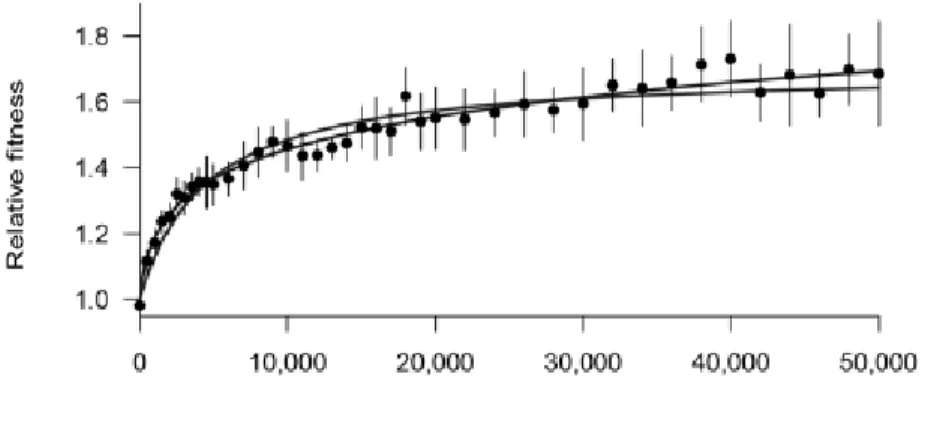
One of the most basic observation of the LTEE is that fitness is increasing with time. When comparing the fitness of the newly evolved strains to the ancestral strain of E. coli REL606, it was obvious that the strain had adapted to the new environment, having a fitness increased by almost a 1.65 fold at 50,000 generations (Wiser et al., 2013). In itself this observation is a validation of the experimental protocol, but it was also really interesting to see that the adaptation seemed to slow down through time. Indeed, if fitness seemed to increase by 65% at 50,000 generations, it was already almost at 50% at 10,000, and therefore had an increase of only 15% for 40,000 generations afterwards (fig 6). However even if adaptation slowed down, it was still present, and never stopped even after 50,000 generations of adaptation. Models using a power law seemed furthermore to fit best with the data, comforting a never-ending but always slower fitness increase. One reason for the decaying rate of adaptation may come from the fact that beneficial mutations have a lesser impact on fitness in the presence of other beneficial mutations, a phenomenon called diminishing return epistasis (Chou et al., 2011; Khan et al., 2011).
25
2.4 Mutator selection
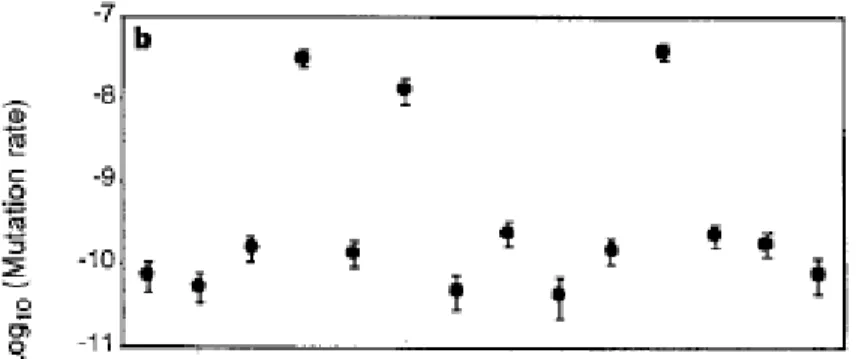
Another interesting observation that came out of the study of these lineages was the evolution of their mutation rate (Sniegowski et al., 1997). Mutation rates can be computed in two ways. Experimentally by plating the lineages on selective media: counting the selected mutants is then used to estimate a mutation rate. Now with genomics, analyses of the accumulation of mutations through time in the lineages can also be used to infer changes in mutation rates. An early study of the LTEE lineages at 10,000 generations revealed that 3 lineages, Ara-2 Ara-3 and Ara+4, out the 12 original lineages, where found to have an increased mutation rate (fig 7). Furthermore it was shown that the increased mutation rate remained in the population. This experiment then offered an interesting view on how mutator alleles spontaneously emerged, and raised to high frequency in populations adapting to new environments. Later studies using genomics have showed that 6 out of the 12 populations have become mutator populations (Tenaillon et al., 2016). Overall, 4 populations have inactivated genes in the mismatch repair gene and 2 populations have selected an inactivation of mutT. Interestingly, a close study of one of the population has revealed that mutation rate may decay after fixation of mutator alleles. Population Ara-1, in which mutator increased to fixation at around generation 25,000, showed a twofold decrease in mutation rate that emerged through two independent mutations in mutY. (See below) Furthermore, another population Ara-2, presented an even stronger mutation rate fluctuation as the mutation rate reverts towards its ancestral state after about 30,000 generations at high mutation rate. In that case, it is an exact reversion of the mutation that lead to the mutator
Fig 6: Relative fitness in comparison to the ancestral strain across 50,000 generations of the LTEE. The lines represents a hyperbolic model and a power law model (from Wiser et al 2013)
26
phenotype that was selected for (O. Tenaillon unpublished data). Hence the LTEE provides a complete picture of the rise and fall of mutator alleles or how natural selection may modulate mutation rate. As this aspect will be further investigated in the results of this thesis, I will now present some more details on the genetic control of mutation rate and how selection is affecting it.
2.5 Genetics of mutation rate
2.5.1 Control of mutation rate
During the life of a bacteria, its DNA can be altered in many different ways. Therefore several mechanisms exist in the cell to mitigate those mutations. They act at different levels (Friedberg et al., 2005)
-It is first during the replication phase that the higher risk of mutation can be observed. Indeed, the DNA polymerase can produce around one mismatch every 10,000 to 100,000 base pair. To counteract those replication errors, the DNA polymerase III, the one responsible of the main replication of the chromosome, possess a subunit encoded by the gene dnaQ, which allows for a proofreading function. Thanks to this subunit, the fidelity of the replication is multiplied by 10,000.
-After replication, some mistakes may have escaped the proofreading activity of the polymerase. a system known as the methyl-directed mismatch repair (MMR) is recruited is
Fig 7: Rates of mutations to nalidixic acid resistance in the 12 Ara- and Ara+ populations at 10,000 generations (from Sniegowski et al, 1997)
27
specialized in taking care of the remaining mismatches. It uses 3 proteins: MutH, MutS and MutL. The MutS protein detects the mismatch, and reacts with MutL to recruit and activates MutH into a complex. MutL filaments drive MutH to specific sites that are targets of methylation. Just after replication, there is a time window during which only the matrix strand is methylated while the neosynthetized strand has not yet been methylated. The MutH protein uses that asymmetric methylation to identify the neosynthetized strand. It then recruits a helicase and some exonuclease in order to cut the neosynthetized strand and degrade a fraction of it including the detected mismatch. DNA polymerase, PolIII (Li, 2008) is then recruited to resynthesize the degraded fraction (Harfe and Jinks-Robertson, 2000) (fig 9).
-In addition to replication errors, chemical of physical alteration of the DNA are also at the origin of mutations: they generate non-conventional structures that may be repaired or replicated
Fig 9: the bacterial paradigm for mismatch repair of DNA replication errors (Harfe and Jinks-Robertson, 2000)
28
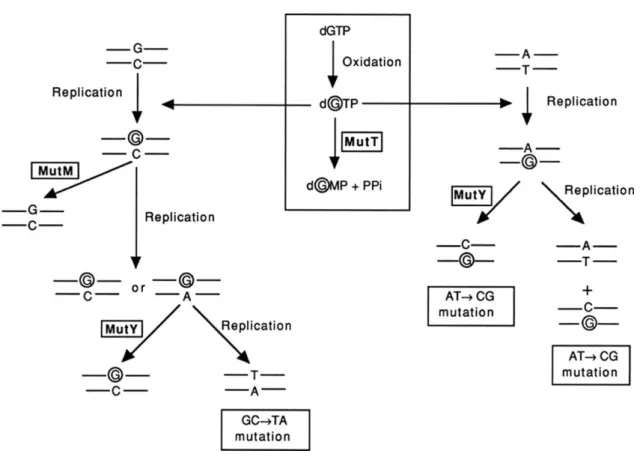
erroneously. One highly mutagenic damage is the oxidation of the dNTPs G in 8-oxo-GTP in the nucleotidic pool of the cell. Indeed once integrated in the DNA, the 8-oxo-GTP, can be matched equally with a dATP or a dCTP by the polymerases creating AT->CG mutations. To counteract these mutations, several enzymes have evolved and are conserved from bacteria to human. Among them, the MutT protein is able to hydrolyses 8-oxo-GTP in 8-oxoGDP before it is used for DNA replication (Fowler and Schaaper, 1997). The MutY and MutM glycolase also enter into action if the modified nucleotide is integrated inside the DNA. MutM removes the oxidized base in the Go:C pairs. MutY protein is acting on the Go:A mismatches that it resolves as if the A was the mis-incorporated base (fig 10).
If mutation is often discussed as needed for adaptation, the mutation rate resulting from the action of all these repairs and fidelity systems is extremely low. Using the synonymous mutations in
Fig 10: Consequences of incorporation of 8-oxodGTP opposite template C and A, and the role of the mutT or mutY and mutM genes in avoiding A·T→C·G and G·C→T·A transversion mutations. 8-oxodG is represented by a circled G. Not included in this diagram is oxidation of G to 8-oxoG while in DNA. These 8-oxoGs are thought to be processed as 8-oxoGs incorporated opposite C. If unrepaired by the MutM and MutY pathways, they will result in G·C→T·A transversion (from fowler and shaper, 1997)
29
the LTEE, an average per base mutation rate of 0.8 10-10 was found (Wielgoss et al., 2011). However, inactivation of the repair mechanisms lead to an increase in mutation rate. As different repair mechanisms play on different facets of the error correction and fidelity, their inactivation results in variable rates. For instance, inactivation of the Mismatch repair genes mutL or mutS, lead to an increase of about 100 fold, with mostly transitions. Inactivation of mutT, results in a 500-fold increase in AT to CG mutations. mutY inactivation results in a 10 fold increase in G to T mutations, however, it lead to a reduction of AT to CG mutation rate if mutT is inactivated. If mutT is not functional, then incorporation of Go in the DNA is the source of Go and not the oxidation of G in the DNA. As Go may be incorporated in front of an A with 50% chance, then mutY will treat the A as the source of problem and mis-repair it to a C enforcing the mutation. Hence, MutY inactivation can lead to an increase or a decrease in the overall mutation rate depending in which background it occurs.
2.5.2 Selection for and against increased mutation rate
How can selection act on mutation rate? Models of population genetics have been used to tackle this question for a century (Sturtevant, 1937). Selection of an allele changing the mutation rate may not directly result from its direct effect on fitness, but rather on the effect of the mutations it generates, a process called second order selection (Tenaillon et al., 2001). This process is particularly efficient in asexual populations in which an allele increasing the mutation rate or mutator allele remains physically linked to the mutations it produces and therefore may benefit or suffer from their fitness effect. As most mutations are deleterious, overproducing mutations is costly and alleles decreasing mutation rate owe to be selected for, as the low bacterial mutation rate suggest. However, simulations and theory show that a few beneficial mutations produced by the mutator alleles in excess may lead to an increase in mutator allele frequency (Tanaka et al., 2003). However, the association between beneficial mutations and mutator allele is only possible if the mutator population is large enough to produce some beneficial mutations. This has been experimentally tested in vitro or in the gut of mice by competing different fraction of mutator alleles with the wild type (Giraud, 2001). When the fraction of mutator is low, their subpopulation is not large enough to produce the rare beneficial mutations and they will eventually go extinct as they overproduce frequent deleterious mutations. On the other hand, the wild type population will be large enough to produce the rare beneficial mutations. When the frequency of mutator is higher they produce beneficial mutations and hitch-hike with those to high frequency and subsequently increase their chance to produce the next beneficial mutation (Chao and Cox, 1983). Theory has shown that a few large effect beneficial
30
mutations or some recurrent beneficial mutations due to changing environment were enough to select for mutator alleles in large populations despite a constant overproduction of deleterious mutations at much higher rates (Tanaka et al., 2003; Tenaillon et al., 1999). One easy way to select for mutator is to apply multiple antibiotic treatments (Mao et al., 1997). If the mutator is increasing X fold the mutation rate and its initial subpopulation is large enough to produce at least one resistant bacteria per round of selection, then each round of antibiotic treatment is increasing the mutator frequency by an X fold factor. With a 100 fold effect, the initial frequency is increased by a millions fold with three consecutive treatments. This type of selection is certainly responsible for the high prevalence of mutators in bacterial populations colonizing the lung of cystic fibrosis patient (Oliver, 2000).
Overall, theories and experimental data suggest that observing mutator alleles at high frequency in populations is a signature of an active process of adaptation, in which many beneficial mutations are being selected for, while the mutator allele hitchhikes with them.
2.6 Molecular bases of adaptation
2.6.1 Genetic convergence
In addition to observations on the dynamics of adaptation, experimental evolution provides also some insights on the molecular bases of adaptation. Sequencing costs allow now with the coupling of experimental evolution with deep sequencing to uncover the primary targets of natural selection. Using whole genome sequencing, we can compare the evolved lineages to the ancestral strain in order to identify mutations that have accumulated in the genome in the course of the experiment. Using this method 42 mutations were identified in the ARA-1 lineage from the LTEE experiment (Barrick et al., 2009). As none of the coding mutations were found to be synonymous mutations, it appears that most mutations should result from the action of natural selection rather than chance. Furthermore, convergence at the genes level could be observed between all the lineages of the LTEE experiment. When looking at 14 mutated genes from ARA-1 in the other 12 lineages, 3 mutations were present in all lineages, 9 mutations were found in another lineage, and only 2 genes were specific to ARA-1. This evolutionary convergence can be considered as a hallmark of adaptation: Mutations in genes that grant an adaptive advantage will be selected in several populations independently. In another study convergence was analyzed through the comparison of 115 lineages adapting to high temperature for 2,000 generations. Here again convergence was
31
observed and this time hundreds of different adaptive mutations were identified suggesting that many mutations can contribute to adaptation (Tenaillon et al., 2012).
2.6.2 Clonal interference
As both selection of mutators and multiple sign of convergence suggest, bacterial adaptation
in vitro is supported by many independent beneficial mutations. Yet, in asexual populations these
mutations cannot go to fixation simultaneously and they compete with one another in a phenomenon called clonal interference (Gerrish and Lenski, 1998). This phenomenon was demonstrated experimentally multiple times. For instance, Lang et al followed some asexual
population of yeast (Lang et al., 2013), and by sequencing the whole population at the genome level they could show that clusters of mutations were competing with one another until one finally
reaches fixation. In extreme cases, when one loci is under strong selection and has a high rate of beneficial mutation, clonal interference can even be seen within a gene: several mutations affecting the same gene are found segregating in the population. This was shown in Methylobacterium extorquens AM1 in which up to 17 beneficial alleles inactivating trfA coexisted in a single
population (Lee and Marx, 2013). So clonal interference seems to be the regime under which beneficial mutations evolve in experimental evolution.
2.6.3 Recruitment of mutations in global regulators
What types of mutations are found? At the molecular level all types of mutations can be found: single nucleotide polymorphisms (SNPs), indels, large deletions and duplications, IS element insertions. Many gene inactivations seem to be adaptive, but adaptation also recruit mutations in important or essential genes. In fact, among the first targets of adaptation, mutations in global regulators play an important role. In the LTEE, among the genes mutated early on across several lineages, two genes, spoT and topA were found to be implicated in the supercoiling of DNA (Cooper et al., 2003). As such, these genes are global regulators as coiling of DNA plays a role on the expression of many genes. In the thermal adaptation previously mentioned, the clearest target was the very pleiotropic RNA polymerase gene. In combination with other studies (Hindré et al., n.d.), these observations suggest that adaptation recruit first modifications in global regulatory pleiotropic hubs, controlling many genes, and later modification in more specialized regulators with a narrow
32
spectrum that adjust the effects of the first mutations (fig 11). This can be seen as a quick and dirty way to adapt to a new environment by selecting first for mutations that will have a great effect on the bacteria, and, in a second step of fine tuning, either by adjusting the possibly deleterious side effects of the first steps of adaptation, or adapting one step further.
33
Fig 11: In vivo evolution of regulatory networks. The structure of the network is hierarchical in the ancestral strain, with hub-encoding genes (dark blue circles) controlling many lower-level regulatory and target genes (light blue circles). The expression profiles of each gene as a function of growth conditions are shown as green curves, with the sum of all curves defining the phenotypic landscape of the individual. The early steps of experimental evolution are characterized by the occurrence of a mutation (yellow arrow) within a hub-encoding gene (red circle), which subsequently shows altered expression. These changes diffuse (red arrows) inside the entire connected network and affect the expression (red curves) of many genes. The overall effect is beneficial, but there are many pleiotropic effects. Later during evolution, compensatory mutations that correct for the deleterious effects of the early mutation affect lower-level genes (orange circles) in the regulatory network and almost restore their expression as well as the expression of some target genes (orange curves). This figure highlights the evolvable structure and organization of regulatory networks. (from Hindré et al, 2012)
34
The recruitment of global regulators in the early steps of adaptation seems to be a hallmark of bacterial experimental evolution in the laboratory. Yet, when one looks at the natural diversity present in these genes, it is surprising to see that they seem incredibly stable in nature. For instance the RNA polymerase genes, like rpoB are often found to be mutated in laboratory experiment, but seems to be really conserved in the wild (fig 12). Why are changes in this operon so often favored in experimental evolution whereas those genes are highly conserved in nature? There is no clear answer to these question, but this somehow suggests that these environment differ drastically from nature.
35
All this studies gave great insight the mechanisms that drives the adaptations of E. coli, and what factors are selected inside a population, But, if the LTEE and similar experiment allowed to identify several remarkable traits of E. coli adaption, it is still mainly based on bacteria cultivated in laboratory conditions, that are far from mimicking the natural habitat of the specie. Therefore to gain any medical, or even ecological insights, it is crucial to try to go further and to analyze E. coli’s differentiation in natura.
Fig 12: RNA polymerase B (rpoB) sequence alignments for replicate populations (rows) evolved at high temperature79 (top panel) and those in naturally occurring isolates148 (bottom panel). rpoB is targeted repeatedly in laboratory-based adaptation to high temperature, but is largely invariant between naturally occurring E. coli strains. Colors correspond to different base changes (A, green; C, blue; G, orange; T, red; and deletions, black). (from long et al 2015)
36
3 SHORT TERM EVOLUTION IN VIVO AND OBJECTIVES
The aim of this thesis is to use Next Generation Sequencing (NGS) to study the evolution of
E. coli in environments closer to nature than what has mostly been used in the laboratory. I will first
review knowledge on the evolution of E. coli in its natural environment.
3.1 Evolution in the mice
A good approach, to get a realistic vision of E. coli diversification in the wild, was to keep the experimental evolution aspect of the study but to change the environment of the experiment to something closer to the natural environment of the species. To do so several protocols were designed using mice’s gut, as E. coli is a commensal of the vertebrates’ gut. For instance, a study from 2001 used isogenic germ free mice (Giraud, 2001) bred on a sterile environment such that the gut is completely free of microbiota, offering a perfect habitat for E. coli without any competitors. The mice where then inoculated with a K12 strain. The researcher showed that, after 42 days, almost all the lineages had evolved and had sometimes gained high mutation rates through a mutation in a DNA repair gene, converging towards results from Lenski’s work. They later found that some global regulator were also involved in the early stages of adaptation (Giraud et al., 2008). However, these results have a limited power for two reasons. First the strain used was a laboratory strain, that has been passed in laboratory and mutagenized for decades (see below), second and most importantly for that experiment, germ free mice are far from any natural environment: first the immune system is quite abnormal as it has not fully matured due to the lack of bacterial challenging during development. Second, the physiology is very different with a massive septum full of mucus. Third this environment is really different from that of a natural situation, as the absence of other microbes leaves the whole niche to E. coli while it is naturally a minority species. To get closer to natural settings, other teams suggested the use of conventional mice treated with streptomycin. The use of streptomycin is required to allow the colonization of the gut by a streptomycin resistant E. coli. Although it alters some part of the microbiota, its effects are supposed to be minor on the dominant anaerobic microbiota. With that system, Barroso-baptista, observed in the course of 24 days a convergence towards the inactivation of the gat operon which is used in the metabolism of galactitol and in the oxygen pathway (Barroso-Batista et al., 2014). Galacticol being a part of the host’s metabolism of galactose, it was hypothesized that the bacteria were frequently exposed to it and therefore that the strain would be
37
selected for the gat-negative phenotype. The authors argued for a fast rate of adaptation in vivo. Yet, a closer look reveals some limitations of this approach. The strain used is a K12 E.coli for which the expression of gat operon is constitutive due to inactivation of its repressor. However, the repressor is conserved in all natural isolates suggesting it is under selective pressure in natural environments. Moreover other mutations in respiration could also results from the specificity of the strain, which has been grown on plates for a long time with high oxygen. All in all, we can clearly see that if those studies have results that seem to go along the observations made by the LTEE experiment, they still have some major defaults. Indeed they rely on using environments that are quite far from the natural ones of the bacteria, and on using E. coli strains that are also far from the natural ones, like the K12 strain, that has been used inside the laboratory for almost a century now. Hence, if these experiments suggest a move towards a more natural environment, it is still difficult to know if what was observed is comparable to what happens in the wild. To move further in that direction the use of E. coli K12 should not be taken as a realistic model for the evolution in natura of E. coli. It is necessary to move towards using both natural strains of E. coli and trying to get closer to natural environments of the bacteria for such experiment. In this line of thought, an experimental evolution mice gut study using strains of E. coli closer to the ones found in the wild, will be discussed in the first article, as this could give us a more realistic view of the adaptation of E. coli.
3.2 Evolution in human
3.3.1 Chronic infections
As mentioned early on, E. coli has a special relationship with human, and in that respect, the use of mice as a natural environment may be of limited interest. Mice have a different gut physiology, alimentation and metabolism and indeed E. coli is not the dominant enterrobacteria found in their gut (Nguyen et al., 2015). Yet, doing experimental evolution in humans is obviously a really difficult task, as it require for the strains to be maintained in the gut, the host to be checked regularly, and the intake of antibiotics to be regulated. Moreover, the environment cannot be maintained as constant as in the laboratory without rising some severe ethical issues. However studies found ways to go around such limitations, by following patients in a medicalized controlled environment. For instance, in other bacterial species, epidemiological studies followed the modification of one clone while it propagated in a population. Lieberman conducted a retrospective study on 14 subject with cystic fibrosis infected
38
in a Burkholderia dolosa outbreak (Lieberman et al., 2011). They analyzed 112 isolates collected over a period of 16 years. They identified 492 polymorphic loci. The mutations were accumulating at a steady rate of 2 single nucleotide polymorphisms per year, and using those it was possible to compute a maximum likelihood tree, which retraced the network of transmission between patients. Furthermore, they observed a great amount of evolutionary convergence, with 17 genes mutated independently amongst the different patients (fig 13). There was even a convergence at the functional level, as the mutated genes could be arranged in functional groups, O2 related gene regulation, antibiotic resistance, outer membrane synthesis, secretion, and a fifth group for which the functions were unknown. It is easy to make sense of some of those mutations, given the environment of the strains sequenced. We can correlate the O2 regulatory genes mutation with the pulmonary localization of the bacteria, the antibiotic resistance with the treatment received by the subject, and the secretion genes with pathogenicity. Given that some of the genes mutated here were not previously identified as being implicated in pathogenesis, such an observation can be of great medical interest. This pioneer study has however some specificities: the lungs of cystic fibrosis patients is not the natural environment of B. dolosa which is in that case an opportunistic pathogen.
Fig 13: the 17 genes under positive selection grouped by biological function. The color intensity indicates the number of mutations observed within this subject. The number of mutations is indicated left. (from Lieberman et al, 2011)
39
To study E. coli, a controlled within human evolution experiment was made in a case of UTI. In that study, the colonization of the bladder was carried out with controlled inoculation of a specific type of E. coli: asymptomatic bacteriuria strains (ABU). ABU infections are peculiar, as the E. coli strain colonizes the bladder of the patient, but do not result in a pathology. Because it expresses such an exceptional phenotype, the E. coli strain 83972, can be used for treatment of chronic urinary tracts infections. The strain colonizes the urinary tract, preventing the invasion of other pathogenic strains, while not harming the patient. As the strain remains in the urinary tract of the patient, its evolution can be studied in detail, as both the ancestral genome and its date of inoculation are known. A study was published in 2010, in which they inoculated 6 patients with strain 83972 and then re sampled it at several time points over a period of 423 days(Zdziarski et al., 2010). They identified 37 mutations, out of which 34 where genic. Amongst the genes mutated they observed signs of convergence, towards regulatory genes, those genes being mutated independently in different patients. For instance the gene barA was found mutated in two patients, and encodes for a protein that controls a global regulatory network affecting flagella or adhesins expression, and biofilm formation. It was previously proposed as a virulence trait in urinary tract infection. Other genes found mutated were implicated in adaptations to different stress conditions, like the gene fnr implicated in oxidative stress response, and mutated in two patients. For medical reasons three patients had to be re inoculated with the ancestral strain. This allowed the researchers to evaluate the reproducibility of the experiment. This second round of evolution revealed that several loci were repeatedly mutated. This observation is of great interest as it shows that such experiments are reproducible and that the mutations observed could not be due to drift, but represent an adaptation of the strain to the environment of the host. Furthermore they identified that the mutations lead mostly to loss of functions (fig 14). Similarly to
in vitro evolution, some regulators were found in the repeated targets of adaptation. This study
suggests that during pathogenesis some of the conclusions learned from experimental evolution in
vitro could be valid, but the specificity of the environment used requires further experiments before
40 3.3.2 Acute infections
An alternative approach to inoculation of strains, which can only be done in very specific conditions in humans, is to look at the diversity present in samples. For instance, following an infection, it may be interesting to sample several clones and study their diversity. This has been performed in E. coli with several extraintestinal infections. 226 isolates were gathered from 19 patients suffering from deep and closed E. coli infection. Using enterrobacterial repetitive intergenic consensus PCR (ERIC-PCR) and pulse field electrophoresis (PFGE), Levert el al (Levert et al., 2010) were able to explore the diversity of the samples. They first identified that 4 patients had a polyclonal infection, in which the strains sampled were coming from different phylogroups. Furthermore, micro heterogeneity, in which isolates appeared close but still different using ERIC-PCR and PFGE, was found in the 4 polyclonal infections, as well as in 7 monoclonal infections. The best hypothesis to explain this micro heterogeneity is then that the sampled bacteria have evolved from a common
Fig 14: different adaptational strategies of E. coli 83972 during prolonged growth in the bladder of 3 different human hosts: PIII-4, PI-2, PII-4. (from Zdziarski et al, 2010)